REVIEW 3 major objections 7 minor 1 cited by
Understanding trade-offs in classifier bias with quality-diversity optimization: an application to talent management
T0 review · 3 major / 7 minor · reviewed 2026-08-12 · deepseek-v4-flash
Pith's one-line read Quality-diversity search maps the accuracy-fairness trade-off in classifiers and finds the best model that satisfies the 80% rule.
desk verdict A practical QD-based tool for visualizing accuracy-fairness trade-offs, but the 80% rule implementation is sloppier than the paper admits and the statistics are thin. read the letter →
The pith
A machine-rendered reading of the paper's core claim, the machinery that carries it, and where it could break.
The reading
What carries the argument
The central machinery is CMA-ME (Covariance Matrix Adaptation MAP-Elites), a quality-diversity algorithm that fills a discretized map of behavior descriptors with the highest-fitness solution found for each cell. Here the descriptors are the two group-ratio bias measures and the fitness is classification accuracy; the fair zone is the rectangle where both ratios fall between 0.8 and 1.25, and bias magnitude is measured as Euclidean distance from the perfectly balanced point (1,1). This machinery turns the bias-accuracy trade-off into a spatial object that can be inspected, and it converts model multiplicity into an explicit menu of alternatives.
What would settle it
Re-running the pipeline on a dataset with known demographic bias and finding that the most accurate models already lie inside the fair zone would falsify the claim that biased data push the high-accuracy region to the biased side of the map; alternatively, evaluating the fair-zone selections under a different fairness measure such as equalized odds and finding them still unfair would show that the 80%-rule transfer is insufficient.
Extended reading notes
Core claim
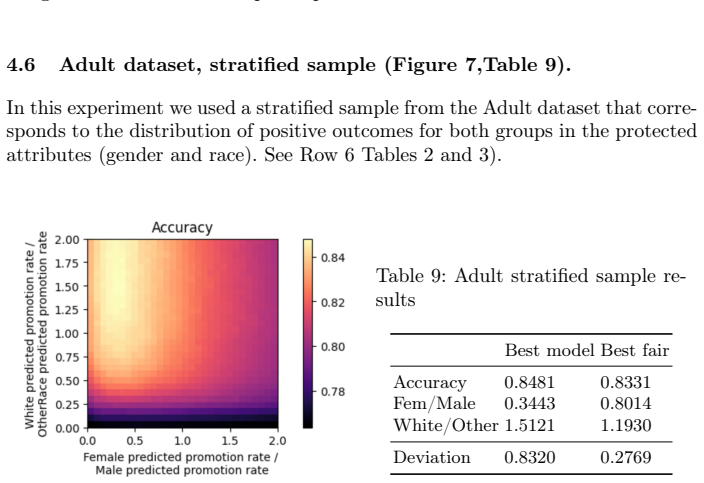
The central claim is that CMA-ME can illuminate the space of classifiers by evolving weights of a fixed neural-network architecture while scoring each model on accuracy and characterizing it by two bias descriptors, each the ratio of predicted positive rates between groups in a protected attribute. In datasets with deliberately inserted demographic bias, the most accurate model on the map lands outside the fair zone (for example, a female/male predicted ratio of 0.24 in the male-biased promotion sample), while the most accurate model inside the fair zone has a far higher ratio (0.83) at an accuracy cost of about 4 points in that scenario. In the unbiased samples the best model already lies inside the fair zone, and the accuracy difference is essentially zero. The maps themselves show that the region of high accuracy shifts toward the descriptor values that match the bias in the training data, which the authors read as a visual diagnostic of the dataset's bias.
Load-bearing premise
The method's fairness judgement rests entirely on the ratio of predicted positive rates between protected groups, with the legal 80% rule applied to that ratio, and the paper never argues that this ratio is a valid proxy for the adverse impact the rule was designed to detect.
Editorial extensions
If this is right
- Users can see, before deployment, exactly how much accuracy they give up to meet a fairness constraint defined by the 80% rule.
- The map acts as a diagnostic of the training data: biased data push the high-accuracy region to the biased side of the map, making the data's bias visible without a separate fairness audit.
- In every biased scenario tested, a model inside the fair zone was found, showing that satisfying the 80% rule is compatible with near-best accuracy on these tasks.
- The method exploits model multiplicity: many classifiers with similar accuracy but different bias profiles exist, and quality-diversity search makes them explicit deployment options.
- The approach scales to networks with tens of thousands of parameters and applies naturally to tabular data such as credit scoring and hiring support.
Reading between the lines
- The reported 0.915 correlation between accuracy sacrificed and bias-distance reduced suggests a nearly deterministic trade-off frontier; one could test whether this relationship persists across other datasets, protected attributes, and classifier families.
- Because the fair zone is defined by the 80% rule applied to predicted positive rates, the map inherits that rule's limitations: it measures only one form of disparate impact, not equalized odds or calibration, so a decision-maker choosing a model from the map should still check it against other fairness definitions.
- The same map machinery could be extended to decision trees (for interpretability) and to large vision models via differentiable quality-diversity methods, generalizing the visualization to high-dimensional, non-tabular inputs.
- The approach could also serve as an auditing tool: given a deployed classifier, one could locate its bias descriptors on the map and see whether a better, fairer alternative exists in its neighborhood.
Signed reviews
Editorial analysis
A structured set of objections, weighed in public.
Referee Report
Summary. The paper proposes a quality-diversity approach, specifically CMA-ME, to evolve a population of neural network classifiers and archive them on a two-dimensional map whose axes are ratios of predicted positive rates between protected groups. From the resulting accuracy-colored map, the authors identify the most accurate model overall and the most accurate model inside a "fair zone" defined by the 80% rule ([0.8, 1.25]), and compare their accuracy and Euclidean distance from (1,1). Experiments on a Promotion dataset with several synthetic bias conditions and on the Adult dataset produce heat maps and summary tables. The paper claims that this method visualizes the bias-accuracy trade-off, reveals where biased data concentrate high-accuracy models, and lets users select the best model that satisfies a minimum fairness threshold.
Significance. If the operationalization is correct, the paper offers a useful and fairly novel way to exploit model multiplicity: instead of optimizing a single accuracy-fairness objective, it illuminates a landscape of trade-offs and lets a human user pick a model. The use of CMA-ME for bias characterization rather than bias mitigation is a reasonable contribution, and the qualitative patterns in Figures 2-7 are plausible: biased datasets concentrate high-accuracy models in map regions matching the data bias. The paper also provides code and does not fit free parameters to produce its central qualitative claim, so the core visualization idea is not circular. However, the central claim that the fair zone implements the legal 80% rule is threatened by an implementation ambiguity in Algorithm 2, and the paper's quantitative claims rest on single stochastic runs with no uncertainty quantification.
major comments (3)
- [Section 3, Algorithm 2 Step 2] The fairness descriptors are computed as mean_xa / (mean_xb + epsilon) and mean_ya / (mean_yb + epsilon), i.e., ratios of mean network outputs, not ratios of positive predicted rates. The 80% rule quoted in Section 2.1 is defined for selection rates: the number of positive decisions divided by group size. The paper never states that the network outputs are thresholded to labels before averaging, nor does it report any decision threshold. Consequently, a model inside the fair zone [0.8, 1.25] could have a predicted-positive-rate ratio outside that interval, and the "best fair" models in Tables 4-9 may not actually comply with the 4/5 rule. Please either threshold the outputs before computing the ratios and report the threshold, or explicitly redefine the descriptors as score ratios and argue why the 80% rule applies to those ratios.
- [Section 4 and Section 6] All reported results appear to come from single stochastic CMA-ME runs. Tables 4-9 give point estimates with no error bars, repeated-seed variation, or statistical significance tests. In particular, the headline correlation of 0.9150 in Section 6 is computed from only six experiments, with no confidence interval or significance assessment. Since CMA-ME is a stochastic search algorithm, specific numbers such as the accuracy drops of 0.0106 to 0.0431 may not be reproducible. Please add multiple runs with different seeds and report variance, or substantially temper the quantitative claims and present the paper as a qualitative proof of concept.
- [Section 5] The statement that "The maximum accuracy obtained by the models in our experiment is slightly lower than what could be attained by a sophisticated conventional learning algorithm" is not supported by any comparison experiment in the paper. No baseline classifier results are reported for the same datasets and train/test splits. Please either add such a comparison or explicitly label this statement as a conjecture rather than a finding.
minor comments (7)
- [Abstract] The opening sentence has a missing space: "Fairness,theimpartial treatment" should read "Fairness, the impartial treatment".
- [Section 2.1] There is a duplicated article in "using a a dataset of promotion decisions"; it should be "using a dataset".
- [Section 4.3] The text refers to "(Row 2 Tables 2 and 3)" for the male-oversampled case, but the oversampled dataset appears in Row 3 of both tables.
- [Table 1 and Section 4] There are several typos: "Hiden layers" should be "Hidden layers" in Table 1; "Euclidian" should be "Euclidean" in the bullet list of Section 4; and "withing" should be "within" in the same list.
- [Section 4.4] The cross-biased sample is described as having higher promotion rates for male+old and female+young subgroups, but Table 3 only reports marginal rates, all equal to 0.50. Please report the four intersectional subgroup rates so the reader can verify the intended construction.
- [Figure 1] The fair-zone figure lacks axis labels and a detailed caption. Adding axes, the (1,1) reference point, and a clear description of the shaded region would make the definition of the fair zone easier to check.
- [Reproducibility] The GitHub repository is referenced without a version identifier or DOI; please archive the code and data-generation scripts at a permanent repository for reproducibility.
Circularity Check
No significant circularity: the fairness-accuracy trade-off is read from a CMA-ME map using an external 80% rule threshold, not from a fitted parameter or a self-citation chain.
full rationale
The paper's central claim is that CMA-ME can produce a map of classifiers whose accuracy is plotted against fairness descriptors, and that the best classifier inside a 'fair zone' defined by [0.8, 1.25] gives a measurable accuracy trade-off. No fitted parameter is used to produce the reported trade-offs: the descriptors are computed from model predictions, the fitness is raw accuracy, and the fair-zone bounds come from the EEOC's 80% rule, an external regulatory standard. The 'best fair' model is selected from the search map, not predicted from a fitted input, so the central claim is not circular. Self-citations in the paper (e.g., CMA-ME from Fontaine et al. 2020, and scalability references) support algorithm choice and future-work directions rather than the fairness-accuracy result, so they are not load-bearing. One internal inconsistency does exist: Algorithm 2 computes descriptors as ratios of mean network outputs (mean_xa / (mean_xb + epsilon)), while Sections 3 and 4 describe them as ratios of positive prediction rates; if predictions are not thresholded before averaging, the fair zone may not implement the legal 4/5 rule. This is a validity or correctness risk, not a circularity, because the paper's own definitions and the external standard are not being used to manufacture the result.
Assumptions & free parameters
free parameters (4)
- Epsilon in ratio denominator
- Number of map bins =
30
- Neural network architecture =
[35,15] for Promotion, [64,32] for Adult
- CMA-ME evaluation budget and emitter parameters
assumptions (4)
- domain assumption Predicted positive rate ratio is a valid proxy for group fairness.
- domain assumption The 80% rule applies to these predicted positive rate ratios and defines a fair zone of 0.8 to 1.25.
- domain assumption CMA-ME finds the best or near-best model in each map cell within the evaluation budget.
- standard math Accuracy is the appropriate performance objective for the classifiers.
Cite this review
Pith. "Pith review of Understanding trade-offs in classifier bias with quality-diversity optimization: an application to talent management." pith.science (2026). https://pith.science/paper/ZPIYD5YF
@misc{pith2026241116965,
  author       = {Pith},
  title        = {Pith review of: Understanding trade-offs in classifier bias with quality-diversity optimization: an application to talent management},
  year         = {2026},
  howpublished = {\url{https://pith.science/paper/ZPIYD5YF}},
  note         = {Machine review of arXiv:2411.16965}
}
read the original abstract
Fairness,the impartial treatment towards individuals or groups regardless of their inherent or acquired characteristics [20], is a critical challenge for the successful implementation of Artificial Intelligence (AI) in multiple fields like finances, human capital, and housing. A major struggle for the development of fair AI models lies in the bias implicit in the data available to train such models. Filtering or sampling the dataset before training can help ameliorate model bias but can also reduce model performance and the bias impact can be opaque. In this paper, we propose a method for visualizing the biases inherent in a dataset and understanding the potential trade-offs between fairness and accuracy. Our method builds on quality-diversity optimization, in particular Covariance Matrix Adaptation Multi-dimensional Archive of Phenotypic Elites (MAP-Elites). Our method provides a visual representation of bias in models, allows users to identify models within a minimal threshold of fairness, and determines the trade-off between fairness and accuracy.
Figures


Figures from the paper (4 more)


Forward citations
Cited by 1 Pith paper
-
What Constitutes a Less Discriminatory Algorithm?
The paper argues that less discriminatory algorithms cannot be defined by quantitative performance metrics alone and must incorporate a reasonableness standard, with feasible but computationally hard search problems.
Reference graph
Works this paper leans on
-
[1]
Albemarle Paper Co. v. Moody, 422 U.S. 405 (1975)
work page 1975
-
[2]
UCI Machine Learning Repository (1996), DOI: https://doi.org/10.24432/C5XW20
Becker, B., Kohavi, R.: Adult. UCI Machine Learning Repository (1996), DOI: https://doi.org/10.24432/C5XW20
doi:10.24432/c5xw20 1996
-
[3]
In: Proceedings of the 2022 ACM Conference on Fairness, Account- ability, and Transparency
Black, E., Raghavan, M., Barocas, S.: Model multiplicity: Opportunities, concerns, and solutions. In: Proceedings of the 2022 ACM Conference on Fairness, Account- ability, and Transparency. pp. 850–863 (2022)
work page 2022
-
[4]
Chen, Z., Zhang, J.M., Sarro, F., Harman, M.: A comprehensive empirical study of bias mitigation methods for machine learning classifiers. ACM Transactions on Software Engineering and Methodology32(4), 1–30 (2023) Understanding trade-offs in classifier bias with quality-diversity optimization 15
work page 2023
-
[5]
Code of Federal Regulations (CFR): Uniform guidelines on employee selec- tion procedures (1978). https://www.ecfr.gov/current/title-29/subtitle-B/ chapter-XIV/part-1607?toc=1 (1978), title 29, Subtitle B, Chapter XIV, Part 1607
work page 1978
- [6]
-
[7]
Nature 521(7553), 503–507 (2015)
Cully, A., Clune, J., Tarapore, D., Mouret, J.B.: Robots that can adapt like ani- mals. Nature 521(7553), 503–507 (2015)
work page 2015
-
[8]
IEEE Transactions on Evolutionary Computation22(2), 245–259 (2017)
Cully, A., Demiris, Y.: Quality and diversity optimization: A unifying modu- lar framework. IEEE Transactions on Evolutionary Computation22(2), 245–259 (2017)
work page 2017
Show all 38 references
-
[9]
Advances in Neural Information Processing Systems34, 10040–10052 (2021)
Fontaine, M., Nikolaidis, S.: Differentiable quality diversity. Advances in Neural Information Processing Systems34, 10040–10052 (2021)
2021
-
[10]
In: Proceedings of the 2020 genetic and evolutionary computation conference
Fontaine, M.C., Togelius, J., Nikolaidis, S., Hoover, A.K.: Covariance matrix adap- tation for the rapid illumination of behavior space. In: Proceedings of the 2020 genetic and evolutionary computation conference. pp. 94–102 (2020)
2020
-
[11]
Duke Power Co., 401 U.S
Griggs v. Duke Power Co., 401 U.S. 424 (1971)
1971
-
[12]
In: Proceedings of the 22nd ACM SIGKDD international conference on knowledge discovery and data mining
Hajian, S., Bonchi, F., Castillo, C.: Algorithmic bias: From discrimination discov- ery to fairness-aware data mining. In: Proceedings of the 22nd ACM SIGKDD international conference on knowledge discovery and data mining. pp. 2125–2126 (2016)
2016
-
[13]
Evolutionary computation9(2), 159–195 (2001)
Hansen, N., Ostermeier, A.: Completely derandomized self-adaptation in evolution strategies. Evolutionary computation9(2), 159–195 (2001)
2001
-
[14]
Hellström,T.,Dignum,V.,Bensch,S.:Biasinmachinelearning-whatisitgoodfor? In:InternationalWorkshoponNewFoundationsforHuman-CenteredAI(NeHuAI) co-located with 24th European Conference on Artificial Intelligence (ECAI 2020), Virtual (Santiago de Compostela, Spain), September 4, 20...
2020
-
[15]
Hoffman, S., Podgurski, A.: Artificial intelligence and discrimination in health care. Yale J. Health Pol’y L. & Ethics19, 1 (2019)
2019
-
[16]
IEEE Transactions on Artificial Intelligence4(4), 799–819 (2022)
Huang, C., Zhang, Z., Mao, B., Yao, X.: An overview of artificial intelligence ethics. IEEE Transactions on Artificial Intelligence4(4), 799–819 (2022)
2022
-
[17]
arXiv preprint arXiv:2305.07710 (2023)
Jain, A., Memon, N., Togelius, J.: Zero-shot racially balanced dataset generation using an existing biased stylegan2. arXiv preprint arXiv:2305.07710 (2023)
2023 arXiv
-
[18]
ACM Computing Surveys (2024)
Li, J., Li, G.: The triangular trade-off between robustness, accuracy and fairness in deep neural networks: A survey. ACM Computing Surveys (2024)
2024
-
[19]
Explainable and interpretable models in computer vision and machine learning pp
Liem, C.C., Langer, M., Demetriou, A., Hiemstra, A.M., Sukma Wicaksana, A., Born, M.P., König, C.J.: Psychology meets machine learning: Interdisciplinary per- spectives on algorithmic job candidate screening. Explainable and interpretable models in computer vision and machine ...
2018
-
[20]
ACM Computing Surveys (CSUR)54(6), 1–35 (2021)
Mehrabi, N., Morstatter, F., Saxena, N., Lerman, K., Galstyan, A.: A survey on bias and fairness in machine learning. ACM Computing Surveys (CSUR)54(6), 1–35 (2021)
2021
-
[21]
In: Proceedings of the 2023 ACM Con- ference on Fairness, Accountability, and Transparency
Meyer, A.P., Albarghouthi, A., D’Antoni, L.: The dataset multiplicity problem: How unreliable data impacts predictions. In: Proceedings of the 2023 ACM Con- ference on Fairness, Accountability, and Transparency. pp. 193–204 (2023)
2023
-
[22]
arXiv preprint arXiv:1504.04909 (2015)
Mouret, J.B., Clune, J.: Illuminating search spaces by mapping elites. arXiv preprint arXiv:1504.04909 (2015)
2015 arXiv
-
[23]
https://www.kaggle.com/ datasets/arashnic/hr-ana (2019)
Möbius: Hr analytics: Employee promotion data. https://www.kaggle.com/ datasets/arashnic/hr-ana (2019)
2019
-
[24]
ACM Comput- ing Surveys (CSUR)55(3), 1–44 (2022) 16 C.M
Pessach, D., Shmueli, E.: A review on fairness in machine learning. ACM Comput- ing Surveys (CSUR)55(3), 1–44 (2022) 16 C.M. Jaramillo et al
2022
-
[25]
Frontiers in Robotics and AI p
Pugh, J.K., Soros, L.B., Stanley, K.O.: Quality diversity: A new frontier for evo- lutionary computation. Frontiers in Robotics and AI p. 40 (2016)
2016
-
[26]
Schwartz, R., Schwartz, R., Vassilev, A., Greene, K., Perine, L., Burt, A., Hall, P.: Towards a standard for identifying and managing bias in artificial intelligence, vol. 3. US Department of Commerce, National Institute of Standards and Tech- nology (2022)
2022
-
[27]
In: Proceedings of the 24th ACM SIGKDD international conference on knowledge discovery & data mining
Speicher, T., Heidari, H., Grgic-Hlaca, N., Gummadi, K.P., Singla, A., Weller, A., Zafar, M.B.: A unified approach to quantifying algorithmic unfairness: Measuring individual &group unfairness via inequality indices. In: Proceedings of the 24th ACM SIGKDD international confere...
2018
-
[28]
In: Proceedings of the 1st ACM Conference on Equity and Access in Algorithms, Mechanisms, and Optimization
Suresh, H., Guttag, J.: A framework for understanding sources of harm throughout the machine learning life cycle. In: Proceedings of the 1st ACM Conference on Equity and Access in Algorithms, Mechanisms, and Optimization. pp. 1–9 (2021)
2021
-
[29]
Communications of the ACM 56(5), 44–54 (2013)
Sweeney, L.: Discrimination in online ad delivery. Communications of the ACM 56(5), 44–54 (2013)
2013
-
[30]
IEEE Robotics and Automation Letters (2023)
Tjanaka, B., Fontaine, M.C., Lee, D.H., Kalkar, A., Nikolaidis, S.: Training di- verse high-dimensional controllers by scaling covariance matrix adaptation map- annealing. IEEE Robotics and Automation Letters (2023)
2023
-
[31]
Tjanaka, B., Fontaine, M.C., Lee, D.H., Zhang, Y., Balam, N.R., Dennler, N., Garlanka, S.S., Klapsis, N.D., Nikolaidis, S.: pyribs: A bare-bones python library for quality diversity optimization (2023)
2023
-
[32]
In: Proceedings of the inter- national workshop on software fairness
Verma, S., Rubin, J.: Fairness definitions explained. In: Proceedings of the inter- national workshop on software fairness. pp. 1–7 (2018)
2018
-
[33]
Evolutionary Intelligence4, 3–16 (2011)
Wang, P., Weise, T., Chiong, R.: Novel evolutionary algorithms for supervised classification problems: an experimental study. Evolutionary Intelligence4, 3–16 (2011)
2011
-
[34]
Fort Worth Bank i& Trust, 487 U.S
Watson v. Fort Worth Bank i& Trust, 487 U.S. 977 (1988)
1988
-
[35]
In: Proceedings of the 2023 ACM Conference on Fairness, Accountability, and Transparency
Watson-Daniels, J., Barocas, S., Hofman, J.M., Chouldechova, A.: Multi-target multiplicity: Flexibility and fairness in target specification under resource con- straints. In: Proceedings of the 2023 ACM Conference on Fairness, Accountability, and Transparency. pp. 297–311 (2023)
2023
-
[36]
IEEE Transactions on Evolutionary Computation (2024)
Zhang, Q., Liu, J., Yao, X.: Fairness-aware multiobjective evolutionary learning. IEEE Transactions on Evolutionary Computation (2024)
2024
-
[37]
In: International conference on artificial neural networks
Zhang, Q., Liu, J., Zhang, Z., Wen, J., Mao, B., Yao, X.: Fairer machine learn- ing through multi-objective evolutionary learning. In: International conference on artificial neural networks. pp. 111–123. Springer (2021)
2021
-
[38]
IEEE transactions on evolutionary computation 27(4), 848–862 (2022)
Zhang, Q., Liu, J., Zhang, Z., Wen, J., Mao, B., Yao, X.: Mitigating unfairness via evolutionary multiobjective ensemble learning. IEEE transactions on evolutionary computation 27(4), 848–862 (2022)
2022
Reviewed August 12, 2026 · model on record in the stance chip above.
Discussion (0). Continue with ORCID to comment.