REVIEW 3 major objections 6 minor 112 references
Self-regulated growth of galaxy sizes along the star-forming main sequence
T0 review · 3 major / 6 minor · reviewed 2026-08-12 · deepseek-v4-flash
Pith's one-line read For 997 galaxies at z 0.5–2, the sign of the central-to-outskirt star-formation ratio flips at the main-sequence ridge, predicting whether a galaxy shrinks or grows.
desk verdict A plausible but not-yet-established observational confirmation of the predicted outside-in/inside-out growth pattern across the MS; the key correlation shares SED-fit noise on both axes, so it needs a robustness test before it can anchor the self-regulation picture. read the letter →
The pith
A machine-rendered reading of the paper's core claim, the machinery that carries it, and where it could break.
The reading
What carries the argument
The load-bearing object is the spatially resolved star formation history reconstructed pixel-by-pixel with an exponentially declining tau model, split into a central region within the half-mass ellipse R50s and an outskirts region from 1 to 3 R50s. These histories yield the 100 Myr specific star formation rates and mass-weighted ages for each region, summarized as sSFR100,central/sSFR100,outskirts and t50,central/t50,outskirts. The comparison quantity is ΔMS = log(sSFR100,galaxy/sSFRMS), where the main sequence ridge is fitted as sSFRMS = sb (M⋆/$10^{10}$ M⊙)^β (1+z)^μ with best-fit values sb = 0.22, β = −0.39, and μ = 0.85.
What would settle it
Observe the same sample with spatially resolved nebular emission maps, such as H-alpha or [O II], to measure the current central-to-outskirt sSFR ratio independently of SED modeling; if the sign of the ratio does not flip from positive to negative as galaxies cross ΔMS = 0, or if galaxies with positive ratios show no subsequent decrease in half-mass radius, the self-regulation claim would be falsified.
Extended reading notes
Core claim
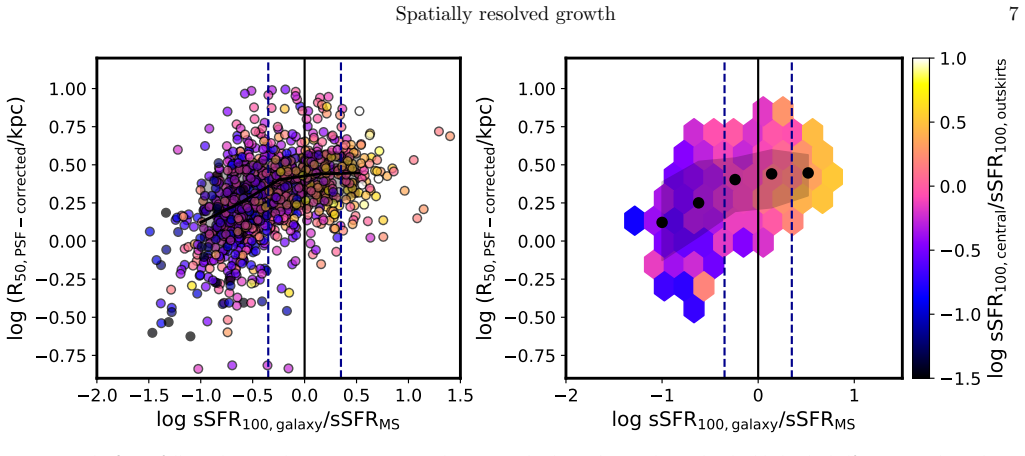
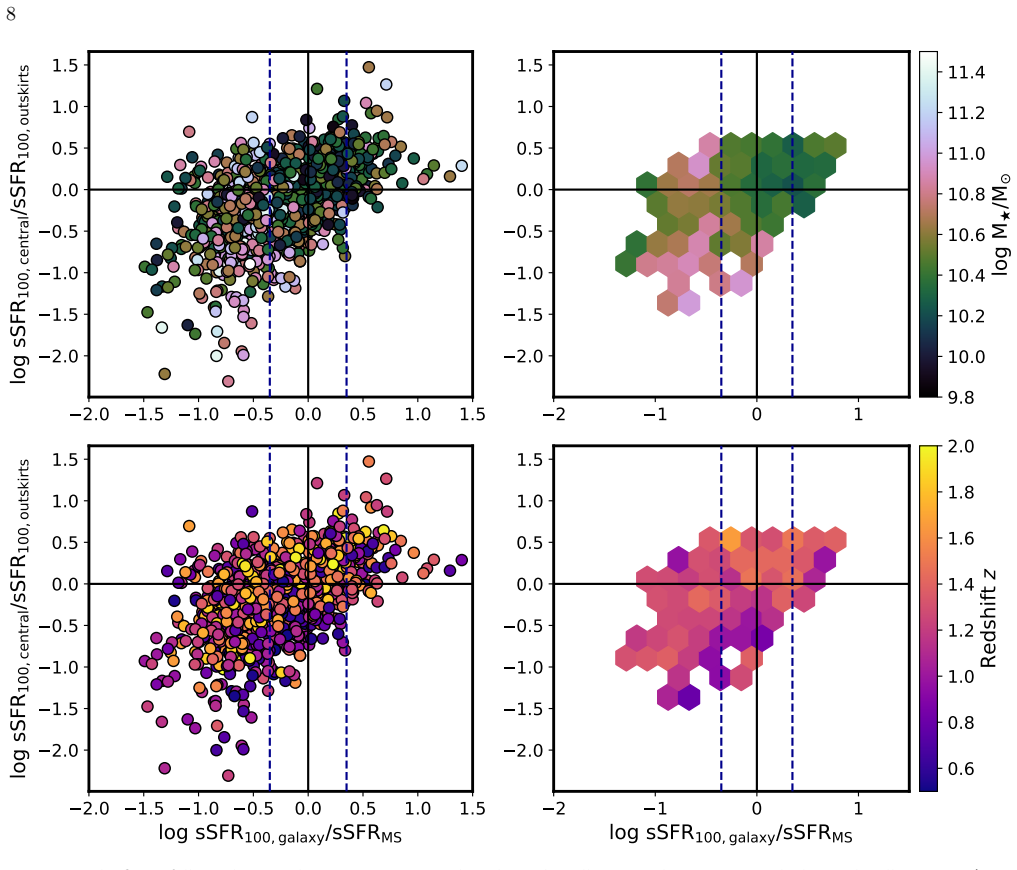
The central discovery is a correlation between the spatially resolved specific star formation rate ratio, log(sSFR100,central/sSFR100,outskirts), and the distance from the main sequence, ΔMS, with a partial correlation of 0.48 ± 0.02 after taking stellar mass and redshift into account. Galaxies above the main sequence ridge (ΔMS > 0) show centrally enhanced specific star formation, meaning their stellar mass doubles faster inside the half-mass ellipse than outside, which is outside-in growth and a shrinking half-mass radius. Galaxies below the ridge (ΔMS < 0) show the reverse, with more active star formation in the outskirts, inside-out growth, and an expanding half-mass radius. The trend anticorrelates with galaxy size: larger galaxies above the main sequence are shrinking while smaller galaxies below it are growing, which the authors interpret as self-regulation of size growth along the main sequence. Mass-weighted age ratios independently support the same picture, with younger centers in galaxies above the main sequence and similar central and outskirts ages in galaxies below it.
Load-bearing premise
The whole analysis assumes that pixel-by-pixel SED fitting with a single exponentially declining tau model recovers the true spatially resolved star formation histories, so if real star formation histories are more complex, every derived sSFR ratio, the fitted main-sequence ridge, and the ΔMS correlation could change.
Editorial extensions
If this is right
- A galaxy's offset from the main sequence ridge predicts the direction of its size evolution: above the ridge galaxies build their centers and shrink, while below the ridge they build their outskirts and grow.
- The anticorrelation between growth direction and size keeps the size–mass relation nearly flat, matching the observed shallow slopes for star-forming galaxies.
- The pattern holds across stellar masses from about 10^9.8 to 10^11.5 solar masses and redshifts 0.5 to 2.0, with no strong redshift dependence, meaning the self-regulation cycle operates over several billion years of cosmic time.
- Massive galaxies below the main sequence show depleted centers with active outskirts, connecting the growth-direction picture to inside-out quenching and the transition toward quiescence.
- The observed sequence—central enhancement above the main sequence, central depletion, then outward growth—supports an oscillatory, rather than monotonic, drift around the main sequence, consistent with compaction-driven bulge growth followed by disc regrowth.
Reading between the lines
- If the correlation is causal, the relatively cheaply measured ΔMS could serve as a proxy for the direction of size evolution in large surveys that lack spatially resolved data.
- The paper notes in Section 2.4 that its main sequence normalization depends on the assumed star formation history model, so rerunning the analysis with nonparametric or bursty star formation histories would test whether the sign flip at ΔMS = 0 is an artifact of the tau model.
- The natural next test is to follow individual galaxies through repeated compaction and regrowth cycles in simulations, which would quantify how much of the flat size–mass relation arises from this oscillation rather than from steady growth.
- Extending this analysis to z > 3 with JWST would reveal whether the same compaction–depletion–regrowth cycle operated near the peak of cosmic star formation or whether early galaxies grew more monotonically.
Editorial analysis
A structured set of objections, weighed in public.
Referee Report
Summary. The paper presents spatially resolved star formation histories for ~997 galaxies in GOODS-South at 0.5≤z≤2.0, derived from pixel-by-pixel SED fitting with an exponentially declining tau model. Dividing each galaxy into a central region within the half-mass ellipse and an outer annulus, the authors compute the ratio of 100-Myr specific star formation rates in the two regions and correlate it with the galaxy's offset from the star-forming main sequence (ΔMS), finding a partial correlation of 0.48±0.02 after controlling for stellar mass and redshift. They interpret this as evidence for self-regulated size growth: galaxies above the MS grow outside-in (central build-up), while those below grow inside-out (outer star formation), connecting the MS scatter to structural evolution.
Significance. If correct, this is a valuable observational result: it directly links the position of a galaxy relative to the star-forming main sequence to the spatial distribution of recent star formation, providing a possible mechanism for the near-constant scatter of the MS and for the flat size–mass relation. The analysis uses a reasonably large, homogeneous HST/CANDELS sample and includes useful robustness checks (varying the central aperture definition in Sec. 2.3, restricting to star-forming galaxies). The partial-correlation framework is appropriate for separating the gradient–ΔMS relation from mass and redshift trends. However, the central claim rests on pixel-level SED fitting with a single, restrictive SFH model, and no null test is presented that would separate a true physical correlation from one induced by shared measurement errors between the two axes of Fig. 4.
major comments (3)
- [Sec. 3.1 / Fig. 4, with Secs. 2.2 and 2.4] The two variables in Fig. 4, log(sSFR100,central/sSFR100,outskirts) and ΔMS = log(sSFR100,galaxy/sSFRMS), are both constructed from the same pixel-by-pixel SED fits (Sec. 2.2). Pixel-fit errors in the central and outer regions enter the y-axis with opposite signs and also enter the galaxy-integrated sSFR that defines ΔMS, so correlated, spatially varying fit errors can generate a spurious correlation. The aperture checks in Sec. 2.3 reuse the same fitted pixel maps and therefore cannot diagnose this effect, and the star-forming-only subsample does not break the shared-noise covariance. The authors should add a null test that preserves the pixel error covariance while destroying the physical relation—for example, randomly permuting central/outskirt pixel assignments within each galaxy, or simulating mock galaxies with no intrinsic gradient but with the same noise properties—and show that the partial correlation is not reproduced by noise alone.
- [Sec. 2.2] The analysis relies on a single exponentially declining tau model with τ in [0.01, 1.0] Gyr, fixed Chabrier IMF and Calzetti dust law, and only seven broad-band filters. This prior strongly restricts the allowed SFH shapes and can introduce spatially varying systematic biases, since the age–dust degeneracy behaves differently in high-S/N central pixels than in low-surface-brightness outskirts. Both the y-axis and the x-axis of Fig. 4 are derived from these fits, so the measured correlation could partly be an artifact of the assumed model. The paper itself states in Sec. 2.4 that the derived MS normalization is 'largely dependent on the assumed model of SFH'; the same caveat applies to the sSFR gradient. The authors should repeat the analysis with alternative SFH models (e.g., delayed-τ or non-parametric SFHs, different dust laws) or quantify how the partial correlation and the inferred growth patterns change under plausible model variations.
- [Secs. 3.1 and 4] The conclusion that the observed sSFR gradient implies 'outside-in' or 'inside-out' growth assumes that the current 100-Myr sSFR ratio directly predicts the future direction of half-mass-radius evolution. The supporting mass-weighted age ratio in Sec. 3.2 is derived from the same SED fits and is subject to the same systematics; it does not independently confirm the temporal interpretation. To make the central claim load-bearing, the authors should connect the observed gradients to actual size evolution—for example, by comparing with galaxies observed at two epochs, with simulation predictions, or by explicitly deriving the expected ΔR50 from the measured sSFR profile and showing that it matches the observed size trends in Fig. 5. At minimum, the assumption that a single snapshot maps onto a growth direction should be stated and discussed.
minor comments (6)
- [Sec. 2.4] Report the uncertainties on the fitted MS parameters (sb, β, μ), since these uncertainties propagate into ΔMS and hence into the partial correlation.
- [Sec. 3.1] Clarify whether the reported partial correlation coefficients are computed for the full sample of 997 galaxies or for the star-forming subsample, and state the sample size used in the PINGOUIN calculation.
- [Fig. 4 / Fig. 5] The color coding by size is hard to read in printed grayscale; consider using a colormap with larger contrast or adding contours.
- [Sec. 2.3] The phrase 'observed similar trends' should be quantified; please state how the correlation coefficient and slope change for the 1 kpc aperture case.
- [Sec. 4.2] The Limitations subsection does not mention the potential shared-noise/circularity issue or the SFH-model dependence beyond the MS normalization; these should be acknowledged as limitations of the present analysis.
- [Abstract and Sec. 1] '997 galaxies' appears in the abstract and in figure captions; please ensure the number is consistent and define the sample selection in one place.
Circularity Check
The central ΔMS–sSFR-gradient correlation is partly built from the same per-pixel SED-fit quantities, so the self-regulation interpretation is not yet separated from this definitional covariance.
-
self definitional
[Section 3.1 and Figure 4 caption; MS definition in Section 2.4]
"Figure 4 shows the ratio of sSFR in the galaxies' central regions (sSFR100,central; within R50s), and their outskirts (sSFR100,outskirts; within 1 − 3R50s) as a function of the distance from the MS (ΔMS; see Section 2 for details). The distance from the MS is defined as ΔMS ≡ log(sSFR100,galaxy/sSFRMS), where sSFR100,galaxy represents the sSFR of the whole galaxy measured over 100 Myr."
sSFR100,galaxy is the mass-weighted combination of the same per-pixel SED-fit sSFR values that define sSFR100,central and sSFR100,outskirts, since the galaxy value is the aggregate of the central and outskirt pixel sets. Thus the x-axis (ΔMS) and the y-axis (log sSFR100,central/sSFR100,outskirts) share the same fitted pixel-level quantities and their noise. For fixed stellar mass, redshift, and outskirts sSFR, raising the central sSFR increases both the y-axis ratio and the galaxy-averaged sSFR that enters ΔMS, so a positive correlation is partly guaranteed by the construction of a weighted mean versus a component contrast, not solely by the physical outside-in growth interpreted in the paper. The stated robustness checks in Section 2.3 ('we tested various physical regions ...
full rationale
The paper's main observational claim is a correlation between two quantities that are both derived from the same pixel-by-pixel SED fits: ΔMS is built from the galaxy-integrated sSFR, which is the mass-weighted average of the very central and outskirt pixel sSFRs whose ratio forms the other axis. This creates a built-in positive covariance between the two axes, so the headline correlation is partly an artifact of the construction rather than a freestanding measurement of outside-in versus inside-out growth. The paper does not include a control that randomizes the physical relation while preserving the shared pixel-error structure, and its robustness checks merely vary the aperture definitions on the same maps. The self-citations to Jain et al. (2024), Mosleh et al. (2020), and Tacchella et al. (2016b) are not themselves treated as load-bearing uniqueness theorems; the methodology is described as an adopted model, and the interpretive framework is presented as consistency with prior simulations rather than as a forced derivation. For these reasons the circularity is real but partial: the correlation is not equivalent to its inputs by strict identity, but its sign and significance are substantially influenced by the definitional overlap between a weighted mean and a component ratio computed from identical per-pixel SED-fit outputs.
Assumptions & free parameters
free parameters (6)
- MS normalization sb =
0.22
- MS mass slope beta =
-0.39
- MS redshift index mu =
0.85
- sSFR quiescent threshold =
-10.1 (log yr^-1)
- Central/outskirt aperture =
1-3 R50s
- Tau model prior range =
0.01-1.0 Gyr
assumptions (6)
- domain assumption Each pixel follows an exponentially declining star formation history (SFR proportional to exp(-t/tau)).
- domain assumption The Calzetti et al. (2000) dust attenuation law and a fixed metallicity range Z = 0.004 to 0.03 apply to all pixels.
- standard math The main sequence can be described by the parametric form sSFR_MS = sb (M*/1e10 M_sun)^beta (1+z)^mu (Equation 1).
- domain assumption All pixels of a galaxy share the same redshift, taken from the 3D-HST catalog.
- domain assumption The ratio of current sSFR in the center to the outskirts indicates the direction of future size evolution.
- domain assumption The sample from Mosleh et al. (2020) is complete and representative for the stated mass and redshift ranges.
Cite this review
Pith. "Pith review of Self-regulated growth of galaxy sizes along the star-forming main sequence." pith.science (2026). https://pith.science/paper/75M5WEOS
@misc{pith2026241200599,
  author       = {Pith},
  title        = {Pith review of: Self-regulated growth of galaxy sizes along the star-forming main sequence},
  year         = {2026},
  howpublished = {\url{https://pith.science/paper/75M5WEOS}},
  note         = {Machine review of arXiv:2412.00599}
}
abstract
We present a systematic analysis of the spatially resolved star formation histories (SFHs) using Hubble Space Telescope imaging data of $\sim 997$, intermediate redshifts $0.5 \leq z \leq 2.0$ galaxies from the GOODS-S field, with stellar mass range $9.8 \leq \log \mathrm{M}_{\star}/\mathrm{M}_{\odot} \leq 11.5$. We estimate the SFHs in three spatial regions (central region within the half-mass radii $\mathrm{R}_{50s}$, outskirts between $1-3~\mathrm{R}_{50s}$, and the whole galaxy) using pixel-by-pixel spectral-energy distribution (SED) fitting, assuming exponentially declining tau model in individual pixels. The reconstructed SFHs are then used to derive and compare the physical properties such as specific star-formation rates (sSFRs), mass-weighted ages (t$_{\mathrm{50}}$), and the half-mass radii to get insights on the interplay between the structure and star-formation in galaxies. The correlation of sSFR ratio of the center and outskirts with the distance from the main sequence (MS) indicates that galaxies on the upper envelope of the MS tend to grow outside-in, building up their central regions, while those below the MS grow inside-out, with more active star formation in the outskirts. The findings suggest a self-regulating process in galaxy size growth when they evolve along the MS. Our observations are consistent with galaxies growing their inner bulge and outer disc regions, where they appear to oscillate about the average MS in cycles of central gas compaction, which leads to bulge growth, and subsequent central depletion possibly due to feedback from the starburst, resulting in more star formation towards the outskirts from newly accreted gas.
Figures


Figures from the paper (5 more)



Reference graph
Works this paper leans on
-
[1]
Abraham R. G., et al., 1999, @doi [Monthly Notices of the Royal Astronomical Society] 10.1046/j.1365-8711.1999.02059.x , 303, 641
arXiv 1999
-
[2]
Abramson L. E., et al., 2015, @doi [ ] 10.1088/2041-8205/801/1/L12 , https://ui.adsabs.harvard.edu/abs/2015ApJ...801L..12A 801, L12
-
[3]
Baker W. M., et al., 2023, @doi [arXiv e-prints] 10.48550/arXiv.2306.02472 , https://ui.adsabs.harvard.edu/abs/2023arXiv230602472B p. arXiv:2306.02472
-
[4]
Barro G., et al., 2017, @doi [ ] 10.3847/1538-4357/aa6b05 , https://ui.adsabs.harvard.edu/abs/2017ApJ...840...47B 840, 47
-
[5]
Belfiore F., et al., 2018, @doi [ ] 10.1093/mnras/sty768 , https://ui.adsabs.harvard.edu/abs/2018MNRAS.477.3014B 477, 3014
-
[6]
Belli S., et al., 2015, @doi [ ] 10.1088/0004-637X/799/2/206 , https://ui.adsabs.harvard.edu/abs/2015ApJ...799..206B 799, 206
-
[7]
Belli S., et al., 2019, @doi [ ] 10.3847/1538-4357/ab07af , https://ui.adsabs.harvard.edu/abs/2019ApJ...874...17B 874, 17
-
[8]
Bluck A. F. L., et al., 2014, @doi [Monthly Notices of the Royal Astronomical Society] 10.1093/mnras/stu594 , 441, 599
Show all 112 references
-
[9]
Bottrell C., et al., 2019, @doi [ ] 10.1093/mnras/stz855 , https://ui.adsabs.harvard.edu/abs/2019MNRAS.486..390B 486, 390
2019 doi
-
[10]
Bouch \'e N., et al., 2010, @doi [ ] 10.1088/0004-637X/718/2/1001 , https://ui.adsabs.harvard.edu/abs/2010ApJ...718.1001B 718, 1001
2010 doi
-
[11]
418, Galactic Bulges
Bournaud F., 2016, in Laurikainen E., et al., eds, Astrophysics and Space Science Library Vol. 418, Galactic Bulges. p. 355 ( @eprint arXiv 1503.07660 ), @doi 10.1007/978-3-319-19378-6_13
2016 arXiv
-
[12]
G., et al., 2006, @doi [ ] 10.1111/j.1365-2966.2006.10519.x , https://ui.adsabs.harvard.edu/abs/2006MNRAS.370..645B 370, 645
Bower R. G., et al., 2006, @doi [ ] 10.1111/j.1365-2966.2006.10519.x , https://ui.adsabs.harvard.edu/abs/2006MNRAS.370..645B 370, 645
2006
-
[14]
B., et al., 2008b, @doi [The Astrophysical Journal] 10.1086/591786 , 686, 1503
Brammer G. B., et al., 2008b, @doi [The Astrophysical Journal] 10.1086/591786 , 686, 1503
-
[15]
B., et al., 2012, @doi [ ] 10.1088/0067-0049/200/2/13 , https://ui.adsabs.harvard.edu/abs/2012ApJS..200...13B 200, 13
Brammer G. B., et al., 2012, @doi [ ] 10.1088/0067-0049/200/2/13 , https://ui.adsabs.harvard.edu/abs/2012ApJS..200...13B 200, 13
2012 doi
-
[16]
Brinchmann J., et al., 2004, @doi [ ] 10.1111/j.1365-2966.2004.07881.x , https://ui.adsabs.harvard.edu/abs/2004MNRAS.351.1151B 351, 1151
2004
-
[17]
Calzetti D., et al., 2000, @doi [ ] 10.1086/308692 , https://ui.adsabs.harvard.edu/abs/2000ApJ...533..682C 533, 682
2000 doi
-
[18]
Caplar N., Tacchella S., 2019, @doi [ ] 10.1093/mnras/stz1449 , https://ui.adsabs.harvard.edu/abs/2019MNRAS.487.3845C 487, 3845
2019 doi
-
[19]
C., et al., 2019, @doi [The Astrophysical Journal] 10.3847/1538-4357/ab04a2 , 873, 44
Carnall A. C., et al., 2019, @doi [The Astrophysical Journal] 10.3847/1538-4357/ab04a2 , 873, 44
2019 doi
-
[20]
M., et al., 2013, @doi [ ] 10.1088/0004-637X/773/2/112 , https://ui.adsabs.harvard.edu/abs/2013ApJ...773..112C 773, 112
Carollo C. M., et al., 2013, @doi [ ] 10.1088/0004-637X/773/2/112 , https://ui.adsabs.harvard.edu/abs/2013ApJ...773..112C 773, 112
2013 doi
-
[21]
Cassata P., et al., 2013, @doi [ ] 10.1088/0004-637X/775/2/106 , https://ui.adsabs.harvard.edu/abs/2013ApJ...775..106C 775, 106
2013 doi
-
[22]
Cenci E., et al., 2024, @doi [ ] 10.1093/mnras/stad3709 , https://ui.adsabs.harvard.edu/abs/2024MNRAS.527.7871C 527, 7871
2024 doi
-
[23]
Chabrier G., 2003, @doi [ ] 10.1086/376392 , https://ui.adsabs.harvard.edu/abs/2003PASP..115..763C 115, 763
2003 doi
-
[24]
Cheung E., et al., 2012, @doi [ ] 10.1088/0004-637X/760/2/131 , https://ui.adsabs.harvard.edu/abs/2012ApJ...760..131C 760, 131
2012 doi
-
[25]
Conti A., et al., 2003, @doi [The Astronomical Journal] 10.1086/378598 , 126, 2330
2003 doi
-
[26]
J., et al., 2008, @doi [ ] 10.1111/j.1365-2966.2007.12730.x , https://ui.adsabs.harvard.edu/abs/2008MNRAS.384..386C 384, 386
Cox T. J., et al., 2008, @doi [ ] 10.1111/j.1365-2966.2007.12730.x , https://ui.adsabs.harvard.edu/abs/2008MNRAS.384..386C 384, 386
2008
-
[27]
D'Silva J. C. J., et al., 2023, @doi [ ] 10.1093/mnras/stac2878 , https://ui.adsabs.harvard.edu/abs/2023MNRAS.518..456D 518, 456
2023 doi
-
[28]
Daddi E., et al., 2005, @doi [ ] 10.1086/430104 , https://ui.adsabs.harvard.edu/abs/2005ApJ...626..680D 626, 680
2005 doi
-
[29]
Daddi E., et al., 2007, @doi [ ] 10.1086/521818 , https://ui.adsabs.harvard.edu/abs/2007ApJ...670..156D 670, 156
2007 doi
-
[30]
Daddi E., et al., 2010, @doi [ ] 10.1088/2041-8205/714/1/L118 , https://ui.adsabs.harvard.edu/abs/2010ApJ...714L.118D 714, L118
2010 doi
-
[32]
Dav \'e R., et al., 2012, @doi [ ] 10.1111/j.1365-2966.2011.20148.x , https://ui.adsabs.harvard.edu/abs/2012MNRAS.421...98D 421, 98
2012
-
[33]
Dekel A., Burkert A., 2013, @doi [Monthly Notices of the Royal Astronomical Society] 10.1093/mnras/stt2331 , 438, 1870
2013 doi
-
[34]
Dekel A., Mandelker N., 2014, @doi [ ] 10.1093/mnras/stu1427 , https://ui.adsabs.harvard.edu/abs/2014MNRAS.444.2071D 444, 2071
2014 doi
-
[35]
Dekel A., et al., 2013, @doi [ ] 10.1093/mnras/stt1338 , https://ui.adsabs.harvard.edu/abs/2013MNRAS.435..999D 435, 999
2013 doi
-
[36]
Dimauro P., et al., 2022, @doi [ ] 10.1093/mnras/stac884 , https://ui.adsabs.harvard.edu/abs/2022MNRAS.513..256D 513, 256
2022 doi
-
[37]
Dome T., et al., 2024, @doi [ ] 10.1093/mnras/stad3239 , https://ui.adsabs.harvard.edu/abs/2024MNRAS.527.2139D 527, 2139
2024 doi
-
[38]
Donnari M., et al., 2019, @doi [ ] 10.1093/mnras/stz712 , https://ui.adsabs.harvard.edu/abs/2019MNRAS.485.4817D 485, 4817
2019 doi
-
[39]
A., van den Bosch F
Dutton A. A., van den Bosch F. C., 2009, @doi [ ] 10.1111/j.1365-2966.2009.14742.x , https://ui.adsabs.harvard.edu/abs/2009MNRAS.396..141D 396, 141
2009
-
[40]
Elbaz D., et al., 2007, @doi [ ] 10.1051/0004-6361:20077525 , https://ui.adsabs.harvard.edu/abs/2007A&A...468...33E 468, 33
2007 doi
-
[41]
M., et al., 2009, @doi [ ] 10.1088/0004-637X/706/2/1364 , https://ui.adsabs.harvard.edu/abs/2009ApJ...706.1364F 706, 1364
F \"o rster Schreiber N. M., et al., 2009, @doi [ ] 10.1088/0004-637X/706/2/1364 , https://ui.adsabs.harvard.edu/abs/2009ApJ...706.1364F 706, 1364
2009 doi
-
[42]
C., 1970, @doi [ ] 10.1086/150474 , https://ui.adsabs.harvard.edu/abs/1970ApJ...160..811F 160, 811
Freeman K. C., 1970, @doi [ ] 10.1086/150474 , https://ui.adsabs.harvard.edu/abs/1970ApJ...160..811F 160, 811
1970 doi
-
[43]
L., et al., 2004, @doi [ ] 10.1086/379875 , https://ui.adsabs.harvard.edu/abs/2004ApJ...600..580G 600, 580
Granato G. L., et al., 2004, @doi [ ] 10.1086/379875 , https://ui.adsabs.harvard.edu/abs/2004ApJ...600..580G 600, 580
2004 doi
-
[44]
A., et al., 2011, @doi [ ] 10.1088/0067-0049/197/2/35 , https://ui.adsabs.harvard.edu/abs/2011ApJS..197...35G 197, 35
Grogin N. A., et al., 2011, @doi [ ] 10.1088/0067-0049/197/2/35 , https://ui.adsabs.harvard.edu/abs/2011ApJS..197...35G 197, 35
2011 doi
-
[45]
E., Gott J
Gunn J. E., Gott J. Richard I., 1972, @doi [ ] 10.1086/151605 , https://ui.adsabs.harvard.edu/abs/1972ApJ...176....1G 176, 1
1972 doi
-
[46]
Guo Y., et al., 2013, @doi [The Astrophysical Journal Supplement Series] 10.1088/0067-0049/207/2/24 , 207, 24
2013 doi
-
[47]
He H., et al., 2023, @doi [ ] 10.3847/1538-4357/acca76 , https://ui.adsabs.harvard.edu/abs/2023ApJ...950...56H 950, 56
2023 doi
-
[48]
A., et al., 2018, @doi [Monthly Notices of the Royal Astronomical Society] 10.1093/mnras/sty1780 , 479, 5385
Henden N. A., et al., 2018, @doi [Monthly Notices of the Royal Astronomical Society] 10.1093/mnras/sty1780 , 479, 5385
2018 doi
-
[49]
Jain S., et al., 2024, @doi [ ] 10.1093/mnras/stad3333 , https://ui.adsabs.harvard.edu/abs/2024MNRAS.527.3291J 527, 3291
2024 doi
-
[50]
Jegatheesan K., et al., 2024, @doi [ ] 10.1051/0004-6361/202347372 , https://ui.adsabs.harvard.edu/abs/2024A&A...684A..32J 684, A32
2024 doi
-
[51]
Ji Z., Giavalisco M., 2022, @doi [ ] 10.3847/1538-4357/ac7f43 , https://ui.adsabs.harvard.edu/abs/2022ApJ...935..120J 935, 120
2022 doi
-
[52]
Ji Z., Giavalisco M., 2023, @doi [ ] 10.3847/1538-4357/aca807 , https://ui.adsabs.harvard.edu/abs/2023ApJ...943...54J 943, 54
2023 doi
-
[53]
M., et al., 2011, @doi [ ] 10.1088/0067-0049/197/2/36 , https://ui.adsabs.harvard.edu/abs/2011ApJS..197...36K 197, 36
Koekemoer A. M., et al., 2011, @doi [ ] 10.1088/0067-0049/197/2/36 , https://ui.adsabs.harvard.edu/abs/2011ApJS..197...36K 197, 36
2011 doi
-
[54]
Kormendy J., 1977, @doi [ ] 10.1086/155589 , https://ui.adsabs.harvard.edu/abs/1977ApJ...217..406K 217, 406
1977 doi
-
[55]
Kretschmer M., Teyssier R., 2020, @doi [ ] 10.1093/mnras/stz3495 , https://ui.adsabs.harvard.edu/abs/2020MNRAS.492.1385K 492, 1385
2020 doi
-
[56]
Kriek M., et al., 2009, @doi [ ] 10.1088/0004-637X/700/1/221 , https://ui.adsabs.harvard.edu/abs/2009ApJ...700..221K 700, 221
2009 doi
-
[57]
N., Gunn J
Lackner C. N., Gunn J. E., 2012, @doi [ ] 10.1111/j.1365-2966.2012.20450.x , https://ui.adsabs.harvard.edu/abs/2012MNRAS.421.2277L 421, 2277
2012
-
[58]
Lang P., et al., 2014, @doi [ ] 10.1088/0004-637X/788/1/11 , https://ui.adsabs.harvard.edu/abs/2014ApJ...788...11L 788, 11
2014 doi
-
[59]
Lapiner S., et al., 2023, @doi [ ] 10.1093/mnras/stad1263 , https://ui.adsabs.harvard.edu/abs/2023MNRAS.522.4515L 522, 4515
2023 doi
-
[60]
Leja J., et al., 2022, @doi [ ] 10.3847/1538-4357/ac887d , https://ui.adsabs.harvard.edu/abs/2022ApJ...936..165L 936, 165
2022 doi
-
[61]
K., et al., 2020, @doi [ ] 10.3847/1538-4357/aba044 , https://ui.adsabs.harvard.edu/abs/2020ApJ...899...58L 899, 58
Leslie S. K., et al., 2020, @doi [ ] 10.3847/1538-4357/aba044 , https://ui.adsabs.harvard.edu/abs/2020ApJ...899...58L 899, 58
2020 doi
-
[62]
J., et al., 2013, @doi [The Astrophysical Journal] 10.1088/0004-637x/772/2/119 , 772, 119
Lilly S. J., et al., 2013, @doi [The Astrophysical Journal] 10.1088/0004-637x/772/2/119 , 772, 119
2013 doi
-
[63]
J., et al., 2024, @doi [ ] 10.1038/s41586-024-07227-0 , https://ui.adsabs.harvard.edu/abs/2024Natur.629...53L 629, 53
Looser T. J., et al., 2024, @doi [ ] 10.1038/s41586-024-07227-0 , https://ui.adsabs.harvard.edu/abs/2024Natur.629...53L 629, 53
2024 doi
-
[64]
A., et al., 2003, @doi [ ] 10.1086/344506 , https://ui.adsabs.harvard.edu/abs/2003ApJ...582..689M 582, 689
MacArthur L. A., et al., 2003, @doi [ ] 10.1086/344506 , https://ui.adsabs.harvard.edu/abs/2003ApJ...582..689M 582, 689
2003 doi
-
[65]
Magnelli B., et al., 2023, @doi [ ] 10.1051/0004-6361/202347052 , https://ui.adsabs.harvard.edu/abs/2023A&A...678A..83M 678, A83
2023 doi
-
[66]
Mancini C., et al., 2019, @doi [ ] 10.1093/mnras/stz2130 , https://ui.adsabs.harvard.edu/abs/2019MNRAS.489.1265M 489, 1265
2019 doi
-
[67]
Mart \' n-Navarro I., et al., 2022, @doi [ ] 10.1093/mnrasl/slab112 , https://ui.adsabs.harvard.edu/abs/2022MNRAS.513L..10M 513, L10
2022 doi
-
[68]
Mosleh M., et al., 2017, @doi [ ] 10.3847/1538-4357/aa5f14 , https://ui.adsabs.harvard.edu/abs/2017ApJ...837....2M 837, 2
2017 doi
-
[69]
Mosleh M., et al., 2020, @doi [The Astrophysical Journal] 10.3847/1538-4357/abc7cc , 905, 170
2020 doi
-
[70]
Moustakas J., et al., 2013, @doi [The Astrophysical Journal] 10.1088/0004-637x/767/1/50 , 767, 50
2013 doi
-
[71]
J., et al., 2016, @doi [ ] 10.3847/0004-637X/828/1/27 , https://ui.adsabs.harvard.edu/abs/2016ApJ...828...27N 828, 27
Nelson E. J., et al., 2016, @doi [ ] 10.3847/0004-637X/828/1/27 , https://ui.adsabs.harvard.edu/abs/2016ApJ...828...27N 828, 27
2016 doi
-
[72]
J., et al., 2021, @doi [ ] 10.1093/mnras/stab2131 , https://ui.adsabs.harvard.edu/abs/2021MNRAS.508..219N 508, 219
Nelson E. J., et al., 2021, @doi [ ] 10.1093/mnras/stab2131 , https://ui.adsabs.harvard.edu/abs/2021MNRAS.508..219N 508, 219
2021 doi
-
[73]
B., et al., 2012, @doi [ ] 10.1088/0004-637X/746/2/162 , https://ui.adsabs.harvard.edu/abs/2012ApJ...746..162N 746, 162
Newman A. B., et al., 2012, @doi [ ] 10.1088/0004-637X/746/2/162 , https://ui.adsabs.harvard.edu/abs/2012ApJ...746..162N 746, 162
2012 doi
-
[74]
Okamoto T., 2013, @doi [ ] 10.1093/mnras/sts067 , https://ui.adsabs.harvard.edu/abs/2013MNRAS.428..718O 428, 718
2013 doi
-
[75]
Osborne C., et al., 2020, @doi [ ] 10.3847/1538-4357/abb5af , https://ui.adsabs.harvard.edu/abs/2020ApJ...902...77O 902, 77
2020 doi
-
[76]
Park M., et al., 2022, @doi [ ] 10.1093/mnras/stac1773 , https://ui.adsabs.harvard.edu/abs/2022MNRAS.515..213P 515, 213
2022 doi
- [77]
-
[78]
G., et al., 2017, @doi [ ] 10.3847/1538-4357/aa6bf4 , https://ui.adsabs.harvard.edu/abs/2017ApJ...839..127P 839, 127
Patel S. G., et al., 2017, @doi [ ] 10.3847/1538-4357/aa6bf4 , https://ui.adsabs.harvard.edu/abs/2017ApJ...839..127P 839, 127
2017 doi
-
[79]
R., et al., 2013, @doi [ ] 10.1093/mnrasl/slt058 , https://ui.adsabs.harvard.edu/abs/2013MNRAS.433L..59P 433, L59
Patton D. R., et al., 2013, @doi [ ] 10.1093/mnrasl/slt058 , https://ui.adsabs.harvard.edu/abs/2013MNRAS.433L..59P 433, L59
2013 doi
-
[80]
Peng Y.-j., et al., 2010, @doi [ ] 10.1088/0004-637X/721/1/193 , https://ui.adsabs.harvard.edu/abs/2010ApJ...721..193P 721, 193
2010 doi
-
[81]
Popesso P., et al., 2023, @doi [ ] 10.1093/mnras/stac3214 , https://ui.adsabs.harvard.edu/abs/2023MNRAS.519.1526P 519, 1526
2023 doi
-
[82]
Renaud F., et al., 2014, @doi [ ] 10.1093/mnrasl/slu050 , https://ui.adsabs.harvard.edu/abs/2014MNRAS.442L..33R 442, L33
2014 doi
-
[83]
Ribeiro B., et al., 2016, @doi [ ] 10.1051/0004-6361/201628249 , https://ui.adsabs.harvard.edu/abs/2016A&A...593A..22R 593, A22
2016 doi
-
[84]
Salim S., et al., 2007, @doi [ ] 10.1086/519218 , https://ui.adsabs.harvard.edu/abs/2007ApJS..173..267S 173, 267
2007 doi
-
[85]
Salim S., et al., 2023, @doi [ ] 10.3847/1538-4357/ad04db , https://ui.adsabs.harvard.edu/abs/2023ApJ...958..183S 958, 183
2023 doi
-
[86]
L., 1968, Atlas de Galaxias Australes
Sersic J. L., 1968, Atlas de Galaxias Australes
1968
-
[87]
Shen S., et al., 2003, @doi [ ] 10.1046/j.1365-8711.2003.06740.x , https://ui.adsabs.harvard.edu/abs/2003MNRAS.343..978S 343, 978
2003
- [88]
-
[89]
E., et al., 2014, @doi [ ] 10.1088/0067-0049/214/2/24 , https://ui.adsabs.harvard.edu/abs/2014ApJS..214...24S 214, 24
Skelton R. E., et al., 2014, @doi [ ] 10.1088/0067-0049/214/2/24 , https://ui.adsabs.harvard.edu/abs/2014ApJS..214...24S 214, 24
2014 doi
-
[90]
S., et al., 2008, @doi [ ] 10.1111/j.1365-2966.2008.13805.x , https://ui.adsabs.harvard.edu/abs/2008MNRAS.391..481S 391, 481
Somerville R. S., et al., 2008, @doi [ ] 10.1111/j.1365-2966.2008.13805.x , https://ui.adsabs.harvard.edu/abs/2008MNRAS.391..481S 391, 481
2008
-
[91]
S., et al., 2014, @doi [ ] 10.1088/0067-0049/214/2/15 , https://ui.adsabs.harvard.edu/abs/2014ApJS..214...15S 214, 15
Speagle J. S., et al., 2014, @doi [ ] 10.1088/0067-0049/214/2/15 , https://ui.adsabs.harvard.edu/abs/2014ApJS..214...15S 214, 15
2014 doi
-
[92]
Strait V., et al., 2023, @doi [ ] 10.3847/2041-8213/acd457 , https://ui.adsabs.harvard.edu/abs/2023ApJ...949L..23S 949, L23
2023 doi
-
[93]
A., et al., 2019a, @doi [ ] 10.3847/1538-4357/ab1bda , https://ui.adsabs.harvard.edu/abs/2019ApJ...877..103S 877, 103
Suess K. A., et al., 2019a, @doi [ ] 10.3847/1538-4357/ab1bda , https://ui.adsabs.harvard.edu/abs/2019ApJ...877..103S 877, 103
-
[94]
A., et al., 2019b, @doi [ ] 10.3847/2041-8213/ab4db3 , https://ui.adsabs.harvard.edu/abs/2019ApJ...885L..22S 885, L22
Suess K. A., et al., 2019b, @doi [ ] 10.3847/2041-8213/ab4db3 , https://ui.adsabs.harvard.edu/abs/2019ApJ...885L..22S 885, L22
-
[95]
A., et al., 2020, @doi [ ] 10.3847/2041-8213/abacc9 , https://ui.adsabs.harvard.edu/abs/2020ApJ...899L..26S 899, L26
Suess K. A., et al., 2020, @doi [ ] 10.3847/2041-8213/abacc9 , https://ui.adsabs.harvard.edu/abs/2020ApJ...899L..26S 899, L26
2020 doi
-
[96]
A., et al., 2021, @doi [ ] 10.3847/1538-4357/abf1e4 , https://ui.adsabs.harvard.edu/abs/2021ApJ...915...87S 915, 87
Suess K. A., et al., 2021, @doi [ ] 10.3847/1538-4357/abf1e4 , https://ui.adsabs.harvard.edu/abs/2021ApJ...915...87S 915, 87
2021 doi
-
[97]
Tacchella S., et al., 2015, @doi [Science] 10.1126/science.1261094 , https://ui.adsabs.harvard.edu/abs/2015Sci...348..314T 348, 314
2015 doi
-
[98]
Tacchella S., et al., 2016a, @doi [ ] 10.1093/mnras/stw131 , https://ui.adsabs.harvard.edu/abs/2016MNRAS.457.2790T 457, 2790
-
[99]
Tacchella S., et al., 2016b, @doi [ ] 10.1093/mnras/stw303 , https://ui.adsabs.harvard.edu/abs/2016MNRAS.458..242T 458, 242
-
[100]
Tacchella S., et al., 2018, @doi [ ] 10.3847/1538-4357/aabf8b , https://ui.adsabs.harvard.edu/abs/2018ApJ...859...56T 859, 56
2018 doi
-
[101]
Tacchella S., et al., 2020, @doi [ ] 10.1093/mnras/staa1838 , https://ui.adsabs.harvard.edu/abs/2020MNRAS.497..698T 497, 698
2020 doi
-
[102]
Tacchella S., et al., 2022, @doi [ ] 10.3847/1538-4357/ac449b , https://ui.adsabs.harvard.edu/abs/2022ApJ...926..134T 926, 134
2022 doi
-
[103]
S., et al., 2024, @doi [ ] 10.1093/pasj/psad076 , https://ui.adsabs.harvard.edu/abs/2024PASJ...76....1T 76, 1
Tanaka T. S., et al., 2024, @doi [ ] 10.1093/pasj/psad076 , https://ui.adsabs.harvard.edu/abs/2024PASJ...76....1T 76, 1
2024 doi
-
[104]
Vallat R., 2018, @doi [Journal of Open Source Software] 10.21105/joss.01026 , 3, 1026
2018 doi
-
[105]
E., et al., 2012, @doi [ ] 10.1088/2041-8205/754/2/L29 , https://ui.adsabs.harvard.edu/abs/2012ApJ...754L..29W 754, L29
Whitaker K. E., et al., 2012, @doi [ ] 10.1088/2041-8205/754/2/L29 , https://ui.adsabs.harvard.edu/abs/2012ApJ...754L..29W 754, L29
2012 doi
-
[106]
E., et al., 2017, @doi [ ] 10.3847/1538-4357/aa6258 , https://ui.adsabs.harvard.edu/abs/2017ApJ...838...19W 838, 19
Whitaker K. E., et al., 2017, @doi [ ] 10.3847/1538-4357/aa6258 , https://ui.adsabs.harvard.edu/abs/2017ApJ...838...19W 838, 19
2017 doi
-
[107]
Wild V., et al., 2016, @doi [ ] 10.1093/mnras/stw1996 , https://ui.adsabs.harvard.edu/abs/2016MNRAS.463..832W 463, 832
2016 doi
-
[108]
Wisnioski E., et al., 2015, @doi [ ] 10.1088/0004-637X/799/2/209 , https://ui.adsabs.harvard.edu/abs/2015ApJ...799..209W 799, 209
2015 doi
-
[109]
Zolotov A., et al., 2015, @doi [ ] 10.1093/mnras/stv740 , https://ui.adsabs.harvard.edu/abs/2015MNRAS.450.2327Z 450, 2327
2015 doi
-
[110]
de Vaucouleurs G., 1948, Annales d'Astrophysique, https://ui.adsabs.harvard.edu/abs/1948AnAp...11..247D 11, 247
1948
-
[111]
G., et al., 2008, @doi [ ] 10.1086/587874 , https://ui.adsabs.harvard.edu/abs/2008ApJ...677L...5V 677, L5
van Dokkum P. G., et al., 2008, @doi [ ] 10.1086/587874 , https://ui.adsabs.harvard.edu/abs/2008ApJ...677L...5V 677, L5
2008 doi
-
[112]
van der Wel A., et al., 2014, @doi [ ] 10.1088/0004-637X/788/1/28 , https://ui.adsabs.harvard.edu/abs/2014ApJ...788...28V 788, 28
2014 doi
-
[113]
van der Wel A., et al., 2024, @doi [ ] 10.3847/1538-4357/ad02ee , https://ui.adsabs.harvard.edu/abs/2024ApJ...960...53V 960, 53
2024 doi
-
[114]
write newline
" write newline "" before.all 'output.state := FUNCTION fin.entry write newline FUNCTION new.block output.state before.all = 'skip after.block 'output.state := if FUNCTION new.sentence output.state after.block = 'skip output.state before.all = 'skip after.sentence 'output.stat...
Reviewed August 12, 2026 · model on record in the stance chip above.
Discussion (0). Continue with ORCID to comment.