REVIEW 4 major objections 5 minor 81 references
The Structure, Populations and Kinematics of the Milky Way central and inner Bulge with OGLE, APOGEE and Gaia data
T0 review · 4 major / 5 minor · reviewed 2026-08-12 · deepseek-v4-flash
Pith's one-line read The Milky Way bulge splits into a slowly rotating central core and a bar-following inner bulge.
desk verdict Plausible, useful confirmation of the central/inner bulge split, but the boxy-vs-X-shape fit is a statistical tie and the potential robustness claim is untested. read the letter →
The pith
A machine-rendered reading of the paper's core claim, the machinery that carries it, and where it could break.
The reading
What carries the argument
The load-bearing object is the apocentric distance $r_{\rm apo}$ obtained from backward 5 Gyr orbital integrations in the MWPotential2014 gravitational potential, augmented by a Dehnen bar with pattern speed 52.25 km/s/kpc, angle 25 degrees, and radius 3.4 kpc. Apocenter thresholds at 1.8 kpc and 3.5 kpc divide stars into central bulge, inner bulge, and interlopers; this one-dimensional division is what creates the two populations whose rotation, dispersion, chemistry, and density are then compared. The thresholds come from prior work the paper adapts, and the alternative residence-time classification in the discussion gives the same kinematic result.
What would settle it
Recompute the same orbits with a different bar pattern speed or angle (for example 40 km/s/kpc or 35 degrees), or with spiral arms added to the potential, and test whether stars near the apocenter thresholds swap populations; if the low-rotation central bulge signature vanishes under a plausible alternative potential, the division is an artifact of the assumed model.
Extended reading notes
Core claim
On the paper's own terms, the central discovery is that the bulge should be divided into a central bulge ($r_{\rm apo}<1.8$ kpc) and an inner bulge ($1.8 \le r_{\rm apo}<3.5$ kpc), with everything beyond classified as halo or disk contamination. Both the ancient RR Lyrae population and the APOGEE red giants show the same pattern: inner bulge stars rotate coherently with the Galactic bar and display the quadrupole velocity signature of barred orbits, while central bulge stars rotate slowly, have lower velocity dispersion, and show no bar alignment. Apocenter-based classification also reveals that metal-poor and metal-rich bulge stars have nearly identical kinematics, so metallicity is not the right divider of bulge populations. The paper concludes that the inner bulge's bar-like, disk-like orbits support secular evolution as the primary origin of the bulge, and that the observed density of both tracers is better matched by a boxy bulge model than by an X-shaped one.
Load-bearing premise
The two-population picture rests on apocentric distances computed in one fixed, idealized Milky Way potential with a rigid bar of assumed pattern speed, angle, and radius; if the true bar differs, stars near the 1.8 kpc and 3.5 kpc boundaries would be reassigned and the kinematic dichotomy could weaken or disappear.
Editorial extensions
If this is right
- Bulge surveys that mix central and inner stars will dilute bar rotation signals, so apocenter-based cleaning should be applied before measuring bulge kinematics.
- The inner bulge's majority share and bar-like, disk-like orbits support a pseudo-bulge formed by disk instability rather than a merger-built classical bulge.
- Metallicity alone cannot define bulge populations; orbital parameters separate them more accurately.
- Both ancient RR Lyrae stars and younger giants favor a boxy/peanut bulge over an X-shaped bulge in the adopted density fits.
Reading between the lines
- Our inference: if the central bulge's low rotation and low dispersion are real, it may be an older spheroidal component that predates or coexists with the bar, not merely the bar's center; direct age dating of stars in each apocenter class could test this.
- Our inference: the boxy-versus-X-shape comparison fixes all model parameters except amplitude, so the preference could shift if bar angle or axis ratios were also fitted; the boxy conclusion should be read as provisional.
- Our inference: because interlopers dominate the high-dispersion tail, bulge samples lacking full 3D velocities will systematically overestimate velocity dispersion; applying the same cleaning to future catalogs should sharpen the kinematic split.
Signed reviews
Editorial analysis
A structured set of objections, weighed in public.
Referee Report
Summary. The paper analyzes the structure, populations, and kinematics of the Milky Way bulge using 1,879 OGLE-IV RRab stars with Gaia EDR3 proper motions and Kunder et al. (2020) line-of-sight velocities, plus 28,188 APOGEE DR17 red giants and red clump stars with Gaia DR3 proper motions and StarHorse distances. Orbits are integrated in a fixed Milky Way potential (MWPotential2014 plus a Dehnen bar with pattern speed 52.25 km/s/kpc, angle 25 degrees, radius 3.4 kpc), and stars are classified by apocentric distance as central bulge (r_apo < 1.8 kpc), inner bulge (1.8 <= r_apo < 3.5 kpc), or halo/disk interlopers (r_apo >= 3.5 kpc). The central claim is that inner-bulge stars rotate and trace the bar, while central-bulge stars show lower rotation and lower velocity dispersion and do not trace the bar. The paper also argues that metallicity is not a good separator of bulge populations, that orbital classification is preferable, that chemical abundance maps show bimodal distributions in all three populations, and that the observed density is better fit by a boxy bulge model than by an X-shaped model. The conclusions support a secular-evolution, pseudo-bulge origin for the Milky Way bulge.
Significance. If the kinematic dichotomy between the central and inner bulge holds, the paper would strengthen the case that the Milky Way bulge is primarily a pseudo-bulge formed by disk/bar secular evolution, with a distinct old, pressure-supported central component. The use of two independent tracers (RR Lyrae and APOGEE giants) is a genuine strength, and the paper includes useful checks of distance/PLZ systematics (Fig. 2) and an alternative time-fraction classification (Section 5). However, the quantitative support currently lags behind the claims: there are no significance tests for the kinematic differences, no robustness analysis of the apocenter classification to the assumed potential, and no statistical basis for the claimed boxy-versus-X-shape preference. The paper is a reasonable confirmation and extension of Kunder (2022) and Olivares Carvajal et al. (2024), but the novel, load-bearing claims need stronger statistical backing before they can be regarded as established.
major comments (4)
- [§4.1/§4.2, Figs. 7 and 11] The central claim that the central bulge has slower rotation and lower velocity dispersion than the inner bulge is not backed by any significance test. The paper reports binned means and bootstrap error bars, but it never quantifies whether the differences between the blue and orange curves are statistically significant, accounting for the correlated bins and the sample sizes (451 vs 859 RRabs, and 5709 vs 11102 APOGEE stars). Please provide a quantitative test, for example a permutation or bootstrap p-value for the difference in mean v_los or v_l* between the central and inner samples, and an F-test or similar for the dispersion ratio.
- [§3 and §5] The robustness of the apocenter-based classification to the assumed potential is load-bearing and is not tested. The statement in Section 3 that 'different potentials will not significantly change our main physical results' is asserted without a test, and Section 5 itself attributes the 75% versus 70% bulge-fraction difference between this work and Kunder et al. (2020) to 'differences in the gravitational potential models used for orbital integration.' Because stars near the 1.8 and 3.5 kpc thresholds can be reclassified under moderate changes in bar pattern speed, angle, or strength, the kinematic dichotomy in Figures 7 and 11 could change. Please rerun the classification under at least a few plausible potential variants (or a Monte Carlo over bar parameters) and show that the population labels and the central/inner kinematic differences are stable.
- [§4.3, Eqs. (13)–(14) and Abstract/Conclusions] The claimed 'preference for the boxy bulge' is not supported by the reported statistics. The reduced chi-square values are 0.99 versus 1.00 for RRabs and 0.99 versus 1.00 for APOGEE stars, with p-values 53% versus 47% and 55% versus 45%, respectively. These are statistically equivalent fits; a 6–8 percentage point difference in p-values does not demonstrate a preference. The authors should either perform a proper model comparison (e.g., delta chi-square with the same bins, AIC/BIC, or bootstrap selection probabilities) or weaken the conclusion to state that both models are consistent with the data and no significant preference is found.
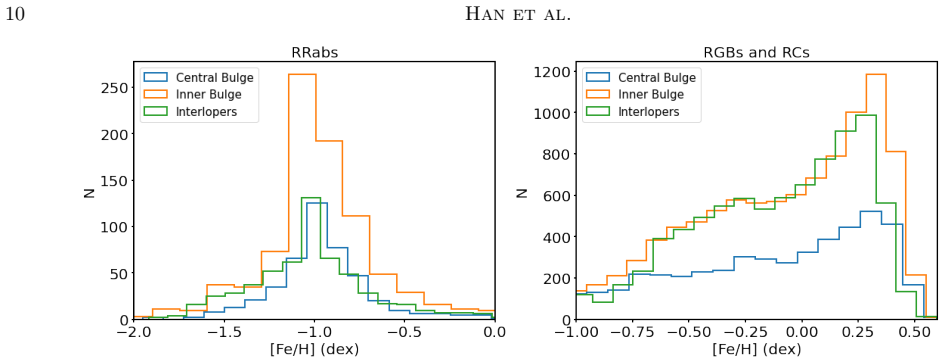
- [§4.1–§4.2 and Conclusions] The statement that classification based on orbital parameters rather than metallicity provides a 'more accurate population separation' is not quantified. The paper shows that the metallicity distributions of the three orbital populations overlap (Fig. 9) and that metallicity-selected bulge samples show similar kinematics (Fig. 8), but it never defines or measures classification accuracy. Please provide a quantitative comparison (e.g., contamination rates, separation metrics, or a formal comparison of kinematic homogeneity after each classification) or soften the claim to one of being 'more directly linked to dynamics' rather than 'more accurate.'
minor comments (5)
- [§4.3, Eq. (14)] With one fitted amplitude, the number of degrees of freedom should be N - 2 rather than N - 1; although the effect is small for large N, the formula should be corrected.
- [Fig. 10 caption] The caption says 'central bulge (left), inner bulge (right), and halo/disk interlopers (right)'; the three panels should be labeled '(left), (middle), (right).'
- [Conclusions, first paragraph] There is a typo: 'inner bugle' should be 'inner bulge.'
- [§2.1] Please clarify the Monte Carlo distance error of 0.006 kpc: does it include photometric and reddening uncertainties or only magnitude errors? The later statement that the total distance error does not exceed 6% seems inconsistent with a purely statistical error of 0.006 kpc at roughly 8 kpc.
- [§5, first limitation paragraph] The sentence beginning 'One such limitation is that RRab stars predominantly trace old and metal-poor stellar populations...' is a sentence fragment that should be joined properly to the following sentence.
Circularity Check
No circular derivation: the central/inner bulge split is set by external apocenter thresholds and then tested against observed kinematics; the main caveat is an untested potential-dependence claim, which is a robustness limitation rather than a circular reduction.
full rationale
The paper's central dichotomy is not fitted into existence. Section 4.1 classifies stars by apocentric distance using thresholds taken from prior work (r_apo < 1.8 kpc, 1.8-3.5 kpc, >= 3.5 kpc, attributed to Kunder 2022), and the kinematic differences (rotation curves and dispersions in Figures 7 and 11) are measured on the resulting subsamples, not used to define the cuts. The same qualitative pattern survives an alternative time-fraction classification in Section 5, so the headline result does not reduce by construction to the chosen threshold. The boxy/X-shape comparison in Section 4.3 fixes all model parameters except one amplitude and fits observed densities to published forms (Lopez-Corredoira 2005; Wegg & Gerhard 2013); the self-citation involved (Lopez-Corredoira is a coauthor) is not load-bearing because the model is an external, parameterized hypothesis and the fit does not define the population split. The one genuine concern is model dependence of the orbital apocenters: Section 3 asserts 'different potentials will not significantly change our main physical results' without a test, and Section 5 later concedes that 'the inclusion of spiral arms could significantly alter the orbital properties of stars' and that a fixed pattern speed may be unrealistic. This is an acknowledged robustness/validity limitation, not a case where the predicted quantity equals the input by construction, so it does not constitute circularity under the stated criteria.
Assumptions & free parameters
free parameters (9)
- Apocenter threshold for halo/disk interlopers =
3.5 kpc
- Apocenter threshold separating central from inner bulge =
1.8 kpc
- Bar pattern speed =
52.25 km/s/kpc
- Bar angle =
25 degrees
- Bar strength =
1.1 x 10^6 (km/s)^2
- Bar radius =
3.4 kpc
- Boxy bulge model amplitude =
fitted via chi-square minimization
- X-shape model amplitude =
fitted via chi-square minimization
- Density error normalization rho_1 =
20 stars/kpc^3
assumptions (4)
- domain assumption MWPotential2014 plus Dehnen bar is an adequate model of the Milky Way potential for computing stellar orbits.
- domain assumption Apocentric distance is a valid discriminant of bulge membership and central/inner structure.
- domain assumption The Catelan (2004) period-luminosity-metallicity relation and Smolec (2005) photometric metallicity provide accurate distances and metallicities for bulge RR Lyrae.
- standard math The adopted Sun-Galactic center distance (8.277 kpc), circular velocity (220 km/s) and solar peculiar motion are correct.
Cite this review
Pith. "Pith review of The Structure, Populations and Kinematics of the Milky Way central and inner Bulge with OGLE, APOGEE and Gaia data." pith.science (2026). https://pith.science/paper/ED7ULNBK
@misc{pith2026241200752,
  author       = {Pith},
  title        = {Pith review of: The Structure, Populations and Kinematics of the Milky Way central and inner Bulge with OGLE, APOGEE and Gaia data},
  year         = {2026},
  howpublished = {\url{https://pith.science/paper/ED7ULNBK}},
  note         = {Machine review of arXiv:2412.00752}
}
abstract
We present an analysis of the structure, kinematics, and chemo-dynamical properties of the Milky Way bulge using RR Lyrae stars from OGLE, and giant stars from APOGEE and Gaia that have distances placing them in the inner Galaxy. Firstly, using a sample of 1,879 ab-type RR Lyrae stars (RRabs) from OGLE-IV, we identified three populations: central bulge RRabs, the inner bulge RRabs, and halo or disk interlopers, based on their apocenters derived from orbital integration. Inner bulge RRabs kinematically align with the Galactic bar, while central bulge RRabs show slower rotation with lower velocity dispersion. Higher velocity dispersion stars were identified as halo/disk interlopers. Then, orbital analysis of 28,188 APOGEE Red Clump and Red Giant Branch stars revealed kinematic properties consistent with RRabs, and the chemical abundance distribution displayed a bimodal stellar density pattern, suggesting complex star evolution histories and slightly different star formation histories for the inner bulge and central bulge. The differences in the density distribution on the $|\mathrm{Z}|_{\text{max}}$-eccentricity plane for the central bulge, inner bulge, and interlopers are clearly detected. It is found that the classification of bulge stars based on orbital parameters, rather than solely on metallicity, provides a more accurate population separation. As the inner bulge, which contains the highest fraction of stars, traces the bar formed by the instability of the Galactic disk, our results support that pseudo-bulge is the primary origin of the bulge. Furthermore, fitting the observed data to both the boxy and X-shaped bulge models indicated a preference for the boxy bulge.
Figures


Figures from the paper (16 more)




Reference graph
Works this paper leans on
-
[1]
/;& W[ /Mv*r' =M l n ި - I/2ǸT z ;v_n fي=XOt23V
thebibliography [1] 20pt to REFERENCES 6pt =0pt 10pt plus 3pt =0pt =0pt =1pt plus 1pt =0pt =0pt -12pt =13pt plus 1pt =20pt =13pt plus 1pt \@M =10000 =-1.0em =0pt =0pt 0pt =0pt =1.0em @enumiv\@empty 10000 10000 `\.\@m \@noitemerr \@latex@warning Empty `thebibliography' environment \@ifnextchar \@reference \@latexerr Missing key on reference command Each re...
2017
-
[2]
Abdurro'uf, Accetta, K., Aerts, C., et al.\ 2022, , 259, 35. doi:10.3847/1538-4365/ac4414
-
[3]
Adibekyan, V. Z., Sousa, S. G., Santos, N. C., et al.\ 2012, , 545, A32. doi:10.1051/0004-6361/201219401
-
[4]
doi:10.1051/0004-6361/201935765
Anders, F., Khalatyan, A., Chiappini, C., et al.\ 2019, , 628, A94. doi:10.1051/0004-6361/201935765
-
[5]
Ardern-Arentsen, A., Monari, G., Queiroz, A. B. A., et al.\ 2024, , 530, 3391. doi:10.1093/mnras/stae1049
-
[6]
Arentsen, A., Starkenburg, E., Martin, N. F., et al.\ 2020, , 491, L11. doi:10.1093/mnrasl/slz156
-
[7]
& Kawata, D.\ 2020, , 492, 4500
Baba, J. & Kawata, D.\ 2020, , 492, 4500. doi:10.1093/mnras/staa140
-
[8]
Babusiaux, C.\ 2016, , 33, e026. doi:10.1017/pasa.2016.1
Show all 81 references
-
[9]
doi:10.1146/annurev-astro-081817-051826
Barbuy, B., Chiappini, C., & Gerhard, O.\ 2018, , 56, 223. doi:10.1146/annurev-astro-081817-051826
2018 doi
-
[10]
& Kravtsov, A.\ 2024, , 528, 3198
Belokurov, V. & Kravtsov, A.\ 2024, , 528, 3198. doi:10.1093/mnras/stad3920
2024 doi
-
[11]
& Bovy, J.\ 2019, , 482, 1417
Bennett, M. & Bovy, J.\ 2019, , 482, 1417. doi:10.1093/mnras/sty2813
2019 doi
-
[12]
C., et al.\ 2012, , 759, 131
Bovy, J., Allende Prieto, C., Beers, T. C., et al.\ 2012, , 759, 131. doi:10.1088/0004-637X/759/2/131
2012 doi
- [13]
-
[14]
K., et al.\ 2022, , 510, 2407
Buder, S., Lind, K., Ness, M. K., et al.\ 2022, , 510, 2407. doi:10.1093/mnras/stab3504
2022 doi
-
[15]
M., Whitelock, P
Catchpole, R. M., Whitelock, P. A., Feast, M. W., et al.\ 2016, , 455, 2216. doi:10.1093/mnras/stv2372
2016 doi
- [16]
-
[17]
doi:10.1051/0004-6361/202244810
Chrob \'a kov \'a , Z ., L \'o pez-Corredoira, M., & Garz \'o n, F.\ 2022, , 666, L13. doi:10.1051/0004-6361/202244810
2022 doi
-
[18]
I., Calamida, A., Sahu, K
Clarkson, W. I., Calamida, A., Sahu, K. C., et al.\ 2018, , 858, 46. doi:10.3847/1538-4357/aaba7f
2018 doi
- [19]
-
[20]
doi:10.1088/2041-8205/776/2/L19
D \'e k \'a ny, I., Minniti, D., Catelan, M., et al.\ 2013, , 776, L19. doi:10.1088/2041-8205/776/2/L19
2013 doi
-
[21]
doi:10.1093/mnras/staa2601
Du, H., Mao, S., Athanassoula, E., et al.\ 2020, , 498, 5629. doi:10.1093/mnras/staa2601
2020 doi
-
[22]
Edvardsson, B., Andersen, J., Gustafsson, B., et al.\ 1993, , 275, 101
1993
-
[23]
Fuhrmann, K.\ 1998, , 338, 161
1998
-
[24]
doi:10.1093/mnras/sts305
Freeman, K., Ness, M., Wylie-de-Boer, E., et al.\ 2013, , 428, 3660. doi:10.1093/mnras/sts305
2013 doi
-
[25]
doi:10.1088/0004-637X/692/2/1075
Gillessen, S., Eisenhauer, F., Trippe, S., et al.\ 2009, , 692, 1075. doi:10.1088/0004-637X/692/2/1075
2009 doi
-
[26]
A., Rejkuba, M., Zoccali, M., et al.\ 2012, , 543, A13
Gonzalez, O. A., Rejkuba, M., Zoccali, M., et al.\ 2012, , 543, A13. doi:10.1051/0004-6361/201219222
2012 doi
-
[27]
K., et al.\ 2016, , 591, A145
Gran, F., Minniti, D., Saito, R. K., et al.\ 2016, , 591, A145. doi:10.1051/0004-6361/201527511
2016 doi
-
[28]
doi:10.1051/0004-6361/202142465
GRAVITY Collaboration, Abuter, R., Aimar, N., et al.\ 2022, , 657, L12. doi:10.1051/0004-6361/202142465
2022 doi
-
[29]
R., Bovy, J., Holtzman, J
Hayden, M. R., Bovy, J., Holtzman, J. A., et al.\ 2015, , 808, 132. doi:10.1088/0004-637X/808/2/132
2015 doi
-
[30]
R., Mao, S., et al.\ 2006, , 370, 435
Koz owski, S., Wo \'z niak, P. R., Mao, S., et al.\ 2006, , 370, 435. doi:10.1111/j.1365-2966.2006.10487.x
2006
-
[31]
M., et al.\ 2012, , 143, 57
Kunder, A., Koch, A., Rich, R. M., et al.\ 2012, , 143, 57. doi:10.1088/0004-6256/143/3/57
2012 doi
-
[32]
M., Koch, A., et al.\ 2016, , 821, L25
Kunder, A., Rich, R. M., Koch, A., et al.\ 2016, , 821, L25. doi:10.3847/2041-8205/821/2/L25
2016 doi
-
[33]
M., et al.\ 2020, , 159, 270
Kunder, A., P \'e rez-Villegas, A., Rich, R. M., et al.\ 2020, , 159, 270. doi:10.3847/1538-3881/ab8d35
2020 doi
-
[34]
M.\ 2022, Universe, 8, 206
Kunder, A. M.\ 2022, Universe, 8, 206. doi:10.3390/universe8040206
2022 doi
- [35]
-
[36]
& Shen, J.\ 2012, , 757, L7
Li, Z.-Y. & Shen, J.\ 2012, , 757, L7. doi:10.1088/2041-8205/757/1/L7
2012 doi
-
[37]
E.\ 2005, , 439, 107
L \'o pez-Corredoira, M., Cabrera-Lavers, A., & Gerhard, O. E.\ 2005, , 439, 107. doi:10.1051/0004-6361:20053075
2005 doi
-
[38]
doi:10.1051/0004-6361/201527074
L \'o pez-Corredoira, M.\ 2016, , 593, A66. doi:10.1051/0004-6361/201527074
2016 doi
-
[39]
doi:10.3847/1538-4357/836/2/218
L \'o pez-Corredoira, M.\ 2017, , 836, 218. doi:10.3847/1538-4357/836/2/218
2017 doi
-
[40]
doi:10.1093/mnras/stab003
Lucey, M., Hawkins, K., Ness, M., et al.\ 2021, , 501, 5981. doi:10.1093/mnras/stab003
2021 doi
-
[41]
R., Schiavon, R
Majewski, S. R., Schiavon, R. P., Frinchaboy, P. M., et al.\ 2017, , 154, 94. doi:10.3847/1538-3881/aa784d
2017 doi
-
[42]
doi:10.1088/0004-637X/808/1/50
Marconi, M., Coppola, G., Bono, G., et al.\ 2015, , 808, 50. doi:10.1088/0004-637X/808/1/50
2015 doi
-
[43]
doi:10.1086/498338
Martinez-Valpuesta, I., Shlosman, I., & Heller, C.\ 2006, , 637, 214. doi:10.1086/498338
2006 doi
-
[44]
& Gilmore, G.\ 2015, , 453, 1855
Masseron, T. & Gilmore, G.\ 2015, , 453, 1855. doi:10.1093/mnras/stv1731
2015 doi
-
[45]
ISBN 978-3-642-22490-4
Matteucci, F.\ 2012, Chemical Evolution of Galaxies: , Astronomy and Astrophysics Library. ISBN 978-3-642-22490-4. Springer-Verlag Berlin Heidelberg, 2012. doi:10.1007/978-3-642-22491-1
2012 doi
-
[46]
& Nagai, R.\ 1975, , 27, 533
Miyamoto, M. & Nagai, R.\ 1975, , 27, 533
1975
-
[47]
M., Gould, A., Fouqu \'e , P., et al.\ 2013, , 769, 88
Nataf, D. M., Gould, A., Fouqu \'e , P., et al.\ 2013, , 769, 88. doi:10.1088/0004-637X/769/2/88
2013 doi
-
[48]
F., Frenk, C
Navarro, J. F., Frenk, C. S., & White, S. D. M.\ 1997, , 490, 493. doi:10.1086/304888
1997 doi
-
[49]
doi:10.1093/mnras/sts629
Ness, M., Freeman, K., Athanassoula, E., et al.\ 2013, , 430, 836. doi:10.1093/mnras/sts629
2013 doi
-
[50]
& Lang, D.\ 2016, , 152, 14
Ness, M. & Lang, D.\ 2016, , 152, 14. doi:10.3847/0004-6256/152/1/14
2016 doi
-
[51]
L., Holtzman, J
Nidever, D. L., Holtzman, J. A., Allende Prieto, C., et al.\ 2015, , 150, 173. doi:10.1088/0004-6256/150/6/173
2015 doi
-
[52]
doi:10.1088/0004-637X/763/1/26
Obreja, A., Dom \' nguez-Tenreiro, R., Brook, C., et al.\ 2013, , 763, 26. doi:10.1088/0004-637X/763/1/26
2013 doi
- [53]
-
[54]
doi:10.1093/mnrasl/slw189
P \'e rez-Villegas, A., Portail, M., & Gerhard, O.\ 2017, , 464, L80. doi:10.1093/mnrasl/slw189
2017 doi
-
[55]
doi:10.1088/0004-637X/811/2/113
Pietrukowicz, P., Koz owski, S., Skowron, J., et al.\ 2015, , 811, 113. doi:10.1088/0004-637X/811/2/113
2015 doi
-
[56]
K., et al.\ 2019, , 487, 3270
Prudil, Z., D \'e k \'a ny, I., Grebel, E. K., et al.\ 2019, , 487, 3270. doi:10.1093/mnras/stz1484
2019 doi
-
[57]
doi:10.1051/0004-6361/202347338
Prudil, Z., Kunder, A., D \'e k \'a ny, I., et al.\ 2024, , 684, A176. doi:10.1051/0004-6361/202347338
2024 doi
-
[58]
M., Zakamska, N., et al.\ 2018, , 865, 47
Qin, W., Nataf, D. M., Zakamska, N., et al.\ 2018, , 865, 47. doi:10.3847/1538-4357/aad7fb
2018 doi
-
[59]
Queiroz, A. B. A., Anders, F., Santiago, B. X., et al.\ 2018, , 476, 2556. doi:10.1093/mnras/sty330
2018 doi
-
[60]
Queiroz, A. B. A., Anders, F., Chiappini, C., et al.\ 2020, , 638, A76. doi:10.1051/0004-6361/201937364
2020 doi
-
[61]
Queiroz, A. B. A., Chiappini, C., Perez-Villegas, A., et al.\ 2021, , 656, A156. doi:10.1051/0004-6361/202039030
2021 doi
-
[62]
Queiroz, A. B. A., Anders, F., Chiappini, C., et al.\ 2023, , 673, A155. doi:10.1051/0004-6361/202245399
2023 doi
-
[63]
C., Minchev, I., Sharma, S., et al.\ 2014, , 437, 1284
Quillen, A. C., Minchev, I., Sharma, S., et al.\ 2014, , 437, 1284. doi:10.1093/mnras/stt1972
2014 doi
-
[64]
doi:10.3847/1538-4357/ac9e01
Rix, H.-W., Chandra, V., Andrae, R., et al.\ 2022, , 941, 45. doi:10.3847/1538-4357/ac9e01
2022 doi
-
[65]
doi:10.1051/0004-6361/201424121
Rojas-Arriagada, A., Recio-Blanco, A., Hill, V., et al.\ 2014, , 569, A103. doi:10.1051/0004-6361/201424121
2014 doi
-
[66]
doi:10.1111/j.1365-2966.2011.20307.x
Saha, K., Martinez-Valpuesta, I., & Gerhard, O.\ 2012, , 421, 333. doi:10.1111/j.1365-2966.2011.20307.x
2012
-
[67]
K., Olszewski, E
Saha, A., Vivas, A. K., Olszewski, E. W., et al.\ 2019, , 874, 30. doi:10.3847/1538-4357/ab07ba
2019 doi
-
[68]
L., Kawata, D., Matsunaga, N., et al.\ 2024, , 530, 2972
Sanders, J. L., Kawata, D., Matsunaga, N., et al.\ 2024, , 530, 2972. doi:10.1093/mnras/stae711
2024 doi
-
[69]
X., Brauer, D
Santiago, B. X., Brauer, D. E., Anders, F., et al.\ 2016, , 585, A42. doi:10.1051/0004-6361/201323177
2016 doi
-
[70]
doi:10.1111/j.1365-2966.2010.16253.x
Sch \"o nrich, R., Binney, J., & Dehnen, W.\ 2010, , 403, 1829. doi:10.1111/j.1365-2966.2010.16253.x
2010
-
[71]
doi:10.1093/mnras/stab3294
Semczuk, M., Dehnen, W., Sch \"o nrich, R., et al.\ 2022, , 509, 4532. doi:10.1093/mnras/stab3294
2022 doi
-
[72]
doi:10.1093/mnras/stac3085
Semczuk, M., Dehnen, W., Sch \"o nrich, R., et al.\ 2022, , 517, 6060. doi:10.1093/mnras/stac3085
2022 doi
-
[73]
M., Kormendy, J., et al.\ 2010, , 720, L72
Shen, J., Rich, R. M., Kormendy, J., et al.\ 2010, , 720, L72. doi:10.1088/2041-8205/720/1/L72
2010 doi
- [74]
- [75]
-
[76]
A., et al.\ 2020, , 644, A140
Surot, F., Valenti, E., Gonzalez, O. A., et al.\ 2020, , 644, A140. doi:10.1051/0004-6361/202038346
2020 doi
-
[77]
E., et al.\ 2020, Nature Methods, 17, 261
Virtanen, P., Gommers, R., Oliphant, T. E., et al.\ 2020, Nature Methods, 17, 261. doi:10.1038/s41592-019-0686-2
2020 doi
-
[78]
& Gerhard, O.\ 2013, , 435, 1874
Wegg, C. & Gerhard, O.\ 2013, , 435, 1874. doi:10.1093/mnras/stt1376
2013 doi
-
[79]
doi:10.1051/0004-6361:200809394
Zoccali, M., Hill, V., Lecureur, A., et al.\ 2008, , 486, 177. doi:10.1051/0004-6361:200809394
2008 doi
-
[80]
A., et al.\ 2017, , 599, A12
Zoccali, M., Vasquez, S., Gonzalez, O. A., et al.\ 2017, , 599, A12. doi:10.1051/0004-6361/201629805
2017 doi
-
[81]
doi:10.1051/0004-6361/202450126
Zoccali, M., Quezada, C., Contreras Ramos, R., et al.\ 2024, , 689, A240. doi:10.1051/0004-6361/202450126
2024 doi
Reviewed August 12, 2026 · model on record in the stance chip above.
Discussion (0). Continue with ORCID to comment.