REVIEW 4 major objections 5 minor 18 references
Class Distance Weighted Cross Entropy Loss for Classification of Disease Severity
T0 review · 4 major / 5 minor · reviewed 2026-08-12 · deepseek-v4-flash
Pith's one-line read This paper claims that weighting cross-entropy errors by class distance makes deep models grade disease severity more accurately, with better embeddings and expert-aligned attention.
desk verdict A useful empirical comparison of a known ordinal loss, but the margin variant that the abstract touts is built on an undefined equation. read the letter →
The pith
A machine-rendered reading of the paper's core claim, the machinery that carries it, and where it could break.
The reading
What carries the argument
The machinery is the class-distance-weighted sum in Eq. (2): $-\sum_i \log(1-\hat{y}_i)|i-c|^\alpha$. Unlike cross-entropy, which only looks at the true class's log-probability, this sum penalizes probability mass placed on every off-target class, with the penalty growing as the predicted class moves farther from the true class. The $\alpha$ power controls how sharply distance is punished (the authors find 5, 6, and 7 best for the three architectures), and the derivative $|i-c|^\alpha/(1-\hat{y}_i)$ grows as a wrong prediction becomes more confident, which is what pushes the model toward a unimodal, peaked distribution around the true class. Eq. (4) augments this with an additive margin $m$ intended to tighten intra-class grouping and widen inter-class separation.
What would settle it
Train ResNet18 on LIMUC with Eq. (4) exactly as written: because $\log(1-\max(1,\hat{y}_i+m))$ is undefined for any $\hat{y}_i < 1-m$, the loss would become NaN on the first batch, so the QWK values in Table 5 can only be reproduced by a different, undocumented margin rule; inspecting the released code or rerunning with an explicit clamped variant would settle which objective produced the reported numbers.
Extended reading notes
Core claim
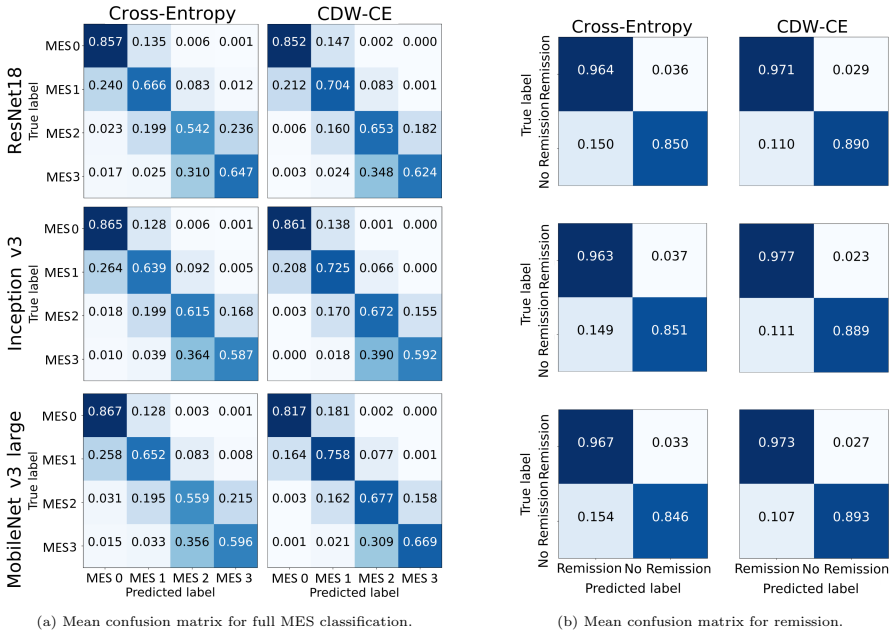
The central claim is that ordinal structure should be encoded in the loss itself, not in the architecture or label scheme: CDW-CE is a non-parametric, differentiable drop-in replacement for cross-entropy that penalizes each predicted class by the $\alpha$-powered distance to the ground-truth class. In experiments on LIMUC, CDW-CE achieved the best QWK, F1, accuracy, and MAE on full Mayo Endoscopic Scoring, the best kappa, F1, and accuracy on the binary remission task, the highest silhouette scores in both t-SNE and UMAP embeddings, and ROC-AUC gains across all MES classes. Margin-augmented CDW-CE, tuned per architecture to $m=0.05$, $0.025$, and $0.0025$, further raised QWK. The authors conclude that CDW-CE outperforms categorical and ordinal loss functions in classification performance, feature extraction, and explainability with default power and margin values.
Load-bearing premise
The load-bearing premise of the headline margin result is that Eq. (4) is the objective actually minimized, but as printed $\log(1-\max(1,\hat{y}_i+m))$ is undefined whenever $\hat{y}_i < 1-m$, so the reported margin gains hinge on an unstated implementation detail.
Editorial extensions
If this is right
- CDW-CE can be swapped into any existing ordinal classifier without changing the network architecture or label encoding, so medical severity grading systems built on cross-entropy can adopt it with minimal code change.
- Because CDW-CE reduces mispredictions at distance two and three, clinicians should see fewer cases where a severe condition is read as healthy or mild, which is the mistake that matters most for treatment decisions.
- Models trained with CDW-CE produce feature embeddings with higher silhouette scores, implying that the learned representations separate severity classes more cleanly, which should help downstream tasks such as retrieval or progression monitoring.
- The margin variant gives a small but consistent QWK boost across all three architectures, suggesting that margin-based sharpening transfers from face-recognition losses to ordinal medical classification.
Reading between the lines
- The same distance-weighting principle should transfer to other ordinal medical imaging tasks, such as diabetic retinopathy or cancer grading, where misclassification cost grows with severity distance; a natural test is whether CDW-CE beats CE on datasets with more classes and stronger imbalance.
- Because LIMUC is heavily imbalanced (54% healthy versus 7.7% severe), part of CDW-CE's gain may come from the fact that far-distance errors are also rare-class errors; on balanced ordinal datasets the margin over CE may shrink, which would identify imbalance correction as a hidden mechanism.
- The margin term's improvement over CDW-CE without margin is small (about 0.003 to 0.004 QWK); whether that gain survives on other architectures and datasets, or is specific to LIMUC, is an open empirical question.
- The printed Eq. (4) is not numerically implementable as written; if the authors used a clipped or softplus form of the margin, that variant rather than the literal formula is what should be compared in future work.
Signed reviews
Editorial analysis
A structured set of objections, weighed in public.
Referee Report
Summary. The paper proposes Class Distance Weighted Cross-Entropy (CDW-CE), a loss function that penalizes misclassifications in ordinal classification by the distance between the predicted and true classes, and a margin-augmented variant. The loss is evaluated on the LIMUC ulcerative colitis dataset using ResNet18, Inception-v3, and MobileNet-v3-large, comparing against CE, MSE, CORN, CO2, and HO2 in terms of QWK, F1, accuracy, MAE, silhouette scores, and expert evaluation of class activation maps. The authors report that CDW-CE consistently outperforms all baselines and that the margin variant further improves QWK and feature separability.
Significance. If substantiated, the no-margin CDW-CE is a simple, drop-in replacement for cross-entropy in ordinal medical image classification, with potential clinical decision-support benefits. The paper provides a broad empirical comparison across multiple architectures and metrics, and the no-margin formulation is plausible and well-defined. However, the margin-augmented loss is not implementable as written, and the claimed statistical superiority is not supported by significance tests, so the strength of the central claim is currently limited.
major comments (4)
- [Section 3.1, Eq. (4)] The margin-augmented loss in Eq. (4) is undefined over the softmax simplex. Since max(1, y_hat_i + m) >= 1 for any m > 0, the term 1 - max(1, y_hat_i + m) is non-positive, making the logarithm undefined or the loss infinite for every term. For the reported margins (0.05, 0.025, 0.0025), this equation cannot be the loss actually minimized in Table 5 or Figure 11. The authors must correct the equation, state the exact margin rule used in the experiments, and provide code or a precise derivation; otherwise the margin results are irreproducible and the abstract's claim of 'default margin values' is unsupported.
- [Section 4.1, Tables 2 and 3] The paper reports mean +/- standard deviation over an unspecified number of runs but never performs significance tests. Several key comparisons are within one standard deviation; for instance, ResNet18 QWK for CDW-CE (0.8568 +/- 0.010) is within 1 sigma of MSE (0.8540 +/- 0.007), and MobileNet-v3-L accuracy for CDW-CE (0.7759 +/- 0.010) is within 1 sigma of MSE (0.7677 +/- 0.009) under a pooled standard deviation. The claim that CDW-CE 'consistently improves performance' requires a paired significance test, confidence intervals, or an effect-size analysis across architectures and metrics.
- [Section 1 and Section 5.3] The abstract and introduction claim that CDW-CE outperforms baselines 'with default power and margin values,' but no default values are ever defined. In Section 5.3, alpha is tuned separately for each model (5, 6, 7) and the margin is tuned per model (0.05, 0.025, 0.0025). The claim is therefore unsupported: either a specific default configuration must be stated, or the word 'default' should be removed and the tuning procedure acknowledged as part of the method.
- [Section 5.2, Figure 8] The expert evaluation of CAMs does not provide inferential statistics. The average preference is 35.0% for CDW-CE versus 17.6% for CE, with 47.4% judged equal, but no confidence interval or significance test is reported, so it is not established that the difference is beyond chance. The text also states that the images shown were those that 'both models correctly identified'; this selection procedure should be described in the main text, as it may bias the comparison toward easy or ambiguous cases.
minor comments (5)
- [Section 3.1] Equation (2) is described as a non-parametric loss function, but it contains the free parameter alpha; please revise the wording to avoid the contradiction.
- [Section 5.3] The phrase 'alpha = 1 is the basic CDW-CE loss function with no class distance weights' is misleading because |i-c|^1 is still a linear distance weighting; the intended meaning might be alpha = 0 or 'no power weighting'.
- [Section 3.2] The silhouette score is described as measuring 'inter-class compactness and intra-class separation,' but the standard definition quantifies intra-class cohesion and inter-class separation; please correct the description.
- [Figure 8] The bars show only the CE and CDW-CE preference percentages; the 'equal' percentages are given only in the caption. Add the equal category to the figure or its legend for clarity.
- [Tables 2 and 3] The number of repeated runs should be stated, and confidence intervals should be preferred over standard deviations alone for the reported metrics.
Circularity Check
No significant circularity: CDW-CE is an empirical loss-function proposal evaluated against external baselines; the self-citation is provenance, not load-bearing.
full rationale
The paper proposes a new loss, CDW-CE (Eq. 2), and evaluates it empirically on the public LIMUC dataset against CE, MSE, CORN, CO2, and HO2 using accuracy, F1, QWK, MAE, AUC, silhouette scores, and expert CAM feedback. There is no derivation chain in which a predicted quantity is defined in terms of the fitted quantity or in which a fitted parameter is later renamed as a prediction. The self-citation to Polat et al. (2022a) introduces the loss as an extension, but Eq. (2) is fully restated in the present paper, so the method does not depend on that citation for its definition or evaluation. The conceptual alignment between a distance-weighted loss and the distance-weighted QWK metric is a design choice, not a circular reduction, because QWK is an independently computed evaluation metric computed from predictions, and CDW-CE is not fitted to QWK. The margin variant in Eq. (4) is mathematically malformed for softmax probabilities (the max(1, y_hat_i + m) term makes the logarithm undefined or infinite for the reported margins), which is a serious reproducibility and correctness concern, but it is not a form of circular reasoning. No uniqueness theorem is imported from the authors' prior work, no ansatz is smuggled in via citation, and no known result is renamed as a new contribution. The paper is self-contained against external benchmarks, so the appropriate circularity finding is no significant circularity.
Assumptions & free parameters
free parameters (3)
- alpha (class distance power) =
5 (ResNet18), 6 (Inception-v3), 7 (MobileNet-v3-Large)
- margin m =
0.05 (ResNet18), 0.025 (Inception-v3), 0.0025 (MobileNet-v3-Large)
- CO2/HO2 lambda and delta =
not reported
assumptions (3)
- domain assumption Ordinal class labels are uniformly spaced, so index difference |i-c| is a valid severity distance.
- domain assumption Silhouette scores computed on t-SNE and UMAP projections of latent features measure representation quality.
- domain assumption Expert judgment on CAMs for correctly classified images indicates clinically appropriate attention.
Cite this review
Pith. "Pith review of Class Distance Weighted Cross Entropy Loss for Classification of Disease Severity." pith.science (2026). https://pith.science/paper/F3O6CLXG
@misc{pith2026241201246,
  author       = {Pith},
  title        = {Pith review of: Class Distance Weighted Cross Entropy Loss for Classification of Disease Severity},
  year         = {2026},
  howpublished = {\url{https://pith.science/paper/F3O6CLXG}},
  note         = {Machine review of arXiv:2412.01246}
}
read the original abstract
Assessing disease severity with ordinal classes, where each class reflects increasing severity levels, benefits from loss functions designed for this ordinal structure. Traditional categorical loss functions, like Cross-Entropy (CE), often perform suboptimally in these scenarios. To address this, we propose a novel loss function, Class Distance Weighted Cross-Entropy (CDW-CE), which penalizes misclassifications more severely when the predicted and actual classes are farther apart. We evaluated CDW-CE using various deep architectures, comparing its performance against several categorical and ordinal loss functions. To assess the quality of latent representations, we used t-distributed stochastic neighbor embedding (t-SNE) and uniform manifold approximation and projection (UMAP) visualizations, quantified the clustering quality using the Silhouette Score, and compared Class Activation Maps (CAM) generated by models trained with CDW-CE and CE loss. Feedback from domain experts was incorporated to evaluate how well model attention aligns with expert opinion. Our results show that CDW-CE consistently improves performance in ordinal image classification tasks. It achieves higher Silhouette Scores, indicating better class discrimination capability, and its CAM visualizations show a stronger focus on clinically significant regions, as validated by domain experts. Receiver operator characteristics (ROC) curves and the area under the curve (AUC) scores highlight that CDW-CE outperforms other loss functions, including prominent ordinal loss functions from the literature.
Figures


Figures from the paper (8 more)


Reference graph
Works this paper leans on
-
[2]
CMES - Computer Modeling in Engineering and Sciences 140, 1129–1142
Enhancing ulcerative colitis diagnosis: A multi-level classification approach with deep learning. CMES - Computer Modeling in Engineering and Sciences 140, 1129–1142. doi: 10.32604/cmes.2024.047756. Barash, Y., Azaria, L., Soffer, S., Margalit Yehuda, R., Shlomi, O., Ben-Horin, S., Eliakim, R., Klang, E., Kopylov, U.,
-
[11]
Expert Systems with Applications 230, 120617
A hybrid r-ftcnn based on principal component analysis for retinal disease detection from oct images. Expert Systems with Applications 230, 120617. doi: 0.1016/j.eswa.2023.120617. Kelley, S.R., Dozois, E.J.,
-
[13]
Dimensionality reduction for visualizing high-dimensional biological data. Biosystems 220, 104749. doi: 10.1016/j.biosystems.2022.104749. McInnes, L., Healy, J., Saul, N., Großberger, L.,
arXiv 2022
-
[15]
on Computer Vision and Pattern Recognition (CVPR), pp
Ordinal regression with multiple output cnn for age estimation, in: IEEE Conf. on Computer Vision and Pattern Recognition (CVPR), pp. 4920–4928. Polat, G., Ergenc, I., Kani, H.T., Alahdab, Y.O., Atug, O., Temizel, A., 2022a. Class distance weighted cross-entropy loss for ulcerative colitis severity estimation, in: Yang, G., Aviles-Rivero, A., Roberts, M.,...
-
[17]
Disease-grading networks with ordinal regularization for medical imaging. Neurocomputing 545, 126245. doi: 10.1016/j.neucom.2023.126245. ¨Unal, F., BIrant, D., S ¸EKER, ¨O.,
-
[18]
Applied Soft Computing 134, 110020
Weighted kappa measures for ordinal multi-class classification performance. Applied Soft Computing 134, 110020. doi: 10.1016/j.asoc.2023.110020. 16
arXiv 2023
-
[861]
Niu, Z., Zhou, M., Wang, L., Gao, X., Hua, G.,
doi: 10.21105/joss.00861. Niu, Z., Zhou, M., Wang, L., Gao, X., Hua, G.,
-
[2008]
Expert Systems with Applications 34, 825–832
Comparison of classification accuracy using cohen’s weighted kappa. Expert Systems with Applications 34, 825–832. doi: 10.1016/j.eswa.2006.10.022. Cao, W., Mirjalili, V., Raschka, S.,
Show all 18 references
-
[2014]
(Eds.), Colorectal Surgery (Fifth Edition)
9 - ulcerative colitis, in: Phillips, R.K., Clark, S. (Eds.), Colorectal Surgery (Fifth Edition). 5 ed.. W.B. Saunders, Oxford, pp. 119–140. doi: 10.1016/B978-0-7020-4965-1.00009-3 . Liu, W., Wen, Y., Yu, Z., Li, M., Raj, B., Song, L.,
-
[2015]
2016 IEEE Conference on Computer Vision and Pattern Recognition (CVPR) , 2818–2826
Rethinking the inception architecture for computer vision. 2016 IEEE Conference on Computer Vision and Pattern Recognition (CVPR) , 2818–2826. Tang, W., Yang, Z., Song, Y.,
2016
-
[2016]
arXiv preprint arXiv:1612.00775
A simple squared-error reformulation for ordinal classification. arXiv preprint arXiv:1612.00775 . Belharbi, S., Ayed, I.B., McCaffrey, L., Granger, E.,
-
[2018]
Pattern Recognition Letters 105, 144–154
Weighted kappa loss function for multi-class classification of ordinal data in deep learning. Pattern Recognition Letters 105, 144–154. doi: 10.1016/j.patrec.2017.05.018. machine Learning and Applications in Artificial Intelligence. Deng, J., Guo, J., Xue, N., Zafeiriou, S.,
2017 doi
-
[2019]
arXiv preprint arXiv:1911.10720
Non-parametric uni-modality constraints for deep ordinal classification. arXiv preprint arXiv:1911.10720 . Ben-David, A.,
1911 arXiv
-
[2021]
Gastrointestinal Endoscopy 93, 187–192
Ulcer severity grading in video capsule images of patients with crohn’s disease: an ordinal neural network solution. Gastrointestinal Endoscopy 93, 187–192. doi: 10.1016/j.gie.2020.05.066. Barbero-G´ omez, J., Cruz, R.P., Cardoso, J.S., Guti´ errez, P.A., Herv´ as-Mart ´ ınez, C.,
2020 doi
-
[2022]
Inflammatory Bowel Diseases doi: 10.5281/zenodo.5827695
Labeled Images for Ulcerative Colitis (LIMUC) Dataset. Inflammatory Bowel Diseases doi: 10.5281/zenodo.5827695. He, K., Zhang, X., Ren, S., Sun, J.,
-
[2023]
Expert Systems with Applications 222, 119809
Cam-can: Class activation map-based categorical adversarial network. Expert Systems with Applications 222, 119809. doi: 10.1016/j.eswa.2023.119809. Beckham, C., Pal, C.,
2023
-
[2024]
Expert Systems with Applications 256, 124908
Detection of various gastrointestinal tract diseases through a deep learning method with ensemble elm and explainable ai. Expert Systems with Applications 256, 124908. doi: 10.1016/j.eswa.2024.124908. Albuquerque, T., Cruz, R., Cardoso, J.S.,
2024
-
[2025]
Neurocomputing 615, 128878
Cnn explanation methods for ordinal regression tasks. Neurocomputing 615, 128878. doi: 10.1016/j.neucom.2024.128878. Batchuluun, G., Choi, J., Park, K.R.,
2024
Reviewed August 12, 2026 · model on record in the stance chip above.
Discussion (0). Continue with ORCID to comment.