REVIEW 3 major objections 7 minor 6 cited by
EMPRESS. X. Spatially resolved mass-metallicity relation in extremely metal-poor galaxies: evidence of episodic star-formation fueled by a metal-poor gas infall
T0 review · 3 major / 7 minor · reviewed 2026-08-11 · deepseek-v4-flash
Pith's one-line read Half of extremely metal-poor galaxies show fresh metal-poor cores inside metal-enriched surroundings, evidence that infalling gas drives their star formation in bursts.
desk verdict First resolved mass-metallicity relation for extremely metal-poor galaxies, with a plausible but not yet bulletproof anti-correlation with star-formation surface density. read the letter →
The pith
A machine-rendered reading of the paper's core claim, the machinery that carries it, and where it could break.
The reading
What carries the argument
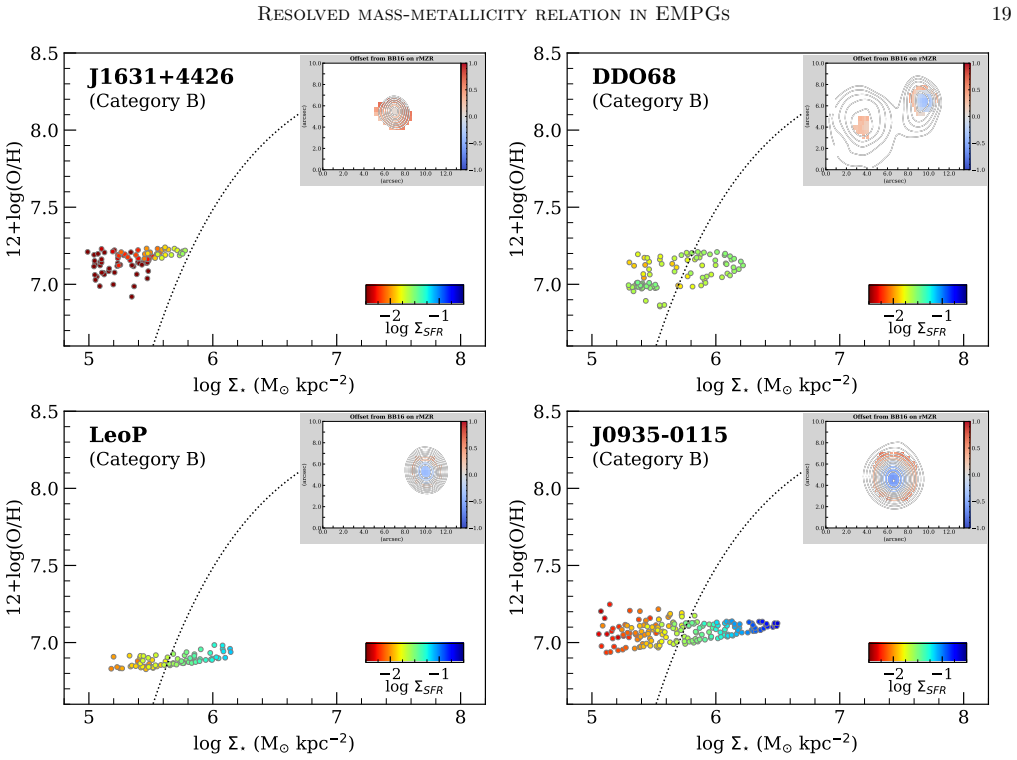
The analysis rests on the R3 metallicity indicator, $R_3=[\mathrm{O\,III}]\,\lambda5007/\mathrm{H}\beta$, applied per spaxel and corrected for ionization using the H$\beta$ equivalent width; this is the tool that turns emission-line maps into metallicity maps in a regime where $[\mathrm{O\,II}]$ and $[\mathrm{O\,III}]\.\lambda4363$ are often undetected. The other central object is the "metal-poor horizontal branch" on the resolved mass-metallicity diagram, a flat or slightly rising sequence of low-metallicity spaxels that reaches the $\Sigma_\star$ and $\Sigma_{\rm SFR}$ peaks and is surrounded by more metal-rich gas; this spatial pattern is the diagnostic through which infall and episodic star formation are inferred.
What would settle it
Measure spaxel-level metallicities in the same galaxies with an independent, direct method, using electron temperatures from $[\mathrm{O\,III}]\.\lambda4363$ where it is detected, and compare the metallicity versus $\Sigma_{\rm SFR}$ trend at fixed $\Sigma_\star$; if the trend and the metal-poor branch disappear under direct metallicities, the central claim is a calibration artifact.
Extended reading notes
Core claim
Using the R3 strong-line index, $R_3=[\mathrm{O\,III}]\,\lambda5007/\mathrm{H}\beta$, calibrated on extremely metal-poor galaxies with the H$\beta$ equivalent width as an ionization correction, the paper maps metallicities across 9,177 spatial pixels (spaxels) in 24 EMPGs. At fixed local stellar-mass surface density, spaxel metallicity decreases as local star-formation surface density increases, and the scatter of the resolved mass-metallicity relation is largely absorbed by a relation of the form $y=a+b(\mu_\alpha-c)e^{-(\mu_\alpha-c)}$ with $\mu_\alpha=\log\Sigma_\star-\alpha\log\Sigma_{\rm SFR}$ and $\alpha=0.66\pm0.04$. Half of the resolved galaxies show a distinct, nearly horizontal metal-poor branch at the peaks of $\Sigma_\star$ and $\Sigma_{\rm SFR}$, surrounded by gas enriched to about 0.1–0.2 solar metallicity; four galaxies with $Z\lesssim0.03\,Z_\odot$ show only the metal-poor branch. The paper interprets the branch-plus-envelope pattern as recent metal-poor gas infall that dilutes the center and fuels a starburst, consistent with turbulence-dominated kinematics and gas fractions near unity, and identifies the isolated-branch galaxies as likely first-phase chemical evolution systems.
Load-bearing premise
The argument assumes that the metallicity calibration returns unbiased oxygen abundances for every pixel, with no residual hidden dependence on star-formation intensity; if star-forming pixels are systematically read as more metal-poor, the anti-correlation and the flat branch could be artifacts.
Editorial extensions
If this is right
- The resolved mass-metallicity relation now reaches $12+\log(\mathrm{O/H})\approx6.9$–$7.9$ and $\Sigma_\star\approx10^5$–$10^7\,M_\odot\,\mathrm{kpc}^{-2}$, and its low-mass scatter is nearly closed by $\Sigma_{\rm SFR}$.
- If infalling metal-poor gas dilutes cores and fuels bursts, many EMPGs are not chemically young; selection on strong Balmer lines preferentially catches post-infall starbursts.
- The four Category B galaxies with isolated metal-poor clumps at $Z\lesssim0.03\,Z_\odot$ are the best local analogues of early-universe galaxies.
- Kinematic evidence ($v_{\rm rot}/\sigma<1$, gas fraction $\approx0.9$–$1.0$) supports the infall-triggered starburst picture and implies detectable kinematic discontinuities at branch locations.
Reading between the lines
- A direct test would compare spaxel-level R3 metallicities against auroral-line metallicities in galaxies where $[\mathrm{O\,III}]\.\lambda4363$ is detected: the reported metallicity–$\Sigma_{\rm SFR}$ anti-correlation should persist if it is physical rather than a calibration artifact.
- The Category A/B split predicts correlated abundance signatures, such as low N/O and high gas fraction concentrated in the metal-poor branch regions; the paper notes that forthcoming N/O work will test this.
- The same rMZR–$\Sigma_{\rm SFR}$ dependence could be sought in JWST/NIRSpec resolved observations of $z>3$ galaxies, where rapid gas accretion should produce similar cold, low-metallicity cores surrounded by more enriched envelopes.
- Mapping velocity and metallicity simultaneously in these systems could reveal whether the metal-poor branch gas is actually moving inward, giving a kinematic test of the infall interpretation.
Editorial analysis
A structured set of objections, weighed in public.
Referee Report
Summary. This paper presents Subaru/FOCAS IFU observations of 24 extremely metal-poor galaxies (EMPGs), mapping gas-phase metallicity (via the R3 index with an EW(Hβ) ionization correction), stellar mass surface density (from 6500–7000 Å continuum), and SFR surface density (from dust-corrected Hα). The authors report that the resolved mass–metallicity relation (rMZR) shows large scatter at low Σ* and that this scatter is strongly correlated with Σ_SFR, with metallicity decreasing as Σ_SFR increases at fixed Σ*. They further identify a 'metal-poor horizontal branch' in 11 of 22 spatially resolved EMPGs, located at the peaks of Σ* and Σ_SFR and surrounded by more metal-enriched gas, which they interpret as evidence for episodic star formation fueled by metal-poor gas infall. Four of the most metal-poor galaxies show only a metal-poor clump, proposed as candidates for a first phase of chemical evolution. The paper extends the rMZR to metallicities 12+log(O/H) ≈ 6.9–7.9 and includes a comparison of the classification with kinematic properties from Isobe et al. (2023).
Significance. If the central results hold, this is the first systematic spatially resolved study of the mass–metallicity relation in the extremely metal-poor regime, a parameter space barely explored by MaNGA/CALIFA and high-redshift IFU surveys. The reported anti-correlation between metallicity and Σ_SFR at fixed Σ*, and the existence of metal-poor horizontal branches, would provide direct observational evidence for metal-poor gas infall driving episodic star formation in low-mass galaxies. The four Category B objects (Z ≲ 0.03 Z☉) are potentially valuable local analogs of early galaxy formation. The paper benefits from careful data reduction, a cross-check of R3 metallicities against direct Te abundances (Figure 1), BPT-based exclusion of evolved AGN, and the use of existing high-resolution kinematics to support the inflow scenario. However, the astrophysical conclusions rest heavily on the assumption that spaxel-level metallicity differences are not dominated by systematic trends in the strong-line calibration with SFR or ionization.
major comments (3)
- [§3.1, Figure 4(c), Eq. (2)] The R3 metallicity calibration uses EW(Hβ) as the ionization proxy, while Σ_SFR is independently derived from dust-corrected Hα. Because Hα and Hβ both trace recent star formation, EW(Hβ) and Σ_SFR are strongly correlated. If the R3 calibration retains any residual dependence on ionization or SFR beyond the EW(Hβ) correction, the inferred metallicities will be systematically lower in high-Σ_SFR spaxels, artificially producing or inflating the anti-correlation in Figure 4(c) and the derived α = 0.66 in Equation (2). The validation in Figure 1 uses only integrated central spectra and does not test the per-spaxel calibration trend. The authors should quantify this residual dependence, for example by comparing R3 metallicities to Te-based metallicities in spaxels where [OIII]λ4363 is detected, or by demonstrating that the offset–Σ_SFR correlation persists when the sample is restricted to a narrow EW(Hβ) range or when an alternative ionization correction (e.g., from [OIII]/[OII] where available) is adopted.
- [§3.3, Figure 4] The statistical significance of the offset–Σ_SFR correlation and the uncertainties on the fitted parameters are computed by treating the 9,177 spaxels as independent samples. However, spaxels within a single galaxy are spatially correlated, so the effective number of independent measurements is far smaller than the spaxel count. This likely overstates the significance of the trend and underestimates the uncertainties on α in Equation (2). Please re-analyze the correlation and fit using a bootstrap resampled at the galaxy level, or a hierarchical model, and report the significance at the number of independent galaxies (24, or 22 for the resolved subsample).
- [§3.5, Figures 7–12] The classification of the 22 resolved EMPGs into Categories A–D, and particularly the identification of the 'metal-poor horizontal branch' in 11 objects, appears to be based on visual inspection of rMZR plots. Since this classification is the basis for the central claim of episodic star formation fueled by metal-poor gas infall, the criteria should be made quantitative and reproducible. Please provide a clear operational definition of the branch (e.g., a minimum number of spaxels forming a flat sequence at low metallicity, a threshold on the metallicity drop near the Σ_SFR peak, or a quantitative measure of the contrast with surrounding spaxels) and demonstrate that the 11/22 classification is robust to reasonable variations of those criteria.
minor comments (7)
- [§3.1] The sentence beginning 'Note that we do not apply slit-loss corrections...' would be clearer if the authors stated exactly which lines are used for the R3 metallicity and the continuum, since R3 = [OIII]λ5007/Hβ is a line ratio but EW(Hβ) also requires continuum.
- [§2.2] The phrase 'The FOCAS IFU data was reduced' should read 'The FOCAS IFU data were reduced'.
- [Figure 4 and related panels] The color bars in several figures (e.g., Figures 7–11) appear to be labeled 'log SFR' rather than 'log Σ_SFR'; please make the notation consistent and ensure the units (M☉ yr⁻¹ kpc⁻²) are always shown.
- [§3.3, Eq. (2)] Please state explicitly how the uncertainties on the best-fit parameters a, b, c, and α were computed, and whether the binning of spaxels or the added 0.15 dex systematic uncertainty was included in those uncertainties.
- [§3.3, Eq. (1)] The dependent variable y is not explicitly defined in the text; please state that y = 12 + log(O/H) in both Equations (1) and (2).
- [§3.4] The classification of metallicity gradients into negative, positive, and flat appears to be qualitative; please specify the threshold (e.g., slope uncertainty) used to assign each category.
- [§4.1, Figure 13] The histogram in Figure 13 uses literature central metallicities from Table 1, not the resolved metallicity maps; this is not immediately clear from the caption and should be stated more prominently.
Circularity Check
No significant circularity: the central anti-correlation is measured directly from spaxel data, and the fitted alpha is a descriptive parameter, not an input renamed as a prediction.
full rationale
The paper's central claim — that metallicity decreases with increasing Sigma_SFR at fixed Sigma_star — is established empirically from 9,177 spaxels before any model fit is introduced (Section 3.3, Figure 4a,c). The R3 metallicity calibration is adopted from Nakajima et al. (2022) and validated against direct-Te metallicities in Figure 1; although the calibration uses EW(H-beta) as an ionization proxy and Sigma_SFR is derived from H-alpha, no equation in this paper defines the metallicity in terms of Sigma_SFR or vice versa. A residual calibration bias correlated with EW(H-beta) could in principle mimic or inflate the trend, but that is a systematic-uncertainty concern, not a circular reduction: the R3-Te comparison is an external anchor, and the paper does not fit the calibration to the spaxel data it then interprets. The parameter alpha in Equation (2) is fit to the same binned data, but the paper does not present alpha as a prediction; it compares its value to independent global relations (Andrews & Martini 2013; Sanders et al. 2021; Nakajima et al. 2023), and the qualitative anti-correlation exists independently of the fit. Self-citations to EMPRESS companion papers provide sample selection, stellar masses, and kinematics, but these are published external datasets or calibrations, not the target conclusion. The categorical identification of 'metal-poor horizontal branches' is a description of the measured spaxel distribution, not an output forced by the fitting procedure.
Assumptions & free parameters
free parameters (5)
- R3-index metallicity calibration coefficients (Nakajima et al. 2022) =
not listed in this paper
- Mass-to-light ratio for stellar mass from 6500-7000 A continuum =
from Kojima et al. 2020, Isobe et al. 2021, Xu et al. 2022
- Equation (2) parameters a, b, c, alpha =
a=8.61 +/- 0.06, b=0.004 +/- 0.013, c=11.3 +/- 2.7, alpha=0.66 +/- 0.04
- H-alpha to SFR conversion (Kennicutt 1998a, Chabrier IMF) =
standard conversion
- Systematic metallicity uncertainty added to binned points =
0.15 dex
assumptions (5)
- domain assumption All spaxels are dominated by star formation, with no significant AGN contribution.
- domain assumption The R3-index is single-valued and monotonic over the probed metallicity range after selecting the low-metallicity branch.
- domain assumption EW(H-beta) is an adequate proxy for the ionization parameter in the metallicity calibration.
- domain assumption The mass-to-light ratio for EMPGs assumes constant star formation, age about 5 Myr, dust-free conditions, and a Chabrier IMF.
- ad hoc to paper Metallicity differences between spaxels are physical and not dominated by the strong-line calibration's dependence on SFR proxies.
Cite this review
Pith. "Pith review of EMPRESS. X. Spatially resolved mass-metallicity relation in extremely metal-poor galaxies: evidence of episodic star-formation fueled by a metal-poor gas infall." pith.science (2026). https://pith.science/paper/RCAWZC7L
@misc{pith2026241204541,
  author       = {Pith},
  title        = {Pith review of: EMPRESS. X. Spatially resolved mass-metallicity relation in extremely metal-poor galaxies: evidence of episodic star-formation fueled by a metal-poor gas infall},
  year         = {2026},
  howpublished = {\url{https://pith.science/paper/RCAWZC7L}},
  note         = {Machine review of arXiv:2412.04541}
}
read the original abstract
Using the Subaru/FOCAS IFU capability, we examine the spatially resolved relationships between gas-phase metallicity, stellar mass, and star-formation rate surface densities (Sigma_* and Sigma_SFR, respectively) in extremely metal-poor galaxies (EMPGs) in the local universe. Our analysis includes 24 EMPGs, comprising 9,177 spaxels, which span a unique parameter space of local metallicity (12+log(O/H) = 6.9 to 7.9) and stellar mass surface density (Sigma_* ~ 10^5 to 10^7 Msun/kpc^2), extending beyond the range of existing large integral-field spectroscopic surveys. Through spatially resolved emission line diagnostics based on the [NII] BPT-diagram, we verify the absence of evolved active galactic nuclei in these EMPGs. Our findings reveal that, while the resolved mass-metallicity relation exhibits significant scatter in the low-mass regime, this scatter is closely correlated with local star-formation surface density. Specifically, metallicity decreases as Sigma_SFR increases for a given Sigma_*. Notably, half of the EMPGs show a distinct metal-poor horizontal branch on the resolved mass-metallicity relation. This feature typically appears at the peak clump with the highest Sigma_* and Sigma_SFR and is surrounded by a relatively metal-enriched ambient region. These findings support a scenario in which metal-poor gas infall fuels episodic star formation in EMPGs, consistent with the kinematic properties observed in these systems. In addition, we identify four EMPGs with exceptionally low central metallicities (12+log(O/H) <~ 7.2), which display only a metal-poor clump without a surrounding metal-rich region. This suggests that such ultra-low metallicity EMPGs, at less than a few percent of the solar metallicity, may serve as valuable analogs for galaxies in the early stages of galaxy evolution.
Figures


Figures from the paper (16 more)




Forward citations
Cited by 6 Pith papers
-
The Interstellar Medium in I Zw 18 seen with JWST/MIRI: III. Spatially Resolved Three Ionization State Oxygen Abundance
Spatially resolved direct-method oxygen abundances in I Zw 18 reveal 60 pc-scale chemical inhomogeneities and an oxygen ionization correction factor that underestimates O3+/H+ by ~2.
-
EMPRESS. XV. A New Determination of the Primordial Helium Abundance Suggesting a Moderately Low $Y_\mathrm{P}$ Value
New Subaru spectroscopy of extremely metal-poor galaxies yields a primordial helium abundance Y_P = 0.2402 ± 0.0040, about 1 sigma below most previous estimates and consistent with ACT CMB data.
-
Exploring the mysterious high-ionization source powering [Ne V] in high-z analog SBS0335-052 E with JWST/MIRI
JWST MIRI maps of SBS 0335-052 E reveal [Ne V] emission that standard star-formation, X-ray binary, and shock models cannot reproduce, favoring a partial 10^5 solar-mass accreting black hole.
-
Candidate intermediate-mass black hole discovered in an extremely young low-metallicity cluster in the tadpole galaxy KUG 1138+327
A 10^40 erg/s X-ray source in KUG 1138+327 is best explained as an accreting intermediate-mass black hole, with a 200 pc radio jet-like counterpart.
-
Recovering the properties of the interstellar medium through integrated spectroscopy: application to the z~0 ECO volume-limited star-forming galaxy sample
Integrated optical spectra of 2052 ECO star-forming galaxies, modeled as superpositions of many H II regions, reveal low-excitation gas with average metallicity near 0.3 solar and a mass-metallicity relation consisten...
-
CROCODILE-DWARF: Assembly and Kinematics of Field Dwarf Galaxies with GADGET4-OSAKA
In 14 simulated field dwarf galaxies, gas rotational support anti-correlates with the cumulative mass fraction accreted through mergers, indicating that assembly history rather than halo mass alone shapes dwarf galaxy...
Reference graph
Works this paper leans on
-
[1]
Andrews, B. H., & Martini, P. 2013, ApJ, 765, 140, doi: 10.1088/0004-637X/765/2/140
-
[2]
Asplund, M., Grevesse, N., Sauval, A. J., & Scott, P. 2009, ARA&A, 47, 481, doi: 10.1146/annurev.astro.46.060407.145222
arXiv 2009
-
[3]
Baldwin, J. A., Phillips, M. M., & Terlevich, R. 1981, PASP, 93, 5, doi: 10.1086/130766
doi:10.1086/130766 1981
-
[4]
Barrera-Ballesteros, J. K., Heckman, T. M., Zhu, G. B., et al. 2016, MNRAS, 463, 2513, doi: 10.1093/mnras/stw1984
-
[5]
2017, MNRAS, 469, 151, doi: 10.1093/mnras/stx789
Belfiore, F., Maiolino, R., Tremonti, C., et al. 2017, MNRAS, 469, 151, doi: 10.1093/mnras/stx789
-
[6]
Berg, D. A., Skillman, E. D., Marble, A. R., et al. 2012, ApJ, 754, 98, doi: 10.1088/0004-637X/754/2/98
-
[7]
1996, A&AS, 117, 393, doi: 10.1051/aas:1996164
Bertin, E., & Arnouts, S. 1996, A&AS, 117, 393, doi: 10.1051/aas:1996164
-
[8]
Calzetti, D., Armus, L., Bohlin, R. C., et al. 2000, ApJ, 533, 682, doi: 10.1086/308692
doi:10.1086/308692 2000
Show all 95 references
-
[9]
2016, MNRAS, 457, 2605, doi: 10.1093/mnras/stw064
Ceverino, D., S´ anchez Almeida, J., Mu˜ noz Tu˜ n´ on, C., et al. 2016, MNRAS, 457, 2605, doi: 10.1093/mnras/stw064
2016 doi
-
[10]
2003, PASP, 115, 763, doi: 10.1086/376392
Chabrier, G. 2003, PASP, 115, 763, doi: 10.1086/376392
2003 doi
-
[11]
2016, MNRAS, 462, 1415, doi: 10.1093/mnras/stw1756
Chevallard, J., & Charlot, S. 2016, MNRAS, 462, 1415, doi: 10.1093/mnras/stw1756
2016 doi
-
[12]
2010, Nature, 467, 811, doi: 10.1038/nature09451
Cresci, G., Mannucci, F., Maiolino, R., et al. 2010, Nature, 467, 811, doi: 10.1038/nature09451
2010 doi
-
[13]
2017, MNRAS, 465, 1384, doi: 10.1093/mnras/stw2766
Curti, M., Cresci, G., Mannucci, F., et al. 2017, MNRAS, 465, 1384, doi: 10.1093/mnras/stw2766
2017 doi
-
[14]
2020a, MNRAS, 491, 944, doi: 10.1093/mnras/stz2910
Curti, M., Mannucci, F., Cresci, G., & Maiolino, R. 2020a, MNRAS, 491, 944, doi: 10.1093/mnras/stz2910
-
[15]
2020b, MNRAS, 492, 821, doi: 10.1093/mnras/stz3379
Curti, M., Maiolino, R., Cirasuolo, M., et al. 2020b, MNRAS, 492, 821, doi: 10.1093/mnras/stz3379
-
[16]
2024, A&A, 684, A75, doi: 10.1051/0004-6361/202346698
Curti, M., Maiolino, R., Curtis-Lake, E., et al. 2024, A&A, 684, A75, doi: 10.1051/0004-6361/202346698
2024 doi
-
[17]
2014, MNRAS, 444, 2071, doi: 10.1093/mnras/stu1427
Dekel, A., & Mandelker, N. 2014, MNRAS, 444, 2071, doi: 10.1093/mnras/stu1427
2014 doi
-
[18]
2009, Nature, 457, 451, doi: 10.1038/nature07648 Resolved mass-metallicity relation in EMPGs 27
Dekel, A., Birnboim, Y., Engel, G., et al. 2009, Nature, 457, 451, doi: 10.1038/nature07648 Resolved mass-metallicity relation in EMPGs 27
2009 doi
-
[19]
2016, ApJ, 820, 131, doi: 10.3847/0004-637X/820/2/131
El-Badry, K., Wetzel, A., Geha, M., et al. 2016, ApJ, 820, 131, doi: 10.3847/0004-637X/820/2/131
2016 doi
-
[20]
2018, MNRAS, 477, 1536, doi: 10.1093/mnras/sty730
El-Badry, K., Bradford, J., Quataert, E., et al. 2018, MNRAS, 477, 1536, doi: 10.1093/mnras/sty730
2018 doi
-
[21]
M., Elmegreen, B
Elmegreen, D. M., Elmegreen, B. G., S´ anchez Almeida, J., et al. 2012, ApJ, 750, 95, doi: 10.1088/0004-637X/750/2/95
2012 doi
-
[22]
M., den Brok, M., et al
Erroz-Ferrer, S., Carollo, C. M., den Brok, M., et al. 2019, MNRAS, 484, 5009, doi: 10.1093/mnras/stz194
2019 doi
-
[24]
2018, ApJ, 868, 89, doi: 10.3847/1538-4357/aae9f1
Gao, Y., Wang, E., Kong, X., et al. 2018, ApJ, 868, 89, doi: 10.3847/1538-4357/aae9f1
2018 doi
-
[25]
K., Pilkington, K., Brook, C
Gibson, B. K., Pilkington, K., Brook, C. B., Stinson, G. S., & Bailin, J. 2013, A&A, 554, A47, doi: 10.1051/0004-6361/201321239
2013 doi
-
[26]
2013, PASA, 30, e056, doi: 10.1017/pasa.2013.34 Gonz´ alez Delgado, R
Glazebrook, K. 2013, PASA, 30, e056, doi: 10.1017/pasa.2013.34 Gonz´ alez Delgado, R. M., Cid Fernandes, R., Garc ´ ıa-Benito, R., et al. 2014, ApJL, 791, L16, doi: 10.1088/2041-8205/791/1/L16
2013 doi
-
[27]
2023, arXiv e-prints, arXiv:2304.03726, doi: 10.48550/arXiv.2304.03726
Hatano, S., Ouchi, M., Nakajima, K., et al. 2023, arXiv e-prints, arXiv:2304.03726, doi: 10.48550/arXiv.2304.03726
2023 doi
-
[28]
2024, ApJ, 966, 170, doi: 10.3847/1538-4357/ad335c
Hatano, S., Ouchi, M., Umeda, H., et al. 2024, ApJ, 966, 170, doi: 10.3847/1538-4357/ad335c
2024 doi
-
[29]
S., Salzer, J
Hirschauer, A. S., Salzer, J. J., Skillman, E. D., et al. 2016, ApJ, 822, 108, doi: 10.3847/0004-637X/822/2/108
2016 doi
-
[30]
T., Kudritzki, R.-P., Kewley, L
Ho, I. T., Kudritzki, R.-P., Kewley, L. J., et al. 2015, MNRAS, 448, 2030, doi: 10.1093/mnras/stv067
2015 doi
-
[31]
2021, ApJ, 918, 54, doi: 10.3847/1538-4357/ac05bf
Isobe, Y., Ouchi, M., Kojima, T., et al. 2021, ApJ, 918, 54, doi: 10.3847/1538-4357/ac05bf
2021 doi
-
[32]
2022, ApJ, 925, 111, doi: 10.3847/1538-4357/ac3509
Isobe, Y., Ouchi, M., Suzuki, A., et al. 2022, ApJ, 925, 111, doi: 10.3847/1538-4357/ac3509
2022 doi
-
[33]
2023, ApJ, 951, 102, doi: 10.3847/1538-4357/accc87
Isobe, Y., Ouchi, M., Nakajima, K., et al. 2023, ApJ, 951, 102, doi: 10.3847/1538-4357/accc87
2023 doi
-
[34]
I., Guseva, N
Izotov, I. I., Guseva, N. G., Lipovetskii, V. A., Kniazev, A. I., & Stepanian, J. A. 1990, Nature, 343, 238, doi: 10.1038/343238a0
1990 doi
-
[35]
I., Guseva, N
Izotov, Y. I., Guseva, N. G., Fricke, K. J., & Papaderos, P. 2009, A&A, 503, 61, doi: 10.1051/0004-6361/200911965
2009 doi
-
[36]
I., Thuan, T
Izotov, Y. I., Thuan, T. X., & Guseva, N. G. 2012, A&A, 546, A122, doi: 10.1051/0004-6361/201219733 —. 2019, MNRAS, 483, 5491, doi: 10.1093/mnras/sty3472 —. 2021, MNRAS, 504, 3996, doi: 10.1093/mnras/stab1099
2012 doi
-
[37]
I., Thuan, T
Izotov, Y. I., Thuan, T. X., Guseva, N. G., & Liss, S. E. 2018, MNRAS, 473, 1956, doi: 10.1093/mnras/stx2478
2018 doi
-
[38]
2010, ApJL, 725, L176, doi: 10.1088/2041-8205/725/2/L176
Jones, T., Ellis, R., Jullo, E., & Richard, J. 2010, ApJL, 725, L176, doi: 10.1088/2041-8205/725/2/L176
2010 doi
-
[39]
S., Richard, J., & Jullo, E
Jones, T., Ellis, R. S., Richard, J., & Jullo, E. 2013, ApJ, 765, 48, doi: 10.1088/0004-637X/765/1/48
2013 doi
-
[40]
K., Isobe, Y., et al
Kashiwagi, Y., Inoue, A. K., Isobe, Y., et al. 2021, PASJ, 73, 1631, doi: 10.1093/pasj/psab100
2021 doi
-
[41]
M., Tremonti, C., et al
Kauffmann, G., Heckman, T. M., Tremonti, C., et al. 2003, MNRAS, 346, 1055, doi: 10.1111/j.1365-2966.2003.07154.x
2003
-
[42]
2022, JCAP, 2022, 041, doi: 10.1088/1475-7516/2022/08/041
Kawasaki, M., & Murai, K. 2022, JCAP, 2022, 041, doi: 10.1088/1475-7516/2022/08/041
2022 doi
-
[43]
2021, ApJL, 908, L54, doi: 10.3847/2041-8213/abe41b
Ramos-Larios, G. 2021, ApJL, 908, L54, doi: 10.3847/2041-8213/abe41b
2021 doi
-
[44]
M., Guerrero, M
Kehrig, C., V ´ ılchez, J. M., Guerrero, M. A., et al. 2018, MNRAS, 480, 1081, doi: 10.1093/mnras/sty1920
2018 doi
-
[45]
M., P´ erez-Montero, E., et al
Kehrig, C., V ´ ılchez, J. M., P´ erez-Montero, E., et al. 2015, ApJL, 801, L28, doi: 10.1088/2041-8205/801/2/L28
2015 doi
-
[46]
1989, ApJ, 344, 685, doi: 10.1086/167834 —
Kennicutt, Robert C., J. 1989, ApJ, 344, 685, doi: 10.1086/167834 —. 1998a, ARA&A, 36, 189, doi: 10.1146/annurev.astro.36.1.189 —. 1998b, ApJ, 498, 541, doi: 10.1086/305588 Kereˇ s, D., Katz, N., Weinberg, D. H., & Dav´ e, R. 2005, MNRAS, 363, 2, doi: 10.1111/j.1365-2966.2005.09451.x
1989
-
[47]
J., Dopita, M
Kewley, L. J., Dopita, M. A., Leitherer, C., et al. 2013, ApJ, 774, 100, doi: 10.1088/0004-637X/774/2/100
2013 doi
-
[48]
J., Dopita, M
Kewley, L. J., Dopita, M. A., Sutherland, R. S., Heisler, C. A., & Trevena, J. 2001, ApJ, 556, 121, doi: 10.1086/321545
2001 doi
- [49]
-
[50]
Y., Grebel, E
Kniazev, A. Y., Grebel, E. K., Hao, L., et al. 2003, ApJL, 593, L73, doi: 10.1086/378259
2003 doi
-
[51]
2020, ApJ, 898, 142, doi: 10.3847/1538-4357/aba047 —
Kojima, T., Ouchi, M., Rauch, M., et al. 2020, ApJ, 898, 142, doi: 10.3847/1538-4357/aba047 —. 2021, ApJ, 913, 22, doi: 10.3847/1538-4357/abec3d
2020 doi
-
[52]
2000, A&A Rv, 10, 1, doi: 10.1007/s001590000005 Lara-L´ opez, M
Kunth, D., & ¨Ostlin, G. 2000, A&A Rv, 10, 1, doi: 10.1007/s001590000005 Lara-L´ opez, M. A., Cepa, J., Bongiovanni, A., et al. 2010, A&A, 521, L53, doi: 10.1051/0004-6361/201014803
2000 doi
-
[53]
J., Carollo, C
Lilly, S. J., Carollo, C. M., Pipino, A., Renzini, A., & Peng, Y. 2013, ApJ, 772, 119, doi: 10.1088/0004-637X/772/2/119
2013 doi
-
[54]
F., Feldmann, R., et al
Ma, X., Hopkins, P. F., Feldmann, R., et al. 2017, MNRAS, 466, 4780, doi: 10.1093/mnras/stx034
2017 doi
-
[55]
2019, A&A Rv, 27, 3, doi: 10.1007/s00159-018-0112-2
Maiolino, R., & Mannucci, F. 2019, A&A Rv, 27, 3, doi: 10.1007/s00159-018-0112-2
2019 doi
-
[56]
2008, A&A, 488, 463, doi: 10.1051/0004-6361:200809678 28 Nakajima et al
Maiolino, R., Nagao, T., Grazian, A., et al. 2008, A&A, 488, 463, doi: 10.1051/0004-6361:200809678 28 Nakajima et al
2008 doi
-
[57]
C., & Ceverino, D
Bosch, F. C., & Ceverino, D. 2018, ApJ, 861, 148, doi: 10.3847/1538-4357/aaca98
2018 doi
-
[58]
2010, MNRAS, 408, 2115, doi: 10.1111/j.1365-2966.2010.17291.x
Gnerucci, A. 2010, MNRAS, 408, 2115, doi: 10.1111/j.1365-2966.2010.17291.x
2010
- [59]
-
[60]
2022, ApJ, 941, 167, doi: 10.3847/1538-4357/ac9ea1
Matsumoto, A., Ouchi, M., Nakajima, K., et al. 2022, ApJ, 941, 167, doi: 10.3847/1538-4357/ac9ea1
2022 doi
-
[61]
2024, A&A, 691, A345, doi: 10.1051/0004-6361/202450407 Moll´ a, M., D ´ ıaz,´A
Mazzolari, G., ¨Ubler, H., Maiolino, R., et al. 2024, A&A, 691, A345, doi: 10.1051/0004-6361/202450407 Moll´ a, M., D ´ ıaz,´A. I., Cavichia, O., et al. 2019, MNRAS, 482, 3071, doi: 10.1093/mnras/sty2877
2024 doi
-
[62]
2013, MNRAS, 435, 2918, doi: 10.1093/mnras/stt1495
Mott, A., Spitoni, E., & Matteucci, F. 2013, MNRAS, 435, 2918, doi: 10.1093/mnras/stt1495
2013 doi
-
[63]
2011, arXiv e-prints, arXiv:1112.3300
Moustakas, J., Zaritsky, D., Brown, M., et al. 2011, arXiv e-prints, arXiv:1112.3300. https://arxiv.org/abs/1112.3300
2011 arXiv
-
[64]
2006, A&A, 459, 85, doi: 10.1051/0004-6361:20065216
Nagao, T., Maiolino, R., & Marconi, A. 2006, A&A, 459, 85, doi: 10.1051/0004-6361:20065216
2006 doi
-
[65]
2022, MNRAS, 513, 5134, doi: 10.1093/mnras/stac1242
Nakajima, K., & Maiolino, R. 2022, MNRAS, 513, 5134, doi: 10.1093/mnras/stac1242
2022 doi
-
[66]
2023, ApJS, 269, 33, doi: 10.3847/1538-4365/acd556
Nakajima, K., Ouchi, M., Isobe, Y., et al. 2023, ApJS, 269, 33, doi: 10.3847/1538-4365/acd556
2023 doi
-
[67]
2022, ApJS, 262, 3, doi: 10.3847/1538-4365/ac7710
Nakajima, K., Ouchi, M., Xu, Y., et al. 2022, ApJS, 262, 3, doi: 10.3847/1538-4365/ac7710
2022 doi
-
[68]
2023, ApJ, 952, 11, doi: 10.3847/1538-4357/accf14
Nishigaki, M., Ouchi, M., Nakajima, K., et al. 2023, ApJ, 952, 11, doi: 10.3847/1538-4357/accf14
2023 doi
-
[69]
D., Dav´ e, R., Katz, N., Kollmeier, J
Oppenheimer, B. D., Dav´ e, R., Katz, N., Kollmeier, J. A., & Weinberg, D. H. 2012, MNRAS, 420, 829, doi: 10.1111/j.1365-2966.2011.20096.x
2012
-
[70]
2020, PASJ, 72, 97, doi: 10.1093/pasj/psaa092
Ozaki, S., Fukushima, M., Iwashita, H., et al. 2020, PASJ, 72, 97, doi: 10.1093/pasj/psaa092
2020 doi
-
[71]
A., Kniazev, A
Pustilnik, S. A., Kniazev, A. Y., & Pramskij, A. G. 2005, A&A, 443, 91, doi: 10.1051/0004-6361:20053102 Rickards Vaught, R. J., Sandstrom, K. M., & Hunt, L. K. 2021, ApJL, 911, L17, doi: 10.3847/2041-8213/abf09b S´ anchez, S. F., Rosales-Ortega, F. F., Jungwiert, B., et al. 20...
2005 doi
-
[72]
G., & M´ endez-Abreu, J
Elmegreen, B. G., & M´ endez-Abreu, J. 2013, ApJ, 767, 74, doi: 10.1088/0004-637X/767/1/74 S´ anchez Almeida, J., P´ erez-Montero, E., Morales-Luis, A. B., et al. 2016, ApJ, 819, 110, doi: 10.3847/0004-637X/819/2/110 S´ anchez Almeida, J., Elmegreen, B. G., Mu˜ noz-Tu˜ n´ on, ...
2013 doi
-
[73]
L., Shapley, A
Sanders, R. L., Shapley, A. E., Jones, T., et al. 2021, ApJ, 914, 19, doi: 10.3847/1538-4357/abf4c1
2021 doi
-
[74]
Schaerer, D., Fragos, T., & Izotov, Y. I. 2019, A&A, 622, L10, doi: 10.1051/0004-6361/201935005
2019 doi
-
[75]
M., et al
Schaye, J., Dalla Vecchia, C., Booth, C. M., et al. 2010, MNRAS, 402, 1536, doi: 10.1111/j.1365-2966.2009.16029.x
2010
-
[76]
1959, ApJ, 129, 243, doi: 10.1086/146614
Schmidt, M. 1959, ApJ, 129, 243, doi: 10.1086/146614
1959 doi
-
[77]
P., Mirocha, J., et al
Senchyna, P., Stark, D. P., Mirocha, J., et al. 2020, MNRAS, 494, 941, doi: 10.1093/mnras/staa586
2020 doi
-
[78]
D., Salzer, J
Skillman, E. D., Salzer, J. J., Berg, D. A., et al. 2013, AJ, 146, 3, doi: 10.1088/0004-6256/146/1/3
2013 doi
-
[79]
S., & Dav´ e, R
Somerville, R. S., & Dav´ e, R. 2015, ARA&A, 53, 51, doi: 10.1146/annurev-astro-082812-140951
2015 doi
-
[80]
T., Lilly, S
Soto, K. T., Lilly, S. J., Bacon, R., Richard, J., & Conseil, S. 2016, MNRAS, 458, 3210, doi: 10.1093/mnras/stw474
2016 doi
- [81]
-
[83]
X., Guseva, N
Thuan, T. X., Guseva, N. G., & Izotov, Y. I. 2022, MNRAS, 516, L81, doi: 10.1093/mnrasl/slac095
2022 doi
- [84]
-
[85]
A., Heckman, T
Tremonti, C. A., Heckman, T. M., Kauffmann, G., et al. 2004, ApJ, 613, 898, doi: 10.1086/423264
2004 doi
- [86]
-
[87]
2014, A&A, 563, A58, doi: 10.1051/0004-6361/201322099
Troncoso, P., Maiolino, R., Sommariva, V., et al. 2014, A&A, 563, A58, doi: 10.1051/0004-6361/201322099
2014 doi
-
[88]
2022, ApJ, 930, 37, doi: 10.3847/1538-4357/ac602d van de Voort, F., & Schaye, J
Umeda, H., Ouchi, M., Nakajima, K., et al. 2022, ApJ, 930, 37, doi: 10.3847/1538-4357/ac602d van de Voort, F., & Schaye, J. 2012, MNRAS, 423, 2991, doi: 10.1111/j.1365-2966.2012.20949.x
2022
-
[89]
2023, A&A, 678, A173, doi: 10.1051/0004-6361/202346981
Vanzella, E., Loiacono, F., Bergamini, P., et al. 2023, A&A, 678, A173, doi: 10.1051/0004-6361/202346981
2023 doi
-
[90]
2024, A&A, 691, A19, doi: 10.1051/0004-6361/202449855 Resolved mass-metallicity relation in EMPGs 29
Venturi, G., Carniani, S., Parlanti, E., et al. 2024, A&A, 691, A19, doi: 10.1051/0004-6361/202449855 Resolved mass-metallicity relation in EMPGs 29
2024 doi
-
[91]
2024, ApJ, 962, 50, doi: 10.3847/1538-4357/ad13ff
Watanabe, K., Ouchi, M., Nakajima, K., et al. 2024, ApJ, 962, 50, doi: 10.3847/1538-4357/ad13ff
2024 doi
-
[92]
H., Turk, M
Wise, J. H., Turk, M. J., Norman, M. L., & Abel, T. 2012, ApJ, 745, 50, doi: 10.1088/0004-637X/745/1/50
2012 doi
-
[93]
2016, ApJ, 827, 74, doi: 10.3847/0004-637X/827/1/74
Wuyts, E., Wisnioski, E., Fossati, M., et al. 2016, ApJ, 827, 74, doi: 10.3847/0004-637X/827/1/74
2016 doi
-
[94]
2022, ApJ, 929, 134, doi: 10.3847/1538-4357/ac5e32
Xu, Y., Ouchi, M., Rauch, M., et al. 2022, ApJ, 929, 134, doi: 10.3847/1538-4357/ac5e32
2022 doi
-
[95]
2024, ApJ, 961, 49, doi: 10.3847/1538-4357/ad06ab
Xu, Y., Ouchi, M., Isobe, Y., et al. 2024, ApJ, 961, 49, doi: 10.3847/1538-4357/ad06ab
2024 doi
-
[96]
2023, MNRAS, 525, 4832, doi: 10.1093/mnras/stad2497
Yajima, H., Abe, M., Fukushima, H., et al. 2023, MNRAS, 525, 4832, doi: 10.1093/mnras/stad2497
2023 doi
-
[97]
2022, ApJ, 926, 57, doi: 10.3847/1538-4357/ac3b55
Yao, Y., Liu, H., Kong, X., et al. 2022, ApJ, 926, 57, doi: 10.3847/1538-4357/ac3b55
2022 doi
Reviewed August 11, 2026 · model on record in the stance chip above.
Discussion (0). Continue with ORCID to comment.