REVIEW 4 major objections 6 minor 34 references
Towards Modeling Data Quality and Machine Learning Model Performance
T0 review · 4 major / 6 minor · reviewed 2026-08-11 · deepseek-v4-flash
Pith's one-line read The paper introduces a deterministic-non-deterministic ratio (DDR) that quantifies data quality and uses accuracy-DDR curves to score model performance under uncertainty.
desk verdict A reparameterized SNR dressed as a new metric, with a circular validation loop and an unproven identifiability assumption; useful as a cautionary example, not as a contribution. read the letter →
The pith
A machine-rendered reading of the paper's core claim, the machinery that carries it, and where it could break.
The reading
What carries the argument
The central object is the deterministic-non-deterministic ratio, DDR, the ratio of the power of the deterministic component to the power of the whole signal, $DDR(Y)=P(D)/P(Y)$, where power is $P(X)=\frac{1}{|T|}\sum_t X(t)^2$. The argument is carried by the additive decomposition $Y(t)=D(t)+E(t)$ with $E$ zero-mean and constant variance, which lets DDR reduce to $P(D)/(P(D)+P(E))$. To make accuracy comparable across datasets, the paper introduces DDR-invariant standardization, an affine rescaling of $D$ that keeps the dataset mean zero, variance one, and DDR unchanged, and it uses hit-and-run sampling, a procedure that samples points uniformly inside a bounded region, to generate sets of datasets whose squared DDRs are uniformly distributed. The accuracy-DDR curve, and its integral $p_M$, are the output object that converts the ratio into a performance statement.
What would settle it
Generate two datasets with identical DDR and the same deterministic component but different noise distributions, for example Gaussian versus heavy-tailed or homoscedastic versus heteroscedastic, train the same model on each, and compare accuracies; if accuracy differs systematically at the same DDR, then DDR alone does not determine model performance.
Extended reading notes
Core claim
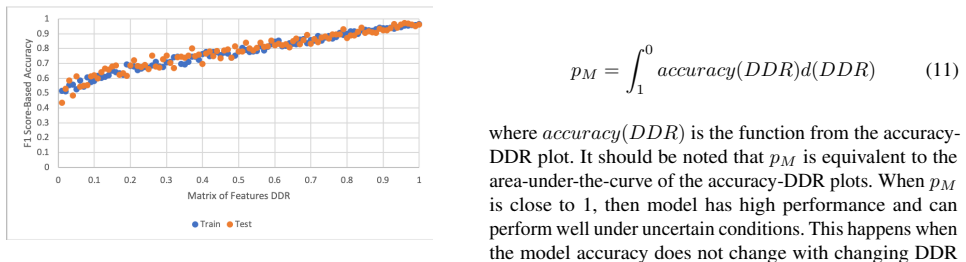
The core claim is that a dataset's noise content can be quantified by DDR, defined as $DDR(Y) \approx \frac{\sum_t D(t)^2}{\sum_t D(t)^2 + \sum_t E(t)^2}$ for $Y(t)=D(t)+E(t)$ with $E$ independent, zero-mean, homoscedastic noise. The paper's experiments on five regression and five classification models generate synthetic data bottom-up with controlled noise, standardize datasets in a DDR-preserving way, and plot accuracy against DDR; the plots show accuracy increasing with DDR. From these curves the paper defines the trustworthiness portfolio $p_M = \int_0^1 \mathrm{accuracy}(r)\,dr$, interpreted as the area under the accuracy-DDR curve, and uses it to rank models: decision-tree regression and multi-layer perceptron classification come out highest, K-nearest-neighbor models lowest. The authors read these results as evidence that DDR is a valid data-quality metric and that the area under the accuracy-DDR curve measures a model's reliability under uncertainty.
Load-bearing premise
The load-bearing premise is that every dataset really is a predictable signal plus independent random noise that averages to zero and has constant spread, and that the split is known or recoverable; without such a split, DDR cannot be computed and the accuracy-DDR curve is undefined.
Editorial extensions
If this is right
- A model's accuracy-DDR curve gives a per-noise-level performance profile, so two models that tie on raw accuracy can be separated by which one degrades less as DDR falls.
- The trustworthiness portfolio, as the area under the accuracy-DDR curve, is a single number that ranks models by performance across uncertainty levels.
- DDR-invariant standardization makes it possible to compare accuracy across datasets with different DDR values without standardization artifacts.
- The reported experimental rankings (decision-tree regressor and multi-layer perceptron classifier highest, KNN models lowest) are the expected ordering if the accuracy-DDR curves are valid.
Reading between the lines
- If real-data decompositions can be estimated, for example by denoising, DDR could serve as a pre-training diagnostic that flags features whose noise budget will cap achievable accuracy.
- The homoscedastic zero-mean assumption could be relaxed; a definition based on expectations rather than sample powers would extend DDR to heteroscedastic or correlated noise, and that extension is testable with the same curves.
- The accuracy-DDR curve suggests a model-selection rule: choose the model whose curve is flattest in the DDR range of the deployment environment, rather than the model with the highest accuracy at a single noise level.
Signed reviews
Editorial analysis
A structured set of objections, weighed in public.
Referee Report
Summary. The paper proposes a new data-quality metric, the deterministic-non-deterministic ratio (DDR), defined as the ratio of deterministic-signal power to total signal power under an assumed additive decomposition Y(t)=D(t)+E(t). It introduces DDR-invariant standardization to produce accuracy-versus-DDR curves for several regression and classification models on synthetic data, and defines a trustworthiness portfolio p_M as the area under the accuracy-DDR curve. The authors claim that DDR quantifies data quality and that accuracy-DDR curves can determine model performance under uncertainty.
Significance. If the DDR were well-defined, computable from data, and shown to be a genuine data-quality measure, the proposed accuracy-DDR curves and trustworthiness portfolio could provide a useful tool for comparing model robustness to noise. The paper's ambition to relate data quality to model performance in a quantitative way is relevant to the ML community. However, the significance is currently undermined by foundational issues: the DDR is not identifiable from real data, the standardization procedure forces the DDR values used in the plots, and the empirical trend is stated inconsistently. The manuscript does not yet deliver a usable metric or a credible validation of its central claim.
major comments (4)
- [Section 4, Eq. (1)] The paper assumes that any observed data can be decomposed as Y(t)=D(t)+E(t) with D and E independent and E zero-mean homoscedastic, but it explicitly states that in real data this split 'is very complicated and the solution may be unknown' and that there may be 'infinite possible combinations.' No estimator for D or E is provided (the mention of autoencoders is not developed). Consequently, for a fixed real dataset, distinct valid decompositions can yield different DDR values, so the accuracy-DDR curve is not a function of the data alone. This is a load-bearing gap: the central claim that DDR-accuracy curves determine model performance requires DDR to be a computable property of a dataset.
- [Algorithm 1 and Appendix B, Eqs. (7)-(9), (18)] The DDR-invariant standardization is circular. The method solves for alpha, beta, and sigma^2_{E_stand} using equations that contain the target DDR r, including sigma^2_{E_stand} = 1-r and D_stand = alpha*D + beta with alpha = sqrt(r)/SD(t). This construction explicitly imposes that P(D_stand)=r and P(E_stand)=1-r, so the resulting standardized datasets have DDR equal to the chosen r by construction. The theorem stating that the standardized data preserves DDR is therefore not a substantive invariance result; it is a restatement of the definition of the algorithm. The paper does not provide a proof that the algorithm achieves the stated criteria for arbitrary D and E, and the 'approximations' in Eqs. (7)-(9) are not derived in a way that establishes the claimed properties.
- [Section 4, Theorem (DDR-Invariant Standardization)] The theorem is stated without proof. The three criteria (zero mean, unit variance, DDR preserved equal to r) are asserted, but Appendix B only performs a heuristic derivation under the additional assumption D_stand(t)=alpha*D(t)+beta, without justifying why this affine form is sufficient or necessary. Since the theorem is used to justify the entire experimental pipeline, the missing proof is a load-bearing omission. Either a rigorous proof or a clear statement of additional assumptions is required.
- [Section 6, Experiment Results paragraph] The summary of the empirical results is self-contradictory. The text states: 'As DDR increases, accuracy also decreases which translates to as there is more deterministic component in the data, higher is the accuracy.' The first clause says accuracy decreases with DDR, while the second clause says accuracy increases with the deterministic component (i.e., with higher DDR). These appear to assert opposite monotonic relationships. If the intended claim is that accuracy increases with DDR, then the rest of the discussion and the trustworthiness portfolio interpretation depend on that direction; the contradiction undercuts the empirical support for the claimed trend and must be resolved.
minor comments (6)
- [Throughout] There are frequent typos and grammatical errors (e.g., 'Decsision Tree' in Figure 6, 'Classsification' in Figure 8, 'effect' for 'affect' in Section 3, 'uncertainity' in Section 6, 'data quality by as a function' in Section 1). A thorough proofreading pass is needed.
- [Section 2] The related-work survey is broad but somewhat unfocused, and several citations are used loosely (e.g., Vapnik and Izmailov are cited as associated with data quality without explanation of the connection). The paper would benefit from a clearer positioning against the aleatoric/epistemic uncertainty literature, which it cites but does not systematically relate to DDR.
- [Equation (11)] The trustworthiness portfolio p_M is defined as the integral of accuracy(DDR) over DDR from 0 to 1. The notation in the text is garbled ('Z 0 1'), and the definitional relationship between Eq. (10), which multiplies accuracy by DDR, and Eq. (11), which integrates accuracy alone, is never explained.
- [Figures 1-9] The figures are not described in the text in terms of the specific data-generation settings (e.g., number of features, number of samples, noise distributions). Without this information, the experimental setup is not reproducible even though code is referenced.
- [Section 6] The paper states that 'For the accuracy-DDR plot for the regression algorithm, the accuracy-DDR relationship is almost linear' and later says the relationship is linear for classification except at low DDR, but also claims MLP is the most reliable because 'accuracy does not change significantly with DDR.' These observations are not quantified, and there are no confidence intervals or error bars in the figures.
- [References] The citation to Font-Clos [2021] for hit-and-run sampling is a software repository rather than the original algorithm (Smith 1984), which is cited separately; the relationship between the two should be clarified.
Circularity Check
Partial circularity: the 'DDR-invariant standardization' theorem defines DDR preservation into its own premises, and the trustworthiness portfolio is the area under accuracy-DDR curves whose x-axis is that imposed parameter.
-
self definitional
[Section 4, 'Theorem: DDR-Invariant Standardization'; Appendix B, Eqs. (18)-(21)]
"Y stand(t) is DDR-invariant standardized if it fulfills the following criteria: ... DDR(D) =DDR(Dstand) =r. ... Upon solving for α, β, and σ2 Estand(t), we found that: α = sqrt(r)/σD(t), β = -E[D(t)]/σD(t)*sqrt(r), σ2 Estand(t) = 1-r"
The theorem defines 'DDR-invariant standardization' by the condition DDR(Dstand)=r, then solves for α, β, and σ^2_Estand so that the standardized deterministic component has power r and the standardized noise has power 1-r. Thus the preservation of DDR=r is imposed by the defining constraints themselves; it is a tautology masquerading as a derived theorem. The same r is then used as the x-coordinate in the accuracy-DDR plots, so the independent variable is an input parameter of the construction, not a quantity estimated from data via Eq. (2)/(4).
-
self definitional
[Section 5, Eqs. (10)-(11)]
"pM = ∫_0^1 accuracy(DDR)d(DDR) (11) ... it should be noted that pM is equivalent to the area-under-the-curve of the accuracy-DDR plots."
The trustworthiness portfolio p_M is defined as a functional of the accuracy-DDR plot, but that plot's DDR values are the construction parameters r from DDR-invariant standardization (Appendix B). Hence p_M averages the measured accuracy over the noise levels chosen by the authors' algorithm; it is a summary of the same construction that defines the x-axis, not a prediction about a measured DDR of an arbitrary dataset. The 'true performance under uncertain conditions' therefore partially reduces to the experimenter's chosen r values.
full rationale
The paper's central empirical observation—that accuracy changes with the deterministic/non-deterministic composition of synthetic data—is not itself circular, because accuracy is genuinely measured on the generated datasets. However, two load-bearing pieces of the derivation are circular by construction. First, the 'Theorem: DDR-Invariant Standardization' states a defining criterion (DDR(Dstand)=r) and then solves for α, β, and σ^2_Estand to force exactly that criterion, making the preservation of DDR a definitional tautology rather than an independent mathematical result. Second, the trustworthiness portfolio p_M = ∫ accuracy(DDR)d(DDR) integrates over accuracy-DDR curves whose x-axis is that same imposed parameter r, so the claimed measure of model performance under uncertainty is partly defined as an average over the authors' chosen noise levels rather than over a data-driven estimate of DDR. The paper also acknowledges in Section 4 that splitting real data into deterministic and non-deterministic components 'is very complicated and the solution may be unknown,' which is a serious identification gap for applying DDR to real data, but that is a validity limitation rather than a circularity. The self-citations to Anjum et al. [2022, 2023] appear only in related-work context and do not carry the argument, so no self-citation circularity is scored. Section 6's contradictory sentence ('As DDR increases, accuracy also decreases' followed by 'more deterministic component ... higher is the accuracy') is a correctness/writing issue, not a circularity. Overall, there is partial circularity in the construction of the curves and the portfolio metric, justifying a score of 6 rather than a higher score; the accuracy measurements themselves retain independent empirical content.
Assumptions & free parameters
free parameters (1)
- r (target DDR in DDR-invariant standardization) =
Swept between 0 and 1 in experiments
assumptions (5)
- domain assumption Every observed dataset decomposes as Y(t)=D(t)+E(t), with E zero-mean homoscedastic and independent of D.
- ad hoc to paper DDR-invariant standardization can be obtained by an affine transform Dstand = alpha*D + beta.
- domain assumption Synthetic data generated with a prescribed DDR are representative of real-world data quality.
- domain assumption Model accuracy can be summarized by NMSE-based accuracy for regression and F1-score for classification, and these values are comparable across datasets standardized to unit variance and zero mean.
- domain assumption The area under the accuracy-DDR curve is a valid single-number measure of model performance under uncertainty.
invented entities (2)
-
Deterministic-Non-Deterministic Ratio (DDR)
-
Trustworthiness portfolio p_M
Cite this review
Pith. "Pith review of Towards Modeling Data Quality and Machine Learning Model Performance." pith.science (2026). https://pith.science/paper/ZVQ6IK4H
@misc{pith2026241205882,
  author       = {Pith},
  title        = {Pith review of: Towards Modeling Data Quality and Machine Learning Model Performance},
  year         = {2026},
  howpublished = {\url{https://pith.science/paper/ZVQ6IK4H}},
  note         = {Machine review of arXiv:2412.05882}
}
read the original abstract
Understanding the effect of uncertainty and noise in data on machine learning models (MLM) is crucial in developing trust and measuring performance. In this paper, a new model is proposed to quantify uncertainties and noise in data on MLMs. Using the concept of signal-to-noise ratio (SNR), a new metric called deterministic-non-deterministic ratio (DDR) is proposed to formulate performance of a model. Using synthetic data in experiments, we show how accuracy can change with DDR and how we can use DDR-accuracy curves to determine performance of a model.
Figures


Figures from the paper (4 more)


Reference graph
Works this paper leans on
-
[1]
Localization of unidentified events with raw microblogging data
Usman Anjum, Vladimir Zadorozhny, and Prashant Krishnamurthy. Localization of unidentified events with raw microblogging data. Online Social Networks and Media, 29: 0 100209, 2022
work page 2022
-
[2]
TBAM: Towards An Agent-Based Model to Enrich Twitter Data
Usman Anjum, Vladimir Zadorozhny, and Prashant Krishnamurthy. Tbam: Towards an agent-based model to enrich twitter data. arXiv preprint arXiv:2302.00128, 2023
work page Pith review arXiv 2023
-
[3]
Data quality and explainable ai
Leopoldo Bertossi and Floris Geerts. Data quality and explainable ai. Journal of Data and Information Quality (JDIQ), 12 0 (2): 0 1--9, 2020
work page 2020
-
[4]
Principles for Evaluation of AI/ML Model Performance and Robustness
Olivia Brown, Andrew Curtis, and Justin Goodwin. Principles for evaluation of ai/ml model performance and robustness. arXiv preprint arXiv:2107.02868, 2021
work page Pith review arXiv 2021
-
[5]
Performance evaluation in machine learning: the good, the bad, the ugly, and the way forward
Peter Flach. Performance evaluation in machine learning: the good, the bad, the ugly, and the way forward. In Proceedings of the AAAI conference on artificial intelligence, volume 33, pages 9808--9814, 2019
work page 2019
-
[6]
fontclos/hitandrun: Initial release, Jun 2021
Francesc Font-Clos. fontclos/hitandrun: Initial release, Jun 2021
work page 2021
-
[7]
A survey of uncertainty in deep neural networks
Jakob Gawlikowski, Cedrique Rovile Njieutcheu Tassi, Mohsin Ali, Jongseok Lee, Matthias Humt, Jianxiang Feng, Anna Kruspe, Rudolph Triebel, Peter Jung, Ribana Roscher, et al. A survey of uncertainty in deep neural networks. Artificial Intelligence Review, 56 0 (Suppl 1): 0 1513--1589, 2023
2023
-
[8]
Uncertainty in big data analytics: survey, opportunities, and challenges
Reihaneh H Hariri, Erik M Fredericks, and Kate M Bowers. Uncertainty in big data analytics: survey, opportunities, and challenges. Journal of Big Data, 6 0 (1): 0 1--16, 2019
work page 2019
Show all 34 references
-
[9]
Aleatoric and epistemic uncertainty in machine learning: An introduction to concepts and methods
Eyke H \"u llermeier and Willem Waegeman. Aleatoric and epistemic uncertainty in machine learning: An introduction to concepts and methods. Machine Learning, 110: 0 457--506, 2021
2021
-
[10]
To trust or not to trust a classifier
Heinrich Jiang, Been Kim, Melody Guan, and Maya Gupta. To trust or not to trust a classifier. Advances in neural information processing systems, 31, 2018
2018
-
[11]
Trust in artificial intelligence: Meta-analytic findings
Alexandra D Kaplan, Theresa T Kessler, J Christopher Brill, and PA Hancock. Trust in artificial intelligence: Meta-analytic findings. Human factors, 65 0 (2): 0 337--359, 2023
2023
-
[12]
Data-centric ai solutions and emerging technologies in the healthcare ecosystem
Alex Khang, Geeta Rana, RK Tailor, and Vugar Abdullayev. Data-centric ai solutions and emerging technologies in the healthcare ecosystem. 2023
2023
-
[13]
Big data: Structured and unstructured
Arun K Majumdar, John F Sowa, and J Liebowitz. Big data: Structured and unstructured. Big data and business analytics, pages 249--268, 2013
2013
-
[14]
A survey on bias and fairness in machine learning
Ninareh Mehrabi, Fred Morstatter, Nripsuta Saxena, Kristina Lerman, and Aram Galstyan. A survey on bias and fairness in machine learning. ACM Computing Surveys (CSUR), 54 0 (6): 0 1--35, 2021
2021
-
[15]
Bias and unfairness in machine learning models: A systematic review on datasets, tools, fairness metrics, and identification and mitigation methods
Tiago P Pagano, Rafael B Loureiro, Fernanda VN Lisboa, Rodrigo M Peixoto, Guilherme AS Guimar \ a es, Gustavo OR Cruz, Maira M Araujo, Lucas L Santos, Marco AS Cruz, Ewerton LS Oliveira, et al. Bias and unfairness in machine learning models: A systematic review on datasets, to...
2023
-
[16]
Pytorch: An imperative style, high-performance deep learning library
Adam Paszke, Sam Gross, Francisco Massa, Adam Lerer, James Bradbury, Gregory Chanan, Trevor Killeen, Zeming Lin, Natalia Gimelshein, Luca Antiga, Alban Desmaison, Andreas Kopf, Edward Yang, Zachary DeVito, Martin Raison, Alykhan Tejani, Sasank Chilamkurthy, Benoit Steiner, Lu ...
2019
-
[17]
Pedregosa, G
F. Pedregosa, G. Varoquaux, A. Gramfort, V. Michel, B. Thirion, O. Grisel, M. Blondel, P. Prettenhofer, R. Weiss, V. Dubourg, J. Vanderplas, A. Passos, D. Cournapeau, M. Brucher, M. Perrot, and E. Duchesnay. Scikit-learn: Machine learning in P ython. Journal of Machine Learnin...
2011
-
[18]
Learning from noisy data
J Ross Quinlan. Learning from noisy data. In Proc. 1983 Int. Machine Learning Workshop, pages 58--64, 1983
1983
-
[19]
Ross Quinlan
J. Ross Quinlan. Induction of decision trees. Machine learning, 1: 0 81--106, 1986
1986
-
[20]
What is the value of data? on mathematical methods for data quality estimation
Netanel Raviv, Siddharth Jain, and Jehoshua Bruck. What is the value of data? on mathematical methods for data quality estimation. In 2020 IEEE International Symposium on Information Theory (ISIT), pages 2825--2830. IEEE, 2020
2020
-
[21]
Understanding machine learning: From theory to algorithms
Shai Shalev-Shwartz and Shai Ben-David. Understanding machine learning: From theory to algorithms. Cambridge university press, 2014
2014
-
[22]
A mathematical theory of communication
Claude Elwood Shannon. A mathematical theory of communication. The Bell system technical journal, 27 0 (3): 0 379--423, 1948
1948
-
[23]
Efficient monte carlo procedures for generating points uniformly distributed over bounded regions
Robert L Smith. Efficient monte carlo procedures for generating points uniformly distributed over bounded regions. Operations Research, 32 0 (6): 0 1296--1308, 1984
1984
-
[24]
Evaluation of uncertainty quantification in deep learning
Niclas St hl, G \"o ran Falkman, Alexander Karlsson, and Gunnar Mathiason. Evaluation of uncertainty quantification in deep learning. In International Conference on Information Processing and Management of Uncertainty in Knowledge-Based Systems, pages 556--568. Springer, 2020
2020
-
[25]
Trust and artificial intelligence
Brian Stanton, Theodore Jensen, et al. Trust and artificial intelligence. preprint, 2021
2021
-
[26]
Diameter-based active learning
Christopher Tosh and Sanjoy Dasgupta. Diameter-based active learning. In International Conference on Machine Learning, pages 3444--3452. PMLR, 2017
2017
-
[27]
Rethinking statistical learning theory: learning using statistical invariants
Vladimir Vapnik and Rauf Izmailov. Rethinking statistical learning theory: learning using statistical invariants. Machine Learning, 108 0 (3): 0 381--423, 2019
2019
-
[28]
A framework for analysis of data quality research
Richard Y Wang, Veda C Storey, and Christopher P Firth. A framework for analysis of data quality research. IEEE transactions on knowledge and data engineering, 7 0 (4): 0 623--640, 1995
1995
-
[29]
Data collection and quality challenges in deep learning: A data-centric ai perspective
Steven Euijong Whang, Yuji Roh, Hwanjun Song, and Jae-Gil Lee. Data collection and quality challenges in deep learning: A data-centric ai perspective. The VLDB Journal, 32 0 (4): 0 791--813, 2023
2023
-
[30]
How much can we really trust you? towards simple, interpretable trust quantification metrics for deep neural networks
Alexander Wong, Xiao Yu Wang, and Andrew Hryniowski. How much can we really trust you? towards simple, interpretable trust quantification metrics for deep neural networks. arXiv preprint arXiv:2009.05835, 2020
2009 arXiv
-
[31]
Current time series anomaly detection benchmarks are flawed and are creating the illusion of progress
Renjie Wu and Eamonn Keogh. Current time series anomaly detection benchmarks are flawed and are creating the illusion of progress. IEEE Transactions on Knowledge and Data Engineering, 2021
2021
-
[32]
Data-centric ai: Perspectives and challenges
Daochen Zha, Zaid Pervaiz Bhat, Kwei-Herng Lai, Fan Yang, and Xia Hu. Data-centric ai: Perspectives and challenges. In Proceedings of the 2023 SIAM International Conference on Data Mining (SDM), pages 945--948. SIAM, 2023 a
2023
-
[33]
Data-centric artificial intelligence: A survey
Daochen Zha, Zaid Pervaiz Bhat, Kwei-Herng Lai, Fan Yang, Zhimeng Jiang, Shaochen Zhong, and Xia Hu. Data-centric artificial intelligence: A survey. arXiv preprint arXiv:2303.10158, 2023 b
2023 arXiv
-
[34]
Class noise vs
Xingquan Zhu and Xindong Wu. Class noise vs. attribute noise: A quantitative study. Artificial intelligence review, 22: 0 177--210, 2004
2004
Reviewed August 11, 2026 · model on record in the stance chip above.
Discussion (0). Continue with ORCID to comment.