REVIEW 3 minor 4 cited by
Health-Informed Computing: Estimating and Addressing the Public Health Impact of Data Centers
T0 review · 0 major / 3 minor · reviewed 2026-05-23 · grok-4.3
Pith's one-line read Growing AI demand will drive U.S. data center air pollution health costs above $20 billion per year by 2028.
desk verdict The paper puts a dollar figure on public health costs from data center air pollution and gives a framework to fold those costs into computing decisions. read the letter →
The pith
A machine-rendered reading of the paper's core claim, the machinery that carries it, and where it could break.
The reading
What carries the argument
A methodology that links data center electricity consumption to power-plant emission factors, then monetizes the resulting criteria air pollutant health damages, paired with a health-informed computing framework that adds those damages to data center scheduling and placement decisions.
What would settle it
Independent county-level air quality or health outcome data collected before and after major data center expansions or shutdowns that either matches or deviates from the model's per-household cost predictions would confirm or refute the estimates.
Extended reading notes
Core claim
The paper claims that criteria air pollutant emissions tied to U.S. data center electricity use generate public health burdens projected to exceed $20 billion annually by 2028 under continued AI growth, with sharp geographic disparities that place some counties under per-household loads seven times the national average, and shows that a health-informed computing framework can reduce those burdens by guiding resource allocation across space and time.
Load-bearing premise
The calculations rest on emission factors, grid mix assumptions, and health damage valuations whose accuracy is not fully validated in the presented work.
Editorial extensions
If this is right
- National public health costs from data centers will scale directly with AI and computing demand growth.
- Health burdens will remain geographically concentrated, producing local impacts several times the national average in the hardest-hit counties.
- Resource management that explicitly includes health costs can lower total damages while preserving sustainability targets.
- Energy disclosure rules should expand to report public health impacts alongside carbon metrics.
- Management and policy attention must extend to every community affected by the associated emissions.
Reading between the lines
- The uneven distribution could prompt regulators to require health impact assessments before approving new data center sites.
- The management framework might be tested first in high-burden regions to measure actual reductions in modeled health costs.
- Similar emission-to-health-cost modeling could be applied to other large, flexible electricity loads such as cryptocurrency mining or hydrogen production.
- If the projections hold, they supply a quantitative basis for communities to negotiate mitigation payments or renewable energy requirements from data center operators.
Editorial analysis
A structured set of objections, weighed in public.
Referee Report
Summary. The manuscript develops a methodology to estimate criteria air pollutant emissions from U.S. data centers driven by AI demand, translates these into monetized public health damages using location-specific grid mixes and exposure models, and projects an annual national burden exceeding $20 billion by 2028. It documents spatial heterogeneity (with some counties experiencing per-household burdens up to seven times the national average), proposes a health-informed computing framework for spatiotemporal resource allocation that internalizes these externalities, and recommends expanded energy reporting that includes public health metrics.
Significance. If the electricity-demand projections, emission factors, grid-mix assumptions, and health-damage valuations hold under scrutiny, the work supplies a concrete, spatially resolved quantification of an externality that has been largely absent from data-center sustainability assessments. The health-informed framework offers a practical mechanism for operators to trade off compute performance against public-health costs, and the call for extended reporting could influence both policy and industry standards.
minor comments (3)
- The abstract omits any mention of the underlying models, data sources, or validation steps; expanding it by one or two sentences to summarize the methodology would improve accessibility without altering length constraints.
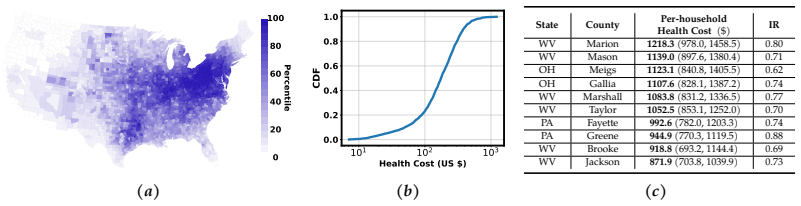
- Figure captions and axis labels in the spatial-disaggregation maps (e.g., county-level burden choropleths) would benefit from explicit units and a note on the base year for the $20B projection.
- A short table listing the primary data sources (EIA, EPA emission factors, health-cost valuations) and their vintages would aid reproducibility.
Simulated Author's Rebuttal
We thank the referee for their positive assessment of the manuscript, accurate summary of its contributions, and recommendation for minor revision. The work quantifies the public health externality of data center emissions under AI-driven demand growth and introduces a framework to internalize those costs in resource allocation.
Circularity Check
No significant circularity in derivation chain
full rationale
The paper's central projection ($20B health burden in 2028) is constructed from external inputs: electricity-demand forecasts, location-specific grid mixes, pollutant emission factors, exposure models, and monetized health damage valuations. These are described as drawn from independent data sources and standard modeling practices rather than fitted to the target output or defined in terms of the result itself. No equations reduce the prediction to its own inputs by construction, no load-bearing self-citations are invoked to justify uniqueness or ansatzes, and the health-informed framework is presented as an application of the independently derived impacts. The derivation chain remains self-contained against external benchmarks.
Assumptions & free parameters
Cite this review
Pith. "Pith review of Health-Informed Computing: Estimating and Addressing the Public Health Impact of Data Centers." pith.science (2026). https://pith.science/paper/ZJQE6ACA
@misc{pith2026241206288,
  author       = {Pith},
  title        = {Pith review of: Health-Informed Computing: Estimating and Addressing the Public Health Impact of Data Centers},
  year         = {2026},
  howpublished = {\url{https://pith.science/paper/ZJQE6ACA}},
  note         = {Machine review of arXiv:2412.06288}
}
abstract
The surging demand for artificial intelligence (AI) has led to a rapid expansion of energy-intensive data centers, contributing to criteria air pollutant emissions and raising public health concerns that have received comparatively limited attention in sustainability assessments. This paper introduces a principled methodology to model air pollutant emissions for data centers and estimate the public health impacts. Our findings reveal that the growing demand for AI and computing technologies is projected to push the total annual public health burden of U.S. data centers up to more than $20 billion in 2028. Although national-level impacts remain modest, data center health costs are unevenly distributed: in the most affected counties, the estimated per-household health burden can reach about seven times the national average. Next, we propose a health-informed computing framework that explicitly incorporates public health impacts into data center resource management across space and time, mitigating public health costs while supporting environmental sustainability. More broadly, we recommend extended energy reporting to include public health impact of data centers and paying attention to all impacted communities.
Figures


Figures from the paper (7 more)



Forward citations
Cited by 4 Pith papers
-
CarbonFlex: Enabling Carbon-aware Provisioning and Scheduling for Cloud Clusters
A learning-based cluster scheduler that jointly provisions capacity and elastically scales batch jobs to cut operational carbon by up to 57.5% in AWS tests.
-
Misinformation by Omission: The Need for More Environmental Transparency in AI
Environmental disclosure for notable AI models peaked in 2022 and then declined, and out-of-context energy and emissions estimates now dominate media coverage.
-
The Cloud Next Door: Investigating the Environmental and Socioeconomic Strain of Datacenters on Local Communities
A preliminary mixed-methods case study argues that datacenters impose localized noise, power-quality, and economic burdens on neighboring communities and offers an equal-weight qualitative and quantitative framework f...
-
AI Data Centers and the Water Use Feedback Loop
The paper formalizes the Water and AI Feedback Loop, introduces the Water Consumption Impact index, and shows water burden from AI data centers varies from 0.2% to 134% of local capacity across ten US sites.
Reviewed May 23, 2026 · model on record in the stance chip above.
Discussion (0). Continue with ORCID to comment.