REVIEW 3 major objections 6 minor 1 cited by
The Sloan Digital Sky Survey Reverberation Mapping Project: Insights on Maximizing Efficiency in Lag Measurements and Black-Hole Masses
T0 review · 3 major / 6 minor · reviewed 2026-08-11 · deepseek-v4-flash
Pith's one-line read The Durbin-Watson statistic on emission-line light curves is the strongest predictor of reliable reverberation lags, and cutting the first-year SDSS-RM cadence by 40% retains about 90% of significant detections.
desk verdict Competent RM survey-design study with a truthful core, but the abstract's 90% retention is the significance-only number and the gold-sample conditioning makes it optimistic, not conservative. read the letter →
The pith
A machine-rendered reading of the paper's core claim, the machinery that carries it, and where it could break.
The reading
What carries the argument
The Durbin-Watson statistic, $\mathrm{dw} = \sum_{t=2}^{T}(e_t - e_{t-1})^2 / \sum_{t=1}^{T} e_t^2 \approx 2 - 2r$ for residuals $e_t$ and first-order autocorrelation $r$, is the central object. Computed on the emission-line light curve, a value below about 1 flags the positively autocorrelated 'hook' feature that reverberation-mapping codes such as PyROA need to lock onto a time delay. The paper couples this screen with logistic regression to rank predictors and with a cadence-thinning experiment that removes first-year epochs at random 50 times per target, keeps the densely sampled photometric continuum unchanged, and re-fits the line lags with PyROA.
What would settle it
Apply the same 40% first-year cadence thinning to the full SDSS-RM parent sample rather than the gold sample and compare the fraction of still-significant lags; if the retention rate falls well below 90%, the result is specific to the cleanest detections.
Extended reading notes
Core claim
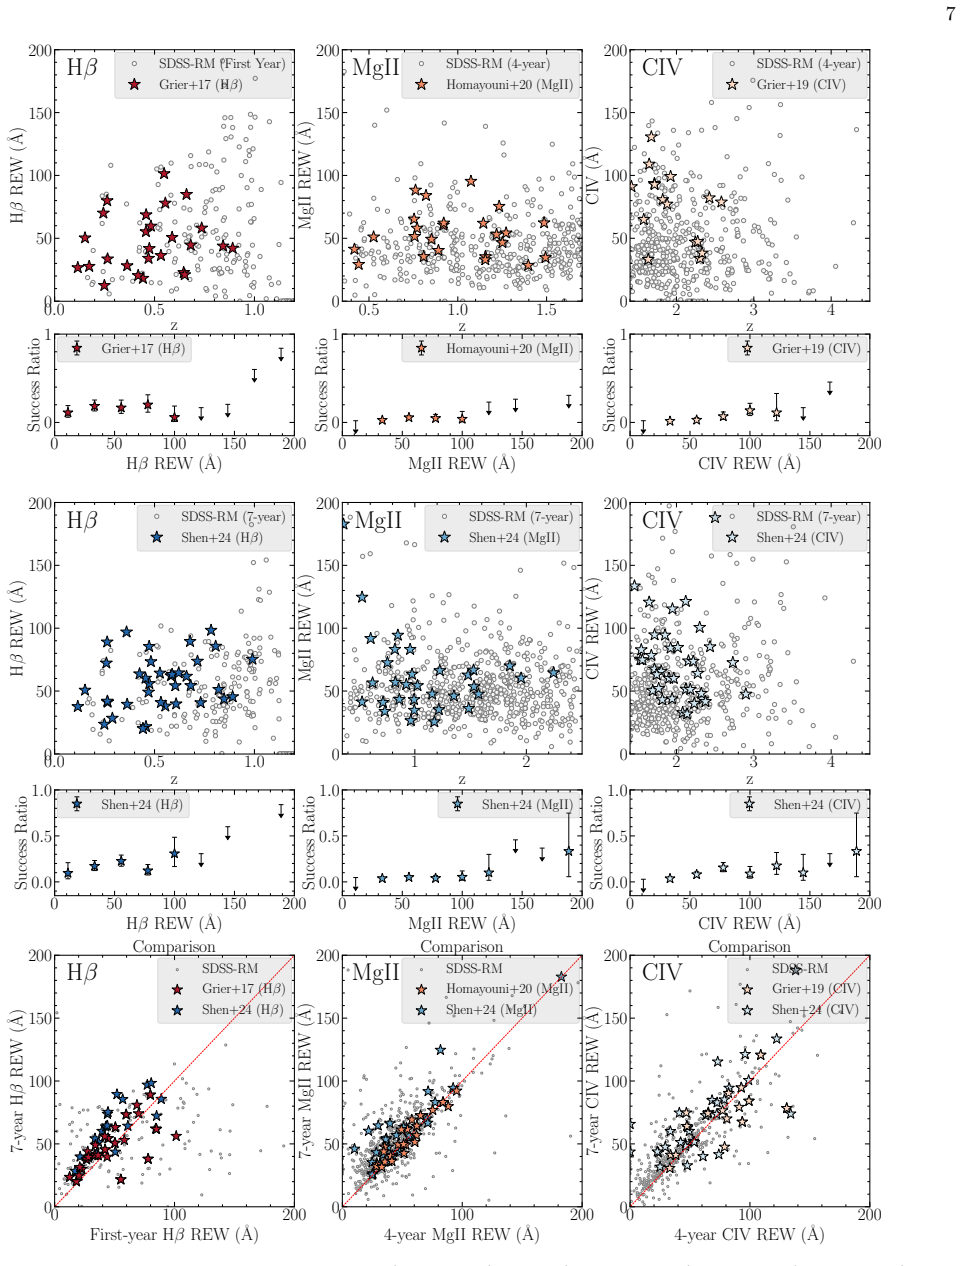
The paper's central claim is that the Durbin-Watson statistic of the emission-line light curve, rather than the continuum, is the most consistent predictor of a gold-standard lag measurement. Across the six SDSS-RM datasets, logistic regression names the line dw statistic as the strongest predictor for the first-year and seven-year Hβ results and for the CIV results, and as the single robust predictor for the seven-year MgII results; the early four-year MgII dataset is the outlier, where only luminosity shows marginal predictive power. A dw value below about 1 flags positive first-order autocorrelation in the line light curve — a "hook" or inflection feature that lag-fitting algorithms need. The paper also claims that thinning the first-year SDSS-RM cadence from 32 epochs to about 13 (a 40% cut), with uniform sampling afterward, keeps 94% of Hβ, 88% of MgII, and 90% of CIV significant lag detections across 50 random thinnings per target; requiring the simulated lag to agree with the original within 1σ lowers the recovery to 81%, 76%, and 86%. Recovery is somewhat worse for faint, high-redshift quasars, so the authors recommend a modest uniform cadence of about 1.5 weeks for general-purpose surveys while noting that denser sampling is still needed at the faint end.
Load-bearing premise
The cadence-thinning test is run on the gold sample, the easiest lags to detect, so the ~90% retention rate is likely optimistic for the full population of recoverable lags.
Editorial extensions
If this is right
- Surveys can pre-screen targets with the line-light-curve dw statistic before running expensive lag analysis, focusing effort on quasars with a high chance of a gold-quality measurement.
- A front-loaded cadence (very dense first year) buys little over a uniform ~1.5-week cadence once multi-year baselines are available; future programs can redistribute epochs more evenly.
- The dw<1 threshold generalizes across Hβ, MgII, and CIV, so it can serve as a universal screening metric across the redshift range of industrial-scale RM programs.
- Faint and high-redshift quasars need denser sampling than the 40%-reduced cadence provides, so surveys targeting the distant quasar population should not adopt the uniform sparse cadence.
- The negative luminosity correlation in the logistic regression implies that longer-lag, brighter quasars are being cut off by survey baselines, so baseline length, not target quality, is the limiting factor for those sources.
Reading between the lines
- The dw screen could be run in real time as data accumulate, letting a survey re-allocate spectroscopic epochs mid-season to targets whose line light curves are developing the 'hook' the statistic detects; this adaptive strategy is a natural extension the paper does not test.
- Because the gold sample is selected by visual inspection for clean, well-behaved light curves, the 90% retention after cadence thinning is probably an optimistic bound for the full lag population; the paper calls the simulation conservative, but the selection of easy detections works in the opposite direction.
- The same dw approach could be applied to continuum reverberation mapping (accretion-disk lags) once a sufficient sample of continuum lags exists, since the logic of needing an inflection in the driving light curve carries over directly.
- Combining the dw screen with a baseline-length correction for luminosity would likely sharpen target selection: the paper's luminosity dependence may be an artifact of longer lags in brighter quasars rather than an intrinsic property of those sources.
Editorial analysis
A structured set of objections, weighed in public.
Referee Report
Summary. The paper analyzes 172 high-confidence ("gold") reverberation-mapping lag measurements from SDSS-RM, drawn from six published studies, to identify which target and light-curve properties predict successful lag detection. The main predictors examined are continuum luminosity, equivalent width, fractional rms variability, the variability signal-to-noise ratio SNR2, and the Durbin-Watson statistic of the continuum and emission-line light curves. The paper reports that the emission-line Durbin-Watson statistic is the most significant predictor of gold-lag status, with SNR2 and the placement of H-beta on the spectrograph also playing a role. The second half of the paper simulates a 40% reduction in the first-year spectroscopic cadence (from 32 to about 13 epochs) while keeping continuum sampling fixed, and reports that roughly 90% of simulated lags remain statistically significant, with 81% (H-beta), 76% (MgII), and 86% (CIV) remaining both significant and consistent with the original lag within 1 sigma. The paper concludes that a modest reduction in first-year cadence has minimal effect on overall lag recovery if later-year sampling is uniform, providing guidance for future RM surveys.
Significance. The practical question addressed here is valuable: future industrial-scale RM programs need quantitative guidance on cadence allocation, and this paper uses actual multi-year SDSS-RM light curves rather than only synthetic light curves. The comparison across early-year and 7-year RM studies is a useful resource, and the paper is transparent in reporting both significance-only retention and the stricter consistency-within-1-sigma retention. If the Durbin-Watson result is robust to selection effects, it would provide a cheap and effective pre-screening statistic for RM target selection. The cadence-simulation results, if recast with proper conditioning, would inform observing-strategy decisions for programs such as 4MOST TiDES. However, the headline claims are currently overstated: the abstract's "approximately 90%" refers to significance-only survival, and the paper's own stricter criterion gives lower rates; moreover, both the Durbin-Watson predictor and the cadence-retention estimate are conditioned on the gold sample, whose selection plausibly inflates the reported numbers.
major comments (3)
- [Sections 3.3 and 5.3-5.4] The claim that the emission-line Durbin-Watson statistic is the strongest predictor of gold-lag status is at risk of selection confounding. The gold sample in Section 3.3 was defined by visual inspection of light curves and lag PDFs, requiring unimodal lag PDFs, good model fits, and consistency across methods. These criteria plausibly select light curves that are smooth and positively autocorrelated, i.e., those with low dw. The logistic regression in Section 5.4 therefore may be partly restating the gold-selection criterion rather than discovering an independent predictor. To support the claim, the authors should test the predictive value of dw on a sample that did not define "gold", for example non-gold lags that nonetheless pass the statistical significance criteria, or on simulated light curves with known input lags. As written, the p-values reported in Section 5.4 do not address this concern.
- [Section 6.2, Figures 8 and 9] The cadence-thinning experiment conditions on the gold sample from Shen et al. (2024), which was identified under the dense first-year cadence that the simulation thins. The reported survival fractions therefore estimate P(survive | gold under the original dense cadence), not P(recover | would-be gold under a sparse design). Because the gold-selection process preferentially kept the cleanest, most robust detections, the approximately 90% retention is an optimistic bound for the general population of recoverable lags, not the conservative bound claimed in the Figure 9 caption. The paper should repeat the thinning on the full sample of statistically significant lags (including non-gold ones) or on a simulated population with known lags, and report target-level recovery fractions. In addition, Nsig is computed over 50 simulations per target, so the quoted percentage is a simulation-level average; uncertainties should account for clustering by quasar.
- [Abstract and Section 7] The abstract states that a cadence reduction to about 1.5 weeks can "retain approximately 90% of the lag measurements", but the paper's own stricter criterion, which requires the simulated lag to be consistent with the original lag within 1 sigma, yields 81% for H-beta, 76% for MgII, and 86% for CIV (Section 6.2, Figure 8). The abstract should either use the stricter numbers or explicitly state that the 90% figure refers only to statistical significance, since the distinction is central to the survey-design recommendation.
minor comments (6)
- [Section 5.2] The definition of SNR2 is written as "SNR2 = p χ2 − DOF", which is unclear; it should be rendered as SNR2 = sqrt(χ2 − DOF), with DOF explicitly defined as N-1 and χ2 computed against the mean flux.
- [Section 5.3, Eq. (1)] The Durbin-Watson statistic is defined for residuals et, but the text does not specify which model the residuals come from (e.g., residuals relative to the weighted mean, or residuals from a linear trend). The reader should know exactly how dw was computed from the PrepSpec light curves.
- [Section 7] The summary statement that the impact of emission-line position on detection is less strong for Mg II and C IV "(Figure 4)" appears to reference the wrong figure; the relevant figure is Figure 3. Figure 4 shows fractional rms variability.
- [Table 3] The column heading "SNR2 Con." is undefined; it should be spelled out as "Continuum SNR2" and defined in the caption.
- [Section 5.4] The logistic regression is described only briefly; the authors should state whether predictors were standardized, how p-values were obtained, and whether any multiple-testing correction was applied across the six models.
- [Section 6.1] The text uses both "reduce the density ... to 40%" and "by 40%" to describe the same operation; these should be made consistent, since they are arithmetically opposite descriptions of the retained epoch count.
Circularity Check
No significant circularity: the paper's main claims are empirical post-hoc analyses and conditional simulations, not definitional reductions.
full rationale
The paper's central claims are (1) that the Durbin-Watson (dw) statistic computed on emission-line light curves is the strongest predictor of gold-standard lag membership, and (2) that reducing the first-year SDSS-RM cadence by 40% retains ~90% of gold lags. Neither claim reduces to its inputs by construction. The gold sample (Section 3.3) is defined by visual inspection, unimodal lag PDFs, consistency across methods, and good model fits; dw is not among the selection criteria. Therefore, the logistic regression in Section 5.4 is an independent empirical test, not a tautology. The cadence simulation (Section 6.2) conditions on the gold sample and estimates the conditional retention fraction P(survive | gold under dense cadence), which is exactly the quantity needed for survey design when comparing sparse to dense cadence. It does not claim to estimate the absolute detection rate in a new survey, so there is no fitted parameter renamed as a prediction. The paper does not invoke any uniqueness theorem or ansatz from prior work as load-bearing justification; it uses the Shen et al. (2024) gold sample as data, and the overlap of authors with that work is normal scientific practice, not circularity. The Figure 9 caption states the simulation results 'may be conservative' because they are based on the gold sample; this is arguably a misstatement (gold lags are likely the easiest to retain, so the retention rate may be optimistic), but a directional-bias concern is a correctness issue, not a logical circularity. No equation equates the output to the input by definition. The paper is self-contained against external benchmarks and does not smuggle in its conclusion through self-citation.
Assumptions & free parameters
free parameters (2)
- Logistic regression coefficients (six models) =
not reported
- Durbin-Watson threshold dw < 1 =
1
assumptions (5)
- domain assumption The gold-sample labels from Grier et al. 2017, Grier et al. 2019, Homayouni et al. 2020, and Shen et al. 2024 are reliable ground-truth detections.
- domain assumption PyROA's stochastic-process model and the adopted significance criteria (rmax > 0.4, |S/N| > 2, alias-removal fpeak criterion) correctly identify physical lags.
- domain assumption The 2015-2017 epoch-interval distribution is a valid prior for simulating weather loss in the first year.
- standard math Observations are independent across quasars for the logistic regression.
- standard math Durbin-Watson test validity: the residuals used in the dw statistic are first-order autoregressive under the null after fitting.
Cite this review
Pith. "Pith review of The Sloan Digital Sky Survey Reverberation Mapping Project: Insights on Maximizing Efficiency in Lag Measurements and Black-Hole Masses." pith.science (2026). https://pith.science/paper/ARKULL2J
@misc{pith2026241206885,
  author       = {Pith},
  title        = {Pith review of: The Sloan Digital Sky Survey Reverberation Mapping Project: Insights on Maximizing Efficiency in Lag Measurements and Black-Hole Masses},
  year         = {2026},
  howpublished = {\url{https://pith.science/paper/ARKULL2J}},
  note         = {Machine review of arXiv:2412.06885}
}
abstract
Multi-year observations from the Sloan Digital Sky Survey Reverberation Mapping (SDSS-RM) project have significantly increased the number of quasars with reliable reverberation-mapping lag measurements. We statistically analyze target properties, light-curve characteristics, and survey design choices to identify factors crucial for successful and efficient RM surveys. Analyzing 172 high-confidence ("gold") lag measurements from SDSS-RM for the H$\beta$, MgII, and CIV emission lines, we find that the Durbin-Watson statistic (a statistical test for residual correlation) is the most significant predictor of light curves suitable for lag detection. Variability signal-to-noise ratio and emission-line placement on the detector also correlate with successful lag measurements. We further investigate the impact of observing cadence on survey design by analyzing the effect of reducing observations in the first year of SDSS-RM. Our results demonstrate that a modest reduction in observing cadence to $\sim$1.5 weeks between observations can retain approximately 90% of the lag measurements compared to twice-weekly observations in the initial year. Provided similar and uniform sampling in subsequent years, this adjustment has a minimal effect on the overall recovery of lags across all emission lines. These results provide valuable inputs for optimizing future RM surveys.
Figures


Figures from the paper (6 more)


Forward citations
Cited by 1 Pith paper
-
AGN Reverberation Mapping with LITMUS: Fundamental Limits on lag Recovery Rates
A Bayesian re-analysis of 906 OzDES AGN finds that previous reverberation lags, especially for MgII and CIV, are often false positives, with only 3-28% of MgII sources showing simple lags.
Reference graph
Works this paper leans on
-
[1]
Bao, D.-W., Brotherton, M. S., Du, P., et al. 2022, arXiv e-prints, arXiv:2207.00297. https://arxiv.org/abs/2207.00297
work page Pith review arXiv 2022
-
[2]
Barth, A. J., Nguyen, M. L., Malkan, M. A., et al. 2011, ApJ, 732, 121, doi: 10.1088/0004-637X/732/2/121
-
[3]
Barth, A. J., Bennert, V. N., Canalizo, G., et al. 2015, ApJS, 217, 26, doi: 10.1088/0067-0049/217/2/26
-
[4]
Bellm, E. C., Kulkarni, S. R., Graham, M. J., et al. 2019, PASP, 131, 018002, doi: 10.1088/1538-3873/aaecbe
-
[5]
Bentz, M. C., & Katz, S. 2015, Publications of the Astronomical Society of the Pacific, 127, 67, doi: 10.1086/679601
doi:10.1086/679601 2015
-
[6]
Bentz, M. C., Williams, P. R., Street, R., et al. 2021, ApJ, 920, 112, doi: 10.3847/1538-4357/ac19af 22
-
[7]
Bentz, M. C., Walsh, J. L., Barth, A. J., et al. 2008, ApJL, 689, L21, doi: 10.1086/595719 —. 2009, ApJ, 705, 199, doi: 10.1088/0004-637X/705/1/199
doi:10.1086/595719 2008
-
[8]
Bentz, M. C., Horne, K., Barth, A. J., et al. 2010, ApJL, 720, L46, doi: 10.1088/2041-8205/720/1/L46
Show all 72 references
-
[9]
C., Denney, K
Bentz, M. C., Denney, K. D., Grier, C. J., et al. 2013, ApJ, 767, 149, doi: 10.1088/0004-637X/767/2/149
2013 doi
- [10]
-
[11]
R., Bershady, M
Blanton, M. R., Bershady, M. A., Abolfathi, B., et al. 2017, AJ, 154, 28, doi: 10.3847/1538-3881/aa7567
2017 doi
-
[12]
M., Bentz, M
Cackett, E. M., Bentz, M. C., & Kara, E. 2021, iScience, 24, 102557, doi: 10.1016/j.isci.2021.102557
2021
-
[13]
A., Alloin, D., et al
Clavel, J., Reichert, G. A., Alloin, D., et al. 1991, ApJ, 366, 64, doi: 10.1086/169540
1991 doi
-
[14]
M., Peterson, B
Collier, S., Crenshaw, D. M., Peterson, B. M., et al. 2001, ApJ, 561, 146, doi: 10.1086/323234
2001 doi
-
[15]
J., Horne, K., Kaspi, S., et al
Collier, S. J., Horne, K., Kaspi, S., et al. 1998, ApJ, 500, 162, doi: 10.1086/305720 Dalla Bont` a, E., Peterson, B. M., Bentz, M. C., et al. 2020, ApJ, 903, 112, doi: 10.3847/1538-4357/abbc1c de Jong, R. S., Agertz, O., Berbel, A. A., et al. 2019, The Messenger, 175, 3, doi:...
1998 doi
-
[16]
D., Horne, K., Brandt, W
Denney, K. D., Horne, K., Brandt, W. N., et al. 2016a, ApJ, 833, 33, doi: 10.3847/1538-4357/833/1/33
-
[17]
D., Peterson, B
Denney, K. D., Peterson, B. M., Pogge, R. W., et al. 2010, ApJ, 721, 715, doi: 10.1088/0004-637X/721/1/715
2010 doi
-
[18]
D., Horne, K., Shen, Y., et al
Denney, K. D., Horne, K., Shen, Y., et al. 2016b, ApJS, 224, 14, doi: 10.3847/0067-0049/224/2/14
-
[19]
2019, arXiv e-prints, arXiv:1906.10138
Dexter, J., Xin, S., Shen, Y., et al. 2019, arXiv e-prints, arXiv:1906.10138. https://arxiv.org/abs/1906.10138
2019 arXiv
-
[20]
R., Horne, K., & Hern´ andez Santisteban, J
Donnan, F. R., Horne, K., & Hern´ andez Santisteban, J. V. 2021, MNRAS, 508, 5449, doi: 10.1093/mnras/stab2832
2021 doi
-
[21]
2014, ApJ, 782, 45, doi: 10.1088/0004-637X/782/1/45
Du, P., Hu, C., Lu, K.-X., et al. 2014, ApJ, 782, 45, doi: 10.1088/0004-637X/782/1/45
2014 doi
-
[22]
2016a, ApJ, 825, 126, doi: 10.3847/0004-637X/825/2/126
Du, P., Lu, K.-X., Zhang, Z.-X., et al. 2016a, ApJ, 825, 126, doi: 10.3847/0004-637X/825/2/126
-
[23]
2016b, ApJ, 820, 27, doi: 10.3847/0004-637X/820/1/27
Du, P., Lu, K.-X., Hu, C., et al. 2016b, ApJ, 820, 27, doi: 10.3847/0004-637X/820/1/27
-
[24]
J., Weinberg, D
Eisenstein, D. J., Weinberg, D. H., Agol, E., et al. 2011, AJ, 142, 72, doi: 10.1088/0004-6256/142/3/72 Fonseca Alvarez, G., Trump, J. R., Homayouni, Y., et al. 2019, arXiv e-prints, arXiv:1910.10719. https://arxiv.org/abs/1910.10719
2011 arXiv
-
[25]
B., Trump, J
Fries, L. B., Trump, J. R., Davis, M. C., et al. 2023, ApJ, 948, 5, doi: 10.3847/1538-4357/acbfb7
2023 doi
-
[26]
E., et al
Fukugita, M., Ichikawa, T., Gunn, J. E., et al. 1996, AJ, 111, 1748, doi: 10.1086/117915
1996 doi
- [27]
- [28]
-
[29]
1986, ApJ, 303, 336, doi: 10.1086/164079 GRA VITY Collaboration, Sturm, E., Dexter, J., et al
Gehrels, N. 1986, ApJ, 303, 336, doi: 10.1086/164079 GRA VITY Collaboration, Sturm, E., Dexter, J., et al. 2018, Nature, 563, 657, doi: 10.1038/s41586-018-0731-9 GRA VITY Collaboration, Amorim, A., Baub¨ ock, M., et al. 2020, A&A, 643, A154, doi: 10.1051/0004-6361/202039067 GR...
-
[30]
J., Peterson, B
Grier, C. J., Peterson, B. M., Pogge, R. W., et al. 2012, ApJ, 755, 60, doi: 10.1088/0004-637X/755/1/60
2012 doi
-
[31]
J., Peterson, B
Grier, C. J., Peterson, B. M., Horne, K., et al. 2013, ApJ, 764, 47, doi: 10.1088/0004-637X/764/1/47
2013 doi
-
[32]
J., Brandt, W
Grier, C. J., Brandt, W. N., Hall, P. B., et al. 2016, ApJ, 824, 130, doi: 10.3847/0004-637X/824/2/130
2016 doi
-
[33]
J., Trump, J
Grier, C. J., Trump, J. R., Shen, Y., et al. 2017, ApJ, 851, 21, doi: 10.3847/1538-4357/aa98dc
2017 doi
-
[34]
J., Shen, Y., Horne, K., et al
Grier, C. J., Shen, Y., Horne, K., et al. 2019, ApJ, 887, 38, doi: 10.3847/1538-4357/ab4ea5
2019 doi
-
[35]
E., Siegmund, W
Gunn, J. E., Siegmund, W. A., Mannery, E. J., et al. 2006, AJ, 131, 2332, doi: 10.1086/500975
2006 doi
-
[36]
S., Grier, C
Hemler, Z. S., Grier, C. J., Brandt, W. N., et al. 2019, ApJ, 872, 21, doi: 10.3847/1538-4357/aaf1bf
2019 doi
-
[37]
R., Grier, C
Homayouni, Y., Trump, J. R., Grier, C. J., et al. 2019, ApJ, 880, 126, doi: 10.3847/1538-4357/ab2638 —. 2020, ApJ, 901, 55, doi: 10.3847/1538-4357/ababa9
2019 doi
-
[38]
2023, ApJ, 948, 85, doi: 10.3847/1538-4357/acc45a
Homayouni, Y., De Rosa, G., Plesha, R., et al. 2023, ApJ, 948, 85, doi: 10.3847/1538-4357/acc45a
2023 doi
-
[39]
M., et al
Horne, K., De Rosa, G., Peterson, B. M., et al. 2021, ApJ, 907, 76, doi: 10.3847/1538-4357/abce60
2021 doi
-
[40]
2015, ApJ, 804, 138, doi: 10.1088/0004-637X/804/2/138 Ivezi´ c,ˇZ., Kahn, S
Hu, C., Du, P., Lu, K.-X., et al. 2015, ApJ, 804, 138, doi: 10.1088/0004-637X/804/2/138 Ivezi´ c,ˇZ., Kahn, S. M., Tyson, J. A., et al. 2019, ApJ, 873, 111, doi: 10.3847/1538-4357/ab042c
2015 doi
-
[41]
2010, in Society of Photo-Optical Instrumentation Engineers (SPIE) Conference Series, Vol
Kaiser, N., Burgett, W., Chambers, K., et al. 2010, in Society of Photo-Optical Instrumentation Engineers (SPIE) Conference Series, Vol. 7733, Ground-based and Airborne Telescopes III, ed. L. M. Stepp, R. Gilmozzi, & H. J. Hall, 77330E, doi: 10.1117/12.859188
2010 doi
-
[42]
N., Maoz, D., et al
Kaspi, S., Brandt, W. N., Maoz, D., et al. 2007, ApJ, 659, 997, doi: 10.1086/512094
2007 doi
-
[43]
S., Netzer, H., et al
Kaspi, S., Smith, P. S., Netzer, H., et al. 2000, ApJ, 533, 631, doi: 10.1086/308704 23
2000 doi
-
[44]
C., Bechtold, J., & Siemiginowska, A
Kelly, B. C., Bechtold, J., & Siemiginowska, A. 2009, ApJ, 698, 895, doi: 10.1088/0004-637X/698/1/895
2009 doi
-
[45]
B., McGreer, I., et al
Kinemuchi, K., Hall, P. B., McGreer, I., et al. 2020, ApJS, 250, 10, doi: 10.3847/1538-4365/aba43f
2020 doi
-
[46]
L., Martini, P., Davis, T
King, A. L., Martini, P., Davis, T. M., et al. 2015, MNRAS, 453, 1701, doi: 10.1093/mnras/stv1718
2015 doi
-
[47]
Kormendy, J., & Ho, L. C. 2013, arXiv e-prints, arXiv:1308.6483. https://arxiv.org/abs/1308.6483
2013 arXiv
-
[48]
N., et al
Li, J., Shen, Y., Brandt, W. N., et al. 2019, ApJ, 884, 119, doi: 10.3847/1538-4357/ab41fb
2019 doi
-
[49]
Li, J. I. H., Shen, Y., Ho, L. C., et al. 2021, ApJ, 906, 103, doi: 10.3847/1538-4357/abc8e6 —. 2023, ApJ, 954, 173, doi: 10.3847/1538-4357/acddda
2021 doi
-
[50]
2014, ApJL, 786, L6, doi: 10.1088/2041-8205/786/1/L6
Li, Y.-R., Wang, J.-M., Hu, C., Du, P., & Bai, J.-M. 2014, ApJL, 786, L6, doi: 10.1088/2041-8205/786/1/L6
2014 doi
-
[51]
2018, ApJ, 865, 56, doi: 10.3847/1538-4357/aada45
Lira, P., Kaspi, S., Netzer, H., et al. 2018, ApJ, 865, 56, doi: 10.3847/1538-4357/aada45
2018 doi
-
[52]
L., Ivezi´ c,ˇZ., Kochanek, C
MacLeod, C. L., Ivezi´ c,ˇZ., Kochanek, C. S., et al. 2010, ApJ, 721, 1014, doi: 10.1088/0004-637X/721/2/1014
2010 doi
-
[53]
L., Ivezi´ c,ˇZ., Sesar, B., et al
MacLeod, C. L., Ivezi´ c,ˇZ., Sesar, B., et al. 2012, ApJ, 753, 106, doi: 10.1088/0004-637X/753/2/106
2012 doi
-
[54]
M., et al
Penton, A., Malik, U., Davis, T. M., et al. 2022, MNRAS, 509, 4008, doi: 10.1093/mnras/stab3027
2022 doi
-
[55]
Peterson, B. M. 1993, Publications of the Astronomical Society of the Pacific, 105, 247, doi: 10.1086/133140
1993 doi
-
[56]
M., Ferrarese, L., Gilbert, K
Peterson, B. M., Ferrarese, L., Gilbert, K. M., et al. 2004, ApJ, 613, 682, doi: 10.1086/423269
2004 doi
-
[57]
T., Lacy, M., Storrie-Lombardi, L
Richards, G. T., Lacy, M., Storrie-Lombardi, L. J., et al. 2006, ApJS, 166, 470, doi: 10.1086/506525
2006 doi
-
[58]
N., Dawson, K
Shen, Y., Brandt, W. N., Dawson, K. S., et al. 2015a, The Astrophysical Journal Supplement Series, 216, 4, doi: 10.1088/0067-0049/216/1/4
-
[59]
E., Ho, L
Shen, Y., Greene, J. E., Ho, L. C., et al. 2015b, The Astrophysical Journal, 805, 96, doi: 10.1088/0004-637X/805/2/96
-
[60]
J., et al
Shen, Y., Horne, K., Grier, C. J., et al. 2016, ApJ, 818, 30, doi: 10.3847/0004-637X/818/1/30
2016 doi
-
[61]
B., Horne, K., et al
Shen, Y., Hall, P. B., Horne, K., et al. 2019a, ApJS, 241, 34, doi: 10.3847/1538-4365/ab074f
- [62]
-
[63]
A., Gunn, J
Smee, S. A., Gunn, J. E., Uomoto, A., et al. 2013, AJ, 146, 32, doi: 10.1088/0004-6256/146/2/32
2013 doi
-
[64]
A., Horne, K., & Villforth, C
Starkey, D. A., Horne, K., & Villforth, C. 2016, MNRAS, 456, 1960, doi: 10.1093/mnras/stv2744
2016 doi
-
[65]
R., Shen, Y., et al
Sun, M., Trump, J. R., Shen, Y., et al. 2015, ApJ, 811, 42, doi: 10.1088/0004-637X/811/1/42
2015 doi
-
[66]
2019, The Messenger, 175, 58, doi: 10.18727/0722-6691/5129 U, V., Barth, A
Swann, E., Sullivan, M., Carrick, J., et al. 2019, The Messenger, 175, 58, doi: 10.18727/0722-6691/5129 U, V., Barth, A. J., Vogler, H. A., et al. 2022, ApJ, 925, 52, doi: 10.3847/1538-4357/ac3d26 Vanden Berk, D. E., Wilhite, B. C., Kron, R. G., et al. 2004, ApJ, 601, 692, doi...
2019 doi
-
[67]
M., Alloin, D., et al
Wanders, I., Peterson, B. M., Alloin, D., et al. 1997, The Astrophysical Journal Supplement Series, 113, 69, doi: 10.1086/313054
1997 doi
-
[68]
2019, ApJ, 882, 4, doi: 10.3847/1538-4357/ab322b
Wang, S., Shen, Y., Jiang, L., et al. 2019, ApJ, 882, 4, doi: 10.3847/1538-4357/ab322b
2019 doi
-
[69]
S., Peterson, B
Yu, Z., Kochanek, C. S., Peterson, B. M., et al. 2020, MNRAS, 491, 6045, doi: 10.1093/mnras/stz3464
2020 doi
-
[70]
2021, MNRAS, 507, 3771, doi: 10.1093/mnras/stab2244
Yu, Z., Martini, P., Penton, A., et al. 2021, MNRAS, 507, 3771, doi: 10.1093/mnras/stab2244
2021 doi
- [71]
-
[72]
S., & Peterson, B
Zu, Y., Kochanek, C. S., & Peterson, B. M. 2011, ApJ, 735, 80, doi: 10.1088/0004-637X/735/2/80
2011 doi
Reviewed August 11, 2026 · model on record in the stance chip above.
Discussion (0). Continue with ORCID to comment.