REVIEW 4 major objections 5 minor 141 references
Photometric Selection of type 1 Quasars in the XMM-LSS Field with Machine Learning and the Disk-Corona Connection
T0 review · 4 major / 5 minor · reviewed 2026-08-11 · deepseek-v4-flash
Pith's one-line read A gradient-boosted classifier selects 1,591 type 1 quasars in XMM-LSS at 99.7% reliability and confirms the disk-corona luminosity relation.
desk verdict A useful new quasar sample and a reproduced α_OX–L2500 relation, but the blind-test performance claims are partly extrapolated to the faint end and the abstract overstates the reliability. read the letter →
The pith
A machine-rendered reading of the paper's core claim, the machinery that carries it, and where it could break.
The reading
What carries the argument
The load-bearing machinery is a two-stage XGBoost classifier: the first stage separates stars from extragalactic objects, and the second separates quasars from galaxies, using 18 colors (from GALEX UV through optical to Spitzer IRAC) plus 5 morphology parameters built from PSF-minus-Kron magnitudes. XGBoost, a gradient-boosted decision tree ensemble, supplies built-in handling of missing photometry and regularization to limit overfitting; the thresholds $p_{\rm extragalactic} \ge 0.98$ and $p_{\rm quasar} \ge 0.95$ are chosen on the blind-test sample to favor high reliability. For the disk-corona relation, the paper defines $\alpha_{\rm OX}$ as the logarithmic ratio of 2500 Angstrom and 2 keV flux densities and uses the ASURV survival-analysis package with the EM algorithm to fit the linear relation while treating X-ray nondetections as upper limits.
What would settle it
Obtain spectra of roughly 100 randomly selected XGBoost-selected quasars in the XMM-LSS field with $22 < i < 23$ and no existing SDSS spectra; the paper's blind test finds no drop in reliability with magnitude, so a confirmation rate below about 90% would directly contradict the claim that the selection works to $i\approx23$.
Extended reading notes
Core claim
The central discovery claim is that photometric quasar selection by XGBoost transfers from the training field to unseen data and yields a sample large enough to measure the optical-to-X-ray connection with competitive accuracy. Specifically, the paper reports a blind-test reliability of 0.997 and completeness of 0.875 for type 1 quasars, with no significant dependence on i-band magnitude down to $i\approx23$, and it selects 1,591 quasars inside the XMM-LSS field whose sky density exceeds that of SDSS spectroscopy. For the subsample of 1,016 radio-quiet quasars without signs of X-ray absorption, the fitted relation $\alpha_{\rm OX} = (-0.156\pm0.007) \log L_{2500} + (3.175\pm0.211)$, with dispersion 0.159, agrees with the relations of Just et al. (2007) and Lusso & Risaliti (2016). The paper also finds that the slope steepens in the high-luminosity, high-redshift regime, consistent with an evolving disk-corona connection.
Load-bearing premise
The blind-test sample, drawn from SDSS spectroscopy outside the XMM-LSS field and with much sparser CFHTLS $u^*$-band and VIDEO coverage than the parent sample inside the field, is representative enough that the measured reliability and completeness transfer to the actual in-field selection.
Editorial extensions
If this is right
- The same pipeline can be applied to the other two XMM-SERVS fields, W-CDF-S and ELAIS-S1, roughly doubling the available quasar sample for disk-corona studies.
- The selected sample extends the low-luminosity end of $\alpha_{\rm OX}$ studies by about 0.3 dex compared with previous optically selected X-ray samples, reaching a 90% log $L_{2500}$ range lower bound of 28.87.
- The $\alpha_{\rm OX}$--$L_{2500}$ slope is unchanged when restricting to 832 quasars with little UV reddening or to 741 X-ray-detected quasars, indicating the relation is not driven by dust, host-galaxy contamination, or X-ray-absorbed sources.
- The XGBoost photometric redshifts (outlier fraction $\approx17\%$, $\sigma_{\rm NMAD} \approx 0.07$) outperform the Le PHARE SED fit on the same data, suggesting machine-learning photo-$z$s are a viable alternative for featureless quasar SEDs.
- The slope steepens from $-0.156$ to about $-0.19$ in the $1.7<z<2.7$, high-luminosity subset, supporting the idea that the $\alpha_{\rm OX}$--$L_{2500}$ relation evolves and may be tied to black hole mass and Eddington ratio.
Reading between the lines
- If the pipeline is applied to the other two XMM-SERVS fields, the combined sample could reach roughly 3,000 quasars and shrink the slope uncertainty; the paper flags this as future work rather than performing it.
- The blind-test sample has much sparser CFHTLS $u^*$-band and VIDEO coverage than the in-field parent sample, so the reported 99.7% reliability may be conservative; a direct spectroscopic check inside the field would test this transfer.
- The 275 X-ray-undetected quasars are treated as upper limits in the survival analysis; a stacking analysis of their average X-ray emission would test whether their inclusion or exclusion shifts the slope, which the paper does not do.
- Because the photometric-redshift outlier fraction is about 17%, roughly one in six quasars may have a redshift error of $|\Delta z|/(1+z)>0.15$, which could add unrecognized scatter to the derived $\alpha_{\rm OX}$ values.
Editorial analysis
A structured set of objections, weighed in public.
Referee Report
Summary. The paper applies XGBoost to multiwavelength photometry (HSC, Spitzer DeepDrill, VIDEO, CFHTLS, GALEX) to select type 1 quasars in the XMM-LSS field. The authors construct a parent sample of 168,805 sources, train two binary classifiers on SDSS spectroscopically confirmed quasars, galaxies, and stars, and validate on a blind-test sample outside the XMM-LSS field, reporting quasar reliability 0.997 and completeness 0.875. They estimate photometric redshifts with XGBoost (f_outlier ≈ 17%, σ_NMAD ≈ 0.07 for the u*-covered blind-test subset) and use X-ray data from Chen et al. (2018) to derive the α_OX–L_2500 relation for 1,016 radio-quiet quasars: α_OX = (−0.156 ± 0.007) log L_2500 + (3.175 ± 0.211), with dispersion 0.159. The relation agrees with Just et al. (2007) and Lusso & Risaliti (2016); the paper tests several potential biases and finds no significant effects, and reports tentative steepening at high L_2500/z.
Significance. The main contribution is a large photometrically selected quasar sample in a deep X-ray field, with public code and data, which can support future disk-corona studies and can be extended to the other XMM-SER VS fields. The α_OX–L_2500 analysis is an independent empirical fit compared against external literature, uses censored-data survival analysis, and includes explicit tests for X-ray absorption, reddening, and variability; these are genuine strengths. The derived relation is consistent with previous work, and the low-luminosity extension relative to Lusso & Risaliti (2016) is potentially valuable. The principal caveat is that the blind-test validation sample is brighter and has different multiwavelength coverage than the in-field parent sample, so the headline reliability and completeness, especially at 22 < i < 23, should be viewed with caution.
major comments (4)
- [Section 3.5 and Table 2] There is a one-object inconsistency in the headline numbers. The text states that 'of the 345 selected quasars, 344 are SDSS quasars,' while Table 2 reports 344 selected quasars including 343 SDSS quasars and one galaxy. The abstract quotes a reliability of ≈99.9%, but the text and Table 3 give 0.997 (99.7%). Because the reliability and completeness figures are central to the sample-construction claim, these numbers must be reconciled before publication.
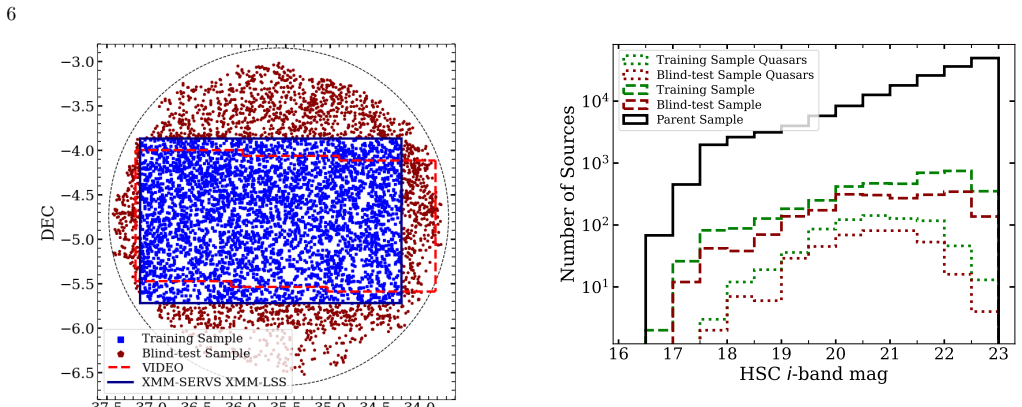
- [Sections 2.4, 2.5, 3.5, and Figure 2] The blind-test sample is not representative of the parent sample at the faint end. The parent sample has mean i = 21.7, while both the training and blind-test quasars have mean i = 20.7, and the blind-test contains only 393 quasars. The paper's claim that it selects 649 quasars at 22 < i < 23 (23% of the 2,784 selected quasars) and the low-luminosity end of the α_OX–L_2500 relation therefore rely on the assumption that performance does not degrade at faint magnitudes. Figure 6 shows no significant trend, but the faint bins have large Gehrels uncertainties and are based on few objects; this is an extrapolation rather than a validation. Please provide per-bin counts and uncertainties, and either additional faint-end validation (for example, using the in-field MMT/WIYN spectroscopy) or an explicit statement that faint-end performance is not directly verified.
- [Table 1 and Sections 2.5, 3.1] The blind-test sample has much lower CFHTLS u* and VIDEO coverage than the training sample (u*: 67.9% vs 99.3%; VIDEO: 16.8% vs 80.9%). Because XGBoost's built-in missing-value routine can learn coverage-dependent split rules, the blind test evaluates a different missingness pattern from the one present in the XMM-LSS parent sample. The statement in Section 3.5 that in-field performance 'might be better' is speculation; the opposite could also hold. The authors should test the model under the in-field missingness pattern (for example, by masking in-field training data) or temper the performance claims accordingly.
- [Section 4] The adopted photo-z accuracy (f_outlier ≈ 17%, σ_NMAD ≈ 0.07) is based on only 211 blind-test quasars with CFHT u* detection, whereas the full blind test gives f_outlier = 22.7% and σ_NMAD = 0.079. Since roughly 42% of the 1,591 selected quasars use photo-zs, the systematic difference between these two estimates should be propagated into the α_OX analysis, or at least discussed as a source of uncertainty in L_2500 and hence in Equation 4.
minor comments (5)
- [Section 5.5] The text refers to '211 high-L SDSS quasars' but then says the relation slope was derived for 'the 212 quasars'; the intended number should be stated consistently.
- [Abstract and Conclusion] The abstract reports reliability ≈99.9% and completeness ≈87.5%, while the Conclusion says 'approximately 99%' and 'approximately 90%'; these should be harmonized with the exact values in Section 3.5 and Table 3.
- [Section 5.3] The statement that the method extends the luminosity range 'to the low-luminosity end' is contradicted by the paper's own comparison: the lower limit of the 90% log L_2500 range is 28.87, which is 0.3 dex higher than the 28.56 for Just et al. (2007). The extension is relative to Lusso & Risaliti (2016) or to previous ML-selected samples and should be phrased accordingly.
- [Section 3.2] The sentence 'The entire training sample is used for both training and validation' is imprecise; the paper actually uses five-fold cross-validation, which should be stated explicitly.
- [Section 4] The comparison of XGBoost photo-zs with Le PHARE is useful, but the manuscript should state whether the Le PHARE results use the same 13-band data and the same blind-test sample selection, to make the comparison fully transparent.
Circularity Check
No significant circularity: the machine-learning selection is validated on held-out SDSS spectra, and the α_OX–L2500 relation is an empirical fit benchmarked against independent literature samples.
full rationale
The paper's central derivation chain is not circular. The quasar selection pipeline is trained on spectroscopically identified SDSS quasars, galaxies, and stars and evaluated on a blind-test sample constructed in the same way but excluded from training; this is a standard supervised-learning validation, not a case where a fitted parameter is renamed as a prediction. The reliability and completeness numbers are computed directly from the blind-test confusion matrix (Section 3.5, Table 3) and are not forced by the training labels. The photometric redshifts are likewise trained on a spectroscopic subsample and assessed on an independent blind-test sample, with quality metrics reported separately (Section 4). The α_OX–L2500 relation is an empirical regression of α_OX on L2500 computed from X-ray and optical photometry of the selected quasars (Equation 4). Although α_OX and L2500 both depend on f2500 by definition, the fitted slope (−0.156) is not the value that the shared f2500 term alone would impose (−0.384 if the X-ray flux were uncorrelated with optical luminosity), so the result carries independent information about the f2keV–f2500 correlation. Moreover, the paper explicitly compares Equation 4 with the relations of Just et al. (2007) and Lusso & Risaliti (2016), and also re-derives a comparison relation from Lusso et al. (2020), providing external benchmarks rather than relying on the authors' own prior results. Self-citations appear (e.g., Chen et al. 2018 for the X-ray catalog, Pu et al. 2020 for the Γeff threshold), but these supply data products and externally published criteria, and the paper tests alternative Γeff thresholds, so the central claim does not reduce to a self-citation chain. The main validity concern is the representativeness of the blind-test sample for the fainter in-field parent sample — the blind-test quasars are brighter and have less CFHTLS u* and VIDEO coverage — but this is a generalization limitation, not a circularity. The claimed completeness and reliability at faint magnitudes rest on an extrapolation, yet the α_OX–L2500 result itself is an independent empirical measurement compared with prior work. No step in the derivation is equivalent to its inputs by construction.
Assumptions & free parameters
free parameters (7)
- p_extragalactic threshold =
0.98
- p_quasar threshold =
0.95
- i-band magnitude cut for subsample =
22.5
- Gamma_eff threshold for X-ray absorption exclusion =
1.26
- Radio-loudness threshold R =
10
- Gamma_eff = 1.7 for soft-band-only detections =
1.7
- Gamma_eff = 1.0 for hard-band-only detections =
1.0
assumptions (5)
- domain assumption SDSS spectroscopic classifications (quasar, galaxy, star) are correct for the training and blind-test samples.
- domain assumption The X-ray source catalog and soft-band sensitivity map from Chen et al. (2018) are reliable, including the count rates, flux conversions, and limiting fluxes.
- domain assumption The XGBoost photometric redshifts, with an estimated outlier fraction of about 17%, are accurate enough for the ~669 quasars without secure spectroscopic redshifts so that L2500 and hence the α_OX-L2500 relation are not significantly biased.
- standard math The ASURV EM algorithm and the Kaplan-Meier estimator correctly handle censored X-ray data (upper limits) when deriving the regression parameters and dispersion.
- domain assumption Type 1 quasar spectral energy distributions have colors that are largely independent of luminosity, allowing the XGBoost model trained on SDSS-selected quasars to generalize to fainter quasars (i~23).
Cite this review
Pith. "Pith review of Photometric Selection of type 1 Quasars in the XMM-LSS Field with Machine Learning and the Disk-Corona Connection." pith.science (2026). https://pith.science/paper/QYRYNLF5
@misc{pith2026241206923,
  author       = {Pith},
  title        = {Pith review of: Photometric Selection of type 1 Quasars in the XMM-LSS Field with Machine Learning and the Disk-Corona Connection},
  year         = {2026},
  howpublished = {\url{https://pith.science/paper/QYRYNLF5}},
  note         = {Machine review of arXiv:2412.06923}
}
abstract
We present photometric selection of type 1 quasars in the $\approx5.3~{\rm deg}^{2}$ XMM-Large Scale Structure (XMM-LSS) survey field with machine learning. We constructed our training and \hbox{blind-test} samples using spectroscopically identified SDSS quasars, galaxies, and stars. We utilized the XGBoost machine learning method to select a total of 1\,591 quasars. We assessed the classification performance based on the blind-test sample, and the outcome was favorable, demonstrating high reliability ($\approx99.9\%$) and good completeness ($\approx87.5\%$). We used XGBoost to estimate photometric redshifts of our selected quasars. The estimated photometric redshifts span a range from 0.41 to 3.75. The outlier fraction of these photometric redshift estimates is $\approx17\%$ and the normalized median absolute deviation ($\sigma_{\rm NMAD}$) is $\approx0.07$. To study the quasar disk-corona connection, we constructed a subsample of 1\,016 quasars with HSC $i<22.5$ after excluding radio-loud and potentially X-ray-absorbed quasars. The relation between the optical-to-X-ray power-law slope parameter ($\alpha_{\rm OX}$) and the 2500 Angstrom monochromatic luminosity ($L_{2500}$) for this subsample is $\alpha_{\rm OX}=(-0.156\pm0.007)~{\rm log}~{L_{\rm 2500}}+(3.175\pm0.211)$ with a dispersion of 0.159. We found this correlation in good agreement with the correlations in previous studies. We explored several factors which may bias the $\alpha_{\rm OX}$-$L_{\rm 2500}$ relation and found that their effects are not significant. We discussed possible evolution of the $\alpha_{\rm OX}$-$L_{\rm 2500}$ relation with respect to $L_{\rm 2500}$ or redshift.
Figures


Figures from the paper (7 more)


Reference graph
Works this paper leans on
-
[1]
2018, PASJ, 70, S4, doi: 10.1093/pasj/psx066
Aihara, H., Arimoto, N., Armstrong, R., et al. 2018, PASJ, 70, S4, doi: 10.1093/pasj/psx066
-
[2]
2022, PASJ, 74, 247, doi: 10.1093/pasj/psab122
Aihara, H., AlSayyad, Y., Ando, M., et al. 2022, PASJ, 74, 247, doi: 10.1093/pasj/psab122
-
[3]
2019, in Proceedings of the 25th ACM SIGKDD International Conference on Knowledge Discovery & Data Mining, 2623–2631
Akiba, T., Sano, S., Yanase, T., Ohta, T., & Koyama, M. 2019, in Proceedings of the 25th ACM SIGKDD International Conference on Knowledge Discovery & Data Mining, 2623–2631
2019
-
[4]
2019, A&A, 628, A135, doi: 10.1051/0004-6361/201935874
Arcodia, R., Merloni, A., Nandra, K., & Ponti, G. 2019, A&A, 628, A135, doi: 10.1051/0004-6361/201935874
-
[5]
Arnouts, S., Cristiani, S., Moscardini, L., et al. 1999, MNRAS, 310, 540, doi: 10.1046/j.1365-8711.1999.02978.x 17 https://github.com/choubalv-hj/AstroML. 18 https://doi.org/10.5281/zenodo.14321895. Astropy Collaboration, Robitaille, T. P., Tollerud, E. J., et al. 2013, A&A, 558, A33, doi: 10.1051/0004-6361/201322068 Astropy Collaboration, Price-Whelan, A...
arXiv 1999
-
[6]
1982, ApJL, 262, L17, doi: 10.1086/183903 —
Avni, Y., & Tananbaum, H. 1982, ApJL, 262, L17, doi: 10.1086/183903 —. 1986, ApJ, 305, 83, doi: 10.1086/164230
doi:10.1086/183903 1982
-
[7]
Blundell, K. M. 2005, ApJ, 618, 108, doi: 10.1086/425859
doi:10.1086/425859 2005
-
[8]
Beck, R., Lin, C. A., Ishida, E. E. O., et al. 2017, MNRAS, 468, 4323, doi: 10.1093/mnras/stx687
Show all 141 references
-
[9]
1996, A&AS, 117, 393, doi: 10.1051/aas:1996164 22
Bertin, E., & Arnouts, S. 1996, A&AS, 117, 393, doi: 10.1051/aas:1996164 22
1996 doi
-
[10]
2017, Frontiers in Astronomy and Space Sciences, 4, 68, doi: 10.3389/fspas.2017.00068
Bisogni, S., Risaliti, G., & Lusso, E. 2017, Frontiers in Astronomy and Space Sciences, 4, 68, doi: 10.3389/fspas.2017.00068
2017
-
[11]
F., Hogg, D
Bovy, J., Hennawi, J. F., Hogg, D. W., et al. 2011, ApJ, 729, 141, doi: 10.1088/0004-637X/729/2/141
2011 doi
-
[12]
J., Almaini, O., Hartley, W
Bradshaw, E. J., Almaini, O., Hartley, W. G., et al. 2013, MNRAS, 433, 194, doi: 10.1093/mnras/stt715
2013 doi
-
[13]
B., van Dokkum, P
Brammer, G. B., van Dokkum, P. G., & Coppi, P. 2008, ApJ, 686, 1503, doi: 10.1086/591786
2008 doi
-
[14]
N., & Alexander, D
Brandt, W. N., & Alexander, D. M. 2015, A&A Rv, 23, 1, doi: 10.1007/s00159-014-0081-z
2015 doi
-
[15]
N., & Hasinger, G
Brandt, W. N., & Hasinger, G. 2005, ARA&A, 43, 827, doi: 10.1146/annurev.astro.43.051804.102213
2005 arXiv
- [16]
-
[17]
2010, ApJ, 716, 348, doi: 10.1088/0004-637X/716/1/348
Brusa, M., Civano, F., Comastri, A., et al. 2010, ApJ, 716, 348, doi: 10.1088/0004-637X/716/1/348
2010 doi
-
[18]
2024, A&A, 683, A34, doi: 10.1051/0004-6361/202346625
Calderone, G., Guarneri, F., Porru, M., et al. 2024, A&A, 683, A34, doi: 10.1051/0004-6361/202346625
2024 doi
-
[19]
2023, MNRAS, 518, 3123, doi: 10.1093/mnras/stac3336
Chaini, S., Bagul, A., Deshpande, A., et al. 2023, MNRAS, 518, 3123, doi: 10.1093/mnras/stac3336
2023 doi
-
[20]
Chen, C. T. J., Brandt, W. N., Luo, B., et al. 2018, MNRAS, 478, 2132, doi: 10.1093/mnras/sty1036
2018 doi
-
[21]
2016, in KDD ’16, Vol
Chen, T., & Guestrin, C. 2016, in KDD ’16, Vol. 11, Proceedings of the 22nd ACM SIGKDD International Conference on Knowledge Discovery and Data Mining (ACM), 785–794, doi: 10.1145/2939672.2939785
2016
-
[22]
F., Liu, J., et al
Cheng, H., Liu, B. F., Liu, J., et al. 2020, MNRAS, 495, 1158, doi: 10.1093/mnras/staa1250
2020 doi
-
[23]
2018, A&A, 619, A95, doi: 10.1051/0004-6361/201833631
Chiaraluce, E., Vagnetti, F., Tombesi, F., & Paolillo, M. 2018, A&A, 619, A95, doi: 10.1051/0004-6361/201833631
2018 doi
-
[24]
L., Blanton, M
Coil, A. L., Blanton, M. R., Burles, S. M., et al. 2011, ApJ, 741, 8, doi: 10.1088/0004-637X/741/1/8
2011 doi
-
[25]
M., Fan, X., Brandt, W
Diamond-Stanic, A. M., Fan, X., Brandt, W. N., et al. 2009, ApJ, 699, 782, doi: 10.1088/0004-637X/699/1/782
2009 doi
-
[26]
Falcke, H., Sherwood, W., & Patnaik, A. R. 1996, ApJ, 471, 106, doi: 10.1086/177956
1996 doi
-
[27]
L., Wang, H
Fan, L. L., Wang, H. Y., Wang, T., et al. 2009, ApJ, 690, 1006, doi: 10.1088/0004-637X/690/1/1006
2009 doi
-
[28]
Clayton, G. C. 2019, ApJ, 886, 108, doi: 10.3847/1538-4357/ab4c3a
2019 doi
-
[29]
N., Zou, F., et al
Fu, S., Brandt, W. N., Zou, F., et al. 2022, ApJ, 934, 97, doi: 10.3847/1538-4357/ac7a36
2022 doi
-
[30]
2021, ApJS, 254, 6, doi: 10.3847/1538-4365/abe85e
Fu, Y., Wu, X.-B., Yang, Q., et al. 2021, ApJS, 254, 6, doi: 10.3847/1538-4365/abe85e
2021 doi
-
[31]
2024, ApJS, 271, 54, doi: 10.3847/1538-4365/ad2ae6
Fu, Y., Wu, X.-B., Li, Y., et al. 2024, ApJS, 271, 54, doi: 10.3847/1538-4365/ad2ae6
2024 doi
-
[32]
C., Brandt, W
Gallagher, S. C., Brandt, W. N., Chartas, G., & Garmire, G. P. 2002, ApJ, 567, 37, doi: 10.1086/338485
2002 doi
-
[33]
C., Brandt, W
Gallagher, S. C., Brandt, W. N., Chartas, G., et al. 2006, ApJ, 644, 709, doi: 10.1086/503762
2006 doi
-
[34]
2008, MNRAS, 386, 1417, doi: 10.1111/j.1365-2966.2008.13070.x
Gao, D., Zhang, Y.-X., & Zhao, Y.-H. 2008, MNRAS, 386, 1417, doi: 10.1111/j.1365-2966.2008.13070.x
2008
-
[35]
2014, A&A, 562, A23, doi: 10.1051/0004-6361/201322790
Garilli, B., Guzzo, L., Scodeggio, M., et al. 2014, A&A, 562, A23, doi: 10.1051/0004-6361/201322790
2014 doi
-
[36]
1986, ApJ, 303, 336, doi: 10.1086/164079
Gehrels, N. 1986, ApJ, 303, 336, doi: 10.1086/164079
1986 doi
-
[37]
R., & Brandt, W
Gibson, R. R., & Brandt, W. N. 2012, ApJ, 746, 54, doi: 10.1088/0004-637X/746/1/54
2012 doi
-
[38]
Schneider, D. P. 2009, ApJ, 696, 924, doi: 10.1088/0004-637X/696/1/924
2009 doi
-
[39]
R., Brandt, W
Gibson, R. R., Brandt, W. N., & Schneider, D. P. 2008, ApJ, 685, 773, doi: 10.1086/590403
2008 doi
-
[40]
D., & Coupon, J
Golob, A., Sawicki, M., Goulding, A. D., & Coupon, J. 2021, MNRAS, 503, 4136, doi: 10.1093/mnras/stab719
2021 doi
-
[41]
D., Clayton, G
Gordon, K. D., Clayton, G. C., Misselt, K. A., Landolt, A. U., & Wolff, M. J. 2003, ApJ, 594, 279, doi: 10.1086/376774
2003 doi
-
[42]
2018, The Journal of Open Source Software, 3, 695
Green, G. 2018, The Journal of Open Source Software, 3, 695
2018
-
[43]
J., Aldcroft, T
Green, P. J., Aldcroft, T. L., Richards, G. T., et al. 2009, ApJ, 690, 644, doi: 10.1088/0004-637X/690/1/644
2009 doi
- [44]
-
[45]
M., & Page, K
Grupe, D., Komossa, S., Leighly, K. M., & Page, K. L. 2010, ApJS, 187, 64, doi: 10.1088/0067-0049/187/1/64
2010 doi
-
[46]
B., Gallagher, S
Hall, P. B., Gallagher, S. C., Richards, G. T., et al. 2006, AJ, 132, 1977, doi: 10.1086/507842
2006 doi
-
[47]
L., Jarvis, M
Heywood, I., Hale, C. L., Jarvis, M. J., et al. 2020, MNRAS, 496, 3469, doi: 10.1093/mnras/staa1770
2020 doi
-
[48]
J., Hale, C
Heywood, I., Jarvis, M. J., Hale, C. L., et al. 2022, MNRAS, 509, 2150, doi: 10.1093/mnras/stab3021 HI4PI Collaboration, Ben Bekhti, N., Fl¨ oer, L., et al. 2016, A&A, 594, A116, doi: 10.1051/0004-6361/201629178
2022 doi
-
[49]
2010, A&A, 523, A31, doi: 10.1051/0004-6361/201014885
Hildebrandt, H., Arnouts, S., Capak, P., et al. 2010, A&A, 523, A31, doi: 10.1051/0004-6361/201014885
2010 doi
-
[50]
N., et al
Huang, J., Luo, B., Brandt, W. N., et al. 2023, ApJ, 950, 18, doi: 10.3847/1538-4357/accd64
2023 doi
-
[51]
C., Withington, K., et al
Hudelot, P., Cuillandre, J. C., Withington, K., et al. 2012, VizieR Online Data Catalog, II/317
2012
-
[52]
Hughes, A. C. N., Bailer-Jones, C. A. L., & Jamal, S. 2022, A&A, 668, A99, doi: 10.1051/0004-6361/202244859
2022 doi
-
[53]
J., et al
Ilbert, O., Arnouts, S., McCracken, H. J., et al. 2006, A&A, 457, 841, doi: 10.1051/0004-6361:20065138
2006 doi
-
[54]
Isobe, T., & Feigelson, E. D. 1990, in Bulletin of the American Astronomical Society, Vol. 22, 917–918 23
1990
-
[55]
J., Bonfield, D
Jarvis, M. J., Bonfield, D. G., Bruce, V. A., et al. 2013, MNRAS, 428, 1281, doi: 10.1093/mnras/sts118
2013 doi
-
[56]
2007, ApJ, 656, 680, doi: 10.1086/510831
Jiang, L., Fan, X., Ivezi´ c,ˇZ., et al. 2007, ApJ, 656, 680, doi: 10.1086/510831
2007 doi
-
[57]
2024, MNRAS, 527, 356, doi: 10.1093/mnras/stad3193
Jin, C., Lusso, E., Ward, M., Done, C., & Middei, R. 2024, MNRAS, 527, 356, doi: 10.1093/mnras/stad3193
2024 doi
-
[59]
2019, MNRAS, 485, 4539, doi: 10.1093/mnras/stz680
Jin, X., Zhang, Y., Zhang, J., et al. 2019, MNRAS, 485, 4539, doi: 10.1093/mnras/stz680
2019 doi
-
[60]
W., Brandt, W
Just, D. W., Brandt, W. N., Shemmer, O., et al. 2007, ApJ, 665, 1004, doi: 10.1086/519990
2007 doi
-
[61]
I., Sramek, R., Schmidt, M., Shaffer, D
Kellermann, K. I., Sramek, R., Schmidt, M., Shaffer, D. B., & Green, R. 1989, AJ, 98, 1195, doi: 10.1086/115207
1989 doi
-
[62]
M., Richards, G
Krawczyk, C. M., Richards, G. T., Mehta, S. S., et al. 2013, ApJS, 206, 4, doi: 10.1088/0067-0049/206/1/4
2013 doi
-
[63]
A., & Canizares, C
Kriss, G. A., & Canizares, C. R. 1985, ApJ, 297, 177, doi: 10.1086/163514
1985 doi
-
[64]
2018, MNRAS, 480, 1247, doi: 10.1093/mnras/sty1890
Kubota, A., & Done, C. 2018, MNRAS, 480, 1247, doi: 10.1093/mnras/sty1890
2018 doi
-
[65]
A., Farrah, D., et al
Lacy, M., Surace, J. A., Farrah, D., et al. 2020, DeepDrill XMM-LSS 2-band Catalog, the Infrared Science Archive (IRSA), doi: 10.26131/IRSA500 —. 2021, MNRAS, 501, 892, doi: 10.1093/mnras/staa3714
2020 doi
-
[66]
Laha, S., Ghosh, R., Guainazzi, M., & Markowitz, A. G. 2018, MNRAS, 480, 1522, doi: 10.1093/mnras/sty1919
2018 doi
-
[67]
Laor, A., & Davis, S. W. 2011, MNRAS, 417, 681, doi: 10.1111/j.1365-2966.2011.19310.x
2011
-
[68]
1992, in Astronomical Society of the Pacific Conference Series, Vol
Lavalley, M., Isobe, T., & Feigelson, E. 1992, in Astronomical Society of the Pacific Conference Series, Vol. 25, Astronomical Data Analysis Software and Systems I, ed. D. M. Worrall, C. Biemesderfer, & J. Barnes, 245 Le F` evre, O., Cassata, P., Cucciati, O., et al. 2013, A&A...
1992 doi
-
[69]
2022, MNRAS, 509, 2289, doi: 10.1093/mnras/stab3165
Li, C., Zhang, Y., Cui, C., et al. 2022, MNRAS, 509, 2289, doi: 10.1093/mnras/stab3165
2022 doi
-
[70]
N., et al
Liu, H., Luo, B., Brandt, W. N., et al. 2021, ApJ, 910, 103, doi: 10.3847/1538-4357/abe37f —. 2022, ApJ, 930, 53, doi: 10.3847/1538-4357/ac6265 —. 2019, ApJ, 878, 79, doi: 10.3847/1538-4357/ab1d5b
2021 doi
-
[71]
N., Xue, Y
Luo, B., Brandt, W. N., Xue, Y. Q., et al. 2010, ApJS, 187, 560, doi: 10.1088/0067-0049/187/2/560
2010 doi
-
[72]
N., Hall, P
Luo, B., Brandt, W. N., Hall, P. B., et al. 2015, ApJ, 805, 122, doi: 10.1088/0004-637X/805/2/122
2015 doi
-
[73]
2016, ApJ, 819, 154, doi: 10.3847/0004-637X/819/2/154 —
Lusso, E., & Risaliti, G. 2016, ApJ, 819, 154, doi: 10.3847/0004-637X/819/2/154 —. 2017, A&A, 602, A79, doi: 10.1051/0004-6361/201630079
2016 doi
-
[74]
2010, A&A, 512, A34, doi: 10.1051/0004-6361/200913298
Lusso, E., Comastri, A., Vignali, C., et al. 2010, A&A, 512, A34, doi: 10.1051/0004-6361/200913298
2010 doi
-
[75]
2020, A&A, 642, A150, doi: 10.1051/0004-6361/202038899
Lusso, E., Risaliti, G., Nardini, E., et al. 2020, A&A, 642, A150, doi: 10.1051/0004-6361/202038899
2020 doi
-
[76]
W., Higley, A
Lyke, B. W., Higley, A. N., McLane, J. N., et al. 2020, ApJS, 250, 8, doi: 10.3847/1538-4365/aba623
2020 doi
-
[77]
L., Ivezi´ c,ˇZ., Kochanek, C
MacLeod, C. L., Ivezi´ c,ˇZ., Kochanek, C. S., et al. 2010, ApJ, 721, 1014, doi: 10.1088/0004-637X/721/2/1014
2010 doi
-
[78]
2020, The Messenger, 180, 24, doi: 10.18727/0722-6691/5197
Maiolino, R., Cirasuolo, M., Afonso, J., et al. 2020, The Messenger, 180, 24, doi: 10.18727/0722-6691/5197
2020 doi
-
[79]
2016, ApJ, 817, 34, doi: 10.3847/0004-637X/817/1/34
Marchesi, S., Civano, F., Elvis, M., et al. 2016, ApJ, 817, 34, doi: 10.3847/0004-637X/817/1/34
2016 doi
-
[80]
C., Fanson, J., Schiminovich, D., et al
Martin, D. C., Fanson, J., Schiminovich, D., et al. 2005, ApJL, 619, L1, doi: 10.1086/426387 Mart ´ ınez-Solaeche, G., Queiroz, C., Gonz´ alez Delgado, R. M., et al. 2023, A&A, 673, A103, doi: 10.1051/0004-6361/202245750
2005 doi
-
[81]
Fender, R. P. 2006, Nature, 444, 730, doi: 10.1038/nature05389
2006 doi
-
[82]
J., Pearce, H
McLure, R. J., Pearce, H. J., Dunlop, J. S., et al. 2013, MNRAS, 428, 1088, doi: 10.1093/mnras/sts092
2013 doi
-
[83]
P., Brandt, W
Miller, B. P., Brandt, W. N., Schneider, D. P., et al. 2011, ApJ, 726, 20, doi: 10.1088/0004-637X/726/1/20
2011 doi
-
[85]
C., et al
Mirabal, N., Charles, E., Ferrara, E. C., et al. 2016, ApJ, 825, 69, doi: 10.3847/0004-637X/825/1/69
2016 doi
-
[86]
2018, PASJ, 70, S1, doi: 10.1093/pasj/psx063
Miyazaki, S., Komiyama, Y., Kawanomoto, S., et al. 2018, PASJ, 70, S1, doi: 10.1093/pasj/psx063
2018 doi
-
[87]
G., Brammer, G
Momcheva, I. G., Brammer, G. B., van Dokkum, P. G., et al. 2016, ApJS, 225, 27, doi: 10.3847/0067-0049/225/2/27
2016 doi
-
[88]
N., Luo, B., et al
Ni, Q., Brandt, W. N., Luo, B., et al. 2018, MNRAS, 480, 5184, doi: 10.1093/mnras/sty1989
2018 doi
-
[89]
N., Yi, W., et al
Ni, Q., Brandt, W. N., Yi, W., et al. 2020, ApJL, 889, L37, doi: 10.3847/2041-8213/ab6d78
2020 doi
-
[90]
N., Chen, C.-T., et al
Ni, Q., Brandt, W. N., Chen, C.-T., et al. 2021, ApJS, 256, 21, doi: 10.3847/1538-4365/ac0dc6
2021 doi
-
[91]
N., Luo, B., et al
Ni, Q., Brandt, W. N., Luo, B., et al. 2022, MNRAS, 511, 5251, doi: 10.1093/mnras/stac394
2022 doi
-
[92]
2011, Journal of Machine Learning Research, 12, 2825
Pedregosa, F., Varoquaux, G., Gramfort, A., et al. 2011, Journal of Machine Learning Research, 12, 2825
2011
-
[93]
2012, MNRAS, 425, 2599, doi: 10.1111/j.1365-2966.2012.21191.x Planck Collaboration, Aghanim, N., Akrami, Y., et al
Peng, N., Zhang, Y., Zhao, Y., & Wu, X.-b. 2012, MNRAS, 425, 2599, doi: 10.1111/j.1365-2966.2012.21191.x Planck Collaboration, Aghanim, N., Akrami, Y., et al. 2020, A&A, 641, A6, doi: 10.1051/0004-6361/201833910
2012
-
[94]
M., Anderson, S
Plotkin, R. M., Anderson, S. F., Brandt, W. N., et al. 2010, ApJ, 721, 562, doi: 10.1088/0004-637X/721/1/562 24
2010 doi
-
[95]
N., et al
Pu, X., Luo, B., Brandt, W. N., et al. 2020, ApJ, 900, 141, doi: 10.3847/1538-4357/abacc5
2020 doi
-
[96]
L., Aird, J., Ruiz, A., & Georgakakis, A
Rankine, A. L., Aird, J., Ruiz, A., & Georgakakis, A. 2024, MNRAS, 527, 9004, doi: 10.1093/mnras/stad3686
2024 doi
-
[97]
T., Nichol, R
Richards, G. T., Nichol, R. C., Gray, A. G., et al. 2004, ApJS, 155, 257, doi: 10.1086/425356
2004 doi
-
[98]
T., Strauss, M
Richards, G. T., Strauss, M. A., Fan, X., et al. 2006, AJ, 131, 2766, doi: 10.1086/503559
2006 doi
-
[99]
R., Webb, N
Rosen, S. R., Webb, N. A., Watson, M. G., et al. 2016, A&A, 590, A1, doi: 10.1051/0004-6361/201526416
2016 doi
-
[100]
2019, Nature Astronomy, 3, 212, doi: 10.1038/s41550-018-0478-0
Salvato, M., Ilbert, O., & Hoyle, B. 2019, Nature Astronomy, 3, 212, doi: 10.1038/s41550-018-0478-0
2019 doi
-
[101]
2009, ApJ, 690, 1250, doi: 10.1088/0004-637X/690/2/1250 S´ anchez, C., Carrasco Kind, M., Lin, H., et al
Salvato, M., Hasinger, G., Ilbert, O., et al. 2009, ApJ, 690, 1250, doi: 10.1088/0004-637X/690/2/1250 S´ anchez, C., Carrasco Kind, M., Lin, H., et al. 2014, MNRAS, 445, 1482, doi: 10.1093/mnras/stu1836
2009 doi
-
[102]
2019, MNRAS, 489, 5202, doi: 10.1093/mnras/stz2522
Sawicki, M., Arnouts, S., Huang, J., et al. 2019, MNRAS, 489, 5202, doi: 10.1093/mnras/stz2522
2019 doi
-
[103]
J., Finkbeiner, D
Schlegel, D. J., Finkbeiner, D. P., & Davis, M. 1998, ApJ, 500, 525, doi: 10.1086/305772
1998 doi
-
[104]
Schmidt, M., & Green, R. F. 1983, ApJ, 269, 352, doi: 10.1086/161048
1983 doi
-
[105]
J., Malz, A
Schmidt, S. J., Malz, A. I., Soo, J. Y. H., et al. 2020, MNRAS, 499, 1587, doi: 10.1093/mnras/staa2799
2020 doi
- [106]
-
[107]
N., Anderson, S
Shemmer, O., Brandt, W. N., Anderson, S. F., et al. 2009, ApJ, 696, 580, doi: 10.1088/0004-637X/696/1/580
2009 doi
- [108]
-
[109]
T., Strauss, M
Shen, Y., Richards, G. T., Strauss, M. A., et al. 2011, ApJS, 194, 45, doi: 10.1088/0067-0049/194/2/45
2011 doi
-
[110]
2023, A&A, 676, A143, doi: 10.1051/0004-6361/202346104
Signorini, M., Risaliti, G., Lusso, E., et al. 2023, A&A, 676, A143, doi: 10.1051/0004-6361/202346104
2023 doi
-
[111]
E., Whitaker, K
Skelton, R. E., Whitaker, K. E., Momcheva, I. G., et al. 2014, ApJS, 214, 24, doi: 10.1088/0067-0049/214/2/24
2014 doi
-
[112]
T., Strateva, I., Brandt, W
Steffen, A. T., Strateva, I., Brandt, W. N., et al. 2006, AJ, 131, 2826, doi: 10.1086/503627
2006 doi
-
[113]
G., & Vignali, C
Berk, D. G., & Vignali, C. 2005, AJ, 130, 387, doi: 10.1086/431247 Str¨ uder, L., Briel, U., Dennerl, K., et al. 2001, A&A, 365, L18, doi: 10.1051/0004-6361:20000066
2005 doi
-
[114]
2019, The Messenger, 175, 58, doi: 10.18727/0722-6691/5129
Swann, E., Sullivan, M., Carrick, J., et al. 2019, The Messenger, 175, 58, doi: 10.18727/0722-6691/5129
2019 doi
-
[115]
2018, PASJ, 70, S9, doi: 10.1093/pasj/psx077
Tanaka, M., Coupon, J., Hsieh, B.-C., et al. 2018, PASJ, 70, S9, doi: 10.1093/pasj/psx077
2018 doi
-
[116]
1979, ApJL, 234, L9, doi: 10.1086/183100
Tananbaum, H., Avni, Y., Branduardi, G., et al. 1979, ApJL, 234, L9, doi: 10.1086/183100
1979 doi
-
[117]
Taylor, M. B. 2005, in Astronomical Society of the Pacific Conference Series, Vol. 347, Astronomical Data Analysis Software and Systems XIV, ed. P. Shopbell, M. Britton, & R. Ebert, 29
2005
-
[118]
N., Zhu, S., et al
Timlin, John D., I., Brandt, W. N., Zhu, S., et al. 2020a, MNRAS, 498, 4033, doi: 10.1093/mnras/staa2661
-
[119]
D., Brandt, W
Timlin, J. D., Brandt, W. N., Ni, Q., et al. 2020b, MNRAS, 492, 719, doi: 10.1093/mnras/stz3433
-
[120]
D., Lamer, G., et al
Traulsen, I., Schwope, A. D., Lamer, G., et al. 2020, A&A, 641, A137, doi: 10.1051/0004-6361/202037706
2020 doi
-
[121]
I., & Benn, C
Tuccillo, D., Gonz´ alez-Serrano, J. I., & Benn, C. R. 2015, MNRAS, 449, 2818, doi: 10.1093/mnras/stv472
2015 doi
-
[122]
2013, A&A, 550, A71, doi: 10.1051/0004-6361/201220443
Vagnetti, F., Antonucci, M., & Trevese, D. 2013, A&A, 550, A71, doi: 10.1051/0004-6361/201220443
2013 doi
-
[123]
2010, A&A, 519, A17, doi: 10.1051/0004-6361/201014320 Vanden Berk, D
Vagnetti, F., Turriziani, S., Trevese, D., & Antonucci, M. 2010, A&A, 519, A17, doi: 10.1051/0004-6361/201014320 Vanden Berk, D. E., Richards, G. T., Bauer, A., et al. 2001, AJ, 122, 549, doi: 10.1086/321167
2010 doi
-
[124]
N., & Schneider, D
Vignali, C., Brandt, W. N., & Schneider, D. P. 2003, AJ, 125, 433, doi: 10.1086/345973
2003 doi
-
[125]
N., Schneider, D
Vignali, C., Brandt, W. N., Schneider, D. P., & Kaspi, S. 2005, AJ, 129, 2519, doi: 10.1086/430217
2005 doi
-
[126]
Walter, R., & Fink, H. H. 1993, A&A, 274, 105
1993
-
[127]
N., et al
Wang, C., Luo, B., Brandt, W. N., et al. 2022, ApJ, 936, 95, doi: 10.3847/1538-4357/ac886e
2022 doi
-
[128]
N., Luo, B., et al
Wang, S., Brandt, W. N., Luo, B., et al. 2024, ApJ, 974, 2, doi: 10.3847/1538-4357/ad7589
2024 doi
-
[129]
A., Coriat, M., Traulsen, I., et al
Webb, N. A., Coriat, M., Traulsen, I., et al. 2020, A&A, 641, A136, doi: 10.1051/0004-6361/201937353
2020 doi
-
[130]
J., Tananbaum, H., Worrall, D
Wilkes, B. J., Tananbaum, H., Worrall, D. M., et al. 1994, ApJS, 92, 53, doi: 10.1086/191959
1994 doi
-
[131]
2004, A&A, 421, 913, doi: 10.1051/0004-6361:20040525
Wolf, C., Meisenheimer, K., Kleinheinrich, M., et al. 2004, A&A, 421, 913, doi: 10.1051/0004-6361:20040525
2004 doi
-
[132]
N., Anderson, S
Wu, J., Brandt, W. N., Anderson, S. F., et al. 2012, ApJ, 747, 10, doi: 10.1088/0004-637X/747/1/10
2012 doi
-
[133]
Xue, Y. Q. 2017, NewAR, 79, 59, doi: 10.1016/j.newar.2017.09.002
2017 doi
-
[134]
N., Luo, B., et al
Yang, G., Brandt, W. N., Luo, B., et al. 2016, ApJ, 831, 145, doi: 10.3847/0004-637X/831/2/145
2016 doi
-
[135]
2023, ApJS, 264, 9, doi: 10.3847/1538-4365/ac9ea8
Yang, Q., & Shen, Y. 2023, ApJS, 264, 9, doi: 10.3847/1538-4365/ac9ea8
2023 doi
-
[136]
2017, AJ, 154, 269, doi: 10.3847/1538-3881/aa943c Y` eche, C., Petitjean, P., Rich, J., et al
Yang, Q., Wu, X.-B., Fan, X., et al. 2017, AJ, 154, 269, doi: 10.3847/1538-3881/aa943c Y` eche, C., Petitjean, P., Rich, J., et al. 2010, A&A, 523, A14, doi: 10.1051/0004-6361/200913508
2017 doi
-
[137]
2010, ApJ, 708, 1388, doi: 10.1088/0004-637X/708/2/1388
Young, M., Elvis, M., & Risaliti, G. 2010, ApJ, 708, 1388, doi: 10.1088/0004-637X/708/2/1388
2010 doi
-
[138]
2011, Scientia Sinica Physica, Mechanica & Astronomica, 41, 1441, doi: 10.1360/132011-961 25
Zhan, H. 2011, Scientia Sinica Physica, Mechanica & Astronomica, 41, 1441, doi: 10.1360/132011-961 25
2011 doi
-
[139]
N., et al
Zhang, Z., Luo, B., Brandt, W. N., et al. 2023, ApJ, 954, 159, doi: 10.3847/1538-4357/ace7c2
2023 doi
-
[140]
C., Xue, Y
Zheng, X. C., Xue, Y. Q., Brandt, W. N., et al. 2017, ApJ, 849, 127, doi: 10.3847/1538-4357/aa9378
2017 doi
-
[141]
N., Zou, F., et al
Zhu, S., Brandt, W. N., Zou, F., et al. 2023, MNRAS, 522, 3506, doi: 10.1093/mnras/stad1178
2023 doi
-
[142]
F., Brandt, W
Zhu, S. F., Brandt, W. N., Luo, B., et al. 2020, MNRAS, 496, 245, doi: 10.1093/mnras/staa1411
2020 doi
-
[143]
N., Chen, C.-T., et al
Zou, F., Brandt, W. N., Chen, C.-T., et al. 2022, ApJS, 262, 15, doi: 10.3847/1538-4365/ac7bdf
2022 doi
Reviewed August 11, 2026 · model on record in the stance chip above.
Discussion (0). Continue with ORCID to comment.