REVIEW 3 major objections 5 minor 78 references
Baryonic Ecosystem in Galaxies (BEINGMgII). Host Galaxies of Ultra-strong MgII Absorbers in Subaru Hyper Suprime-Cam Survey
T0 review · 3 major / 5 minor · reviewed 2026-08-11 · deepseek-v4-flash
Pith's one-line read The paper identifies 136 faint host galaxies for ultra-strong Mg II absorbers at small impact parameters and argues that the gas traces disks and winds in normal star-forming galaxies.
desk verdict Largest USMgII host sample to date, but 63% of hosts rest on photo-z matches that the paper never shows are clean; still worth refereeing. read the letter →
The pith
A machine-rendered reading of the paper's core claim, the machinery that carries it, and where it could break.
The reading
What carries the argument
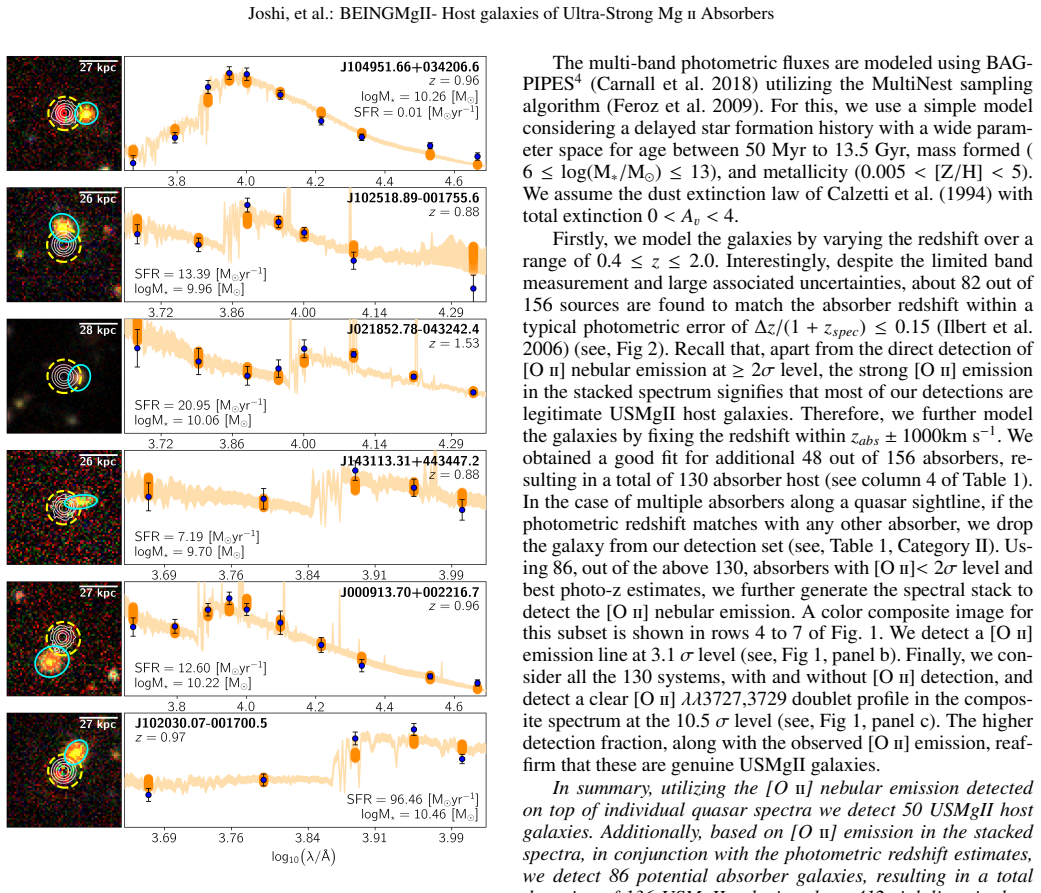
The machinery that carries the argument is the host-identification pipeline: model and subtract the quasar point spread function in deep HSC images, stack the bands, extract sources at 3$\sigma$ within the SDSS fiber radius, fit each candidate with the BAGPIPES SED code at or near the absorber redshift, and search the coadded SDSS spectrum for [O II] $\lambda\lambda3727,3729$ emission at $z_{\rm abs}$. Individual [O II] detections at $\ge 2\sigma$ anchor 50 hosts; the remaining 86 are assigned by photometric redshift match within $\Delta z/(1+z)\le0.15$ together with a stacked [O II] detection at $3.1\sigma$. The geometric part of the argument is carried by the azimuthal angle $\phi$ between the quasar sightline and the galaxy major axis, measured from Sersic fits to galaxies with ellipticity $e>0.2$; splitting the sample into $\phi<30^\circ$ ('disk') and $\phi>50^\circ$ ('wind') subsets is what produces the bimodal distribution and the contrasting $W_{2796}$--$\rho$ behavior.
What would settle it
A decisive test is to obtain deep rest-frame optical spectra (targeting [O II] or H$\alpha$) for the 86 galaxies classified as hosts only on photometric redshift and count how many show emission at the absorber redshift; if the confirmed fraction drops well below the ~80% implied by the stacked detection, chance alignment contaminates the sample and the claimed geometry results lose their footing.
Extended reading notes
Core claim
The paper's central claim is that a statistically significant fraction of ultra-strong Mg II absorbers are hosted by faint galaxies at small impact parameters: 136 bona fide hosts along 412 quasar sightlines, with a median impact parameter of 11.4 kpc and a 38% detection rate when at least four optical passbands are available. The hosts span stellar masses $8.65 \le \log M_\star/M_\odot \le 11.67$ with an average star formation rate of $30.7\,M_\odot\,\mathrm{yr}^{-1}$, and they lie on the main sequence of star-forming galaxies (21% are starbursts, and all meet the SFR threshold for launching strong outflows). Geometrically, the absorbers prefer the major and minor axes of their hosts: among 40 systems with robust position angles, 52% lie within 30° of the minor axis and 30% within 30° of the major axis, and the strongest absorbers ($W_{2796}>4$ Å) all belong to the minor-axis 'wind' subset. The wind subset shows near-constant $W_{2796}$ out to $\sim$23 kpc while the disk subset shows smaller scatter, which the paper argues explains the large scatter in the classical $W_{2796}$--impact-parameter anti-correlation. Non-zero [O II] emission along sightlines with no detected stellar counterpart further suggests that some absorbers arise in galaxies fainter than the image depth.
Load-bearing premise
The load-bearing premise is that a galaxy seen near the quasar is genuinely the absorber host when its photometric redshift agrees with the absorber redshift within $\Delta z/(1+z)\le0.15$, even though 86 of the 136 hosts have no individual spectroscopic confirmation; if a large fraction of these are chance alignments, the detection rate, the host mass/SFR distributions, and the disk/wind geometry results would be biased.
Editorial extensions
If this is right
- If the 38% detection rate holds, the median impact parameter of 11.4 kpc makes ultra-strong Mg II absorption a kiloparsec-scale phenomenon rather than a diffuse halo phenomenon.
- The main-sequence nature of the hosts means $W_{2796}\ge3$ Å can be produced by moderate star formation, and the 21% starburst fraction bounds how much extreme star formation contributes to the class.
- The bimodal azimuthal distribution implies that integral-field spectrograph surveys should see biconical outflows along the minor axes and co-rotating gas along the major axes of USMgII hosts.
- The wind subset's flat $W_{2796}$ with impact parameter and the factor-three overdensity within 50 kpc require both outflows and group environments in models of the strongest Mg II absorbers.
- The non-zero [O II] along 'clear' sightlines suggests a population of host galaxies fainter than $r\sim26$ that deeper imaging or spectroscopy should reveal.
Reading between the lines
- A statistical test the paper does not perform: place random HSC sources at the same impact parameters and ask what fraction would match the absorber redshift within $\Delta z/(1+z)\le0.15$; that would quantify the chance-alignment contamination in the 86 photometric-only hosts.
- If the wind-subset interpretation is right, the SDSS spectra of those systems should show broader and more asymmetric Mg II profiles than the disk subset; a line-profile analysis of the existing spectra would be a cheap, immediate check.
- The 'dark galaxy' candidates along clear sightlines connect naturally to the low-mass satellites that simulations predict account for a large fraction of absorbers; targeted narrow-band [O II] or integral-field searches around those quasars could find them directly.
- The photo-z matching criterion itself is likely redshift- and mass-dependent, so the claimed host fractions should be re-derived in narrow redshift bins once spectroscopic confirmation is available.
Editorial analysis
A structured set of objections, weighed in public.
Referee Report
Summary. The paper searches for host galaxies of ultra-strong Mg II absorbers (W2796 >= 3 Å) at small impact parameters (5–23 kpc) using deep Hyper Suprime-Cam imaging and SDSS spectroscopy. From 418 absorbers, the authors identify 50 galaxies through individual [O II] emission at >= 2σ and add 86 further candidates using BAGPIPES SED fits with photometric redshifts matched to the absorber redshift, or with redshift fixed to z_abs, yielding a total of 136 'bona fide' hosts. They report a ~38% detection rate, typical star-forming main-sequence host properties (21% starbursts), a preference for absorption along galaxy major and minor axes, a W2796–impact parameter relation with a wind/disk dichotomy, and an overdensity of galaxies around USMgII sightlines. The paper argues that USMgII absorbers trace disk gas and large-scale outflows, with some systems possibly hosted by unseen faint galaxies.
Significance. If the host identifications are reliable, this is one of the largest samples of ultra-strong Mg II absorber hosts in the small-impact-parameter regime, and the stacking analysis plus the public catalog would be valuable for future studies of CGM gas flows. The direct [O II] detections (50 systems) and the high-significance stacked [O II] signal for the full host sample are solid observational results. The paper also uses a carefully constructed control sample for the environmental overdensity measurement. However, the central claim that the SED-fitted sample of 130 galaxies represents genuine USMgII hosts rests on a photo-z matching procedure that has not been validated against a control field, and several of the physical conclusions (main-sequence offset, starburst fraction, wind/disk geometry) depend on this same SED-fitted sample. The statistical evidence for the geometric bimodality is also moderate (N≈40, KS P=0.084). With appropriate robustness tests and a clearer separation of secure and candidate hosts, the paper would make a solid contribution.
major comments (3)
- [Sec. 3.3 / Table 1] The 'bona fide' host sample includes 86 systems with individual [O II] below 2σ that are accepted based on a photo-z match within Δz/(1+z) ≤ 0.15 or a z-fixed SED fit. With only 4–5 HSC bands and sparse, shallow NIR data, this tolerance is broad (Δz ≈ 0.3 at z = 1), and the search radius of 1.5″ admits a non-negligible prior of unrelated faint galaxies. The stacked [O II] detection at 3.1σ for this subset does not exclude large contamination: even if only ~40–60% of the candidates are real, a stack of the real members could still reach a similar significance. The paper should compare the photo-z-only subset with the 50 direct detections in terms of redshift distribution, stellar mass, SFR, and azimuthal-angle distribution, and should estimate the chance-alignment rate using random quasar positions. Without this, the physical results in Sections 4.2–4.4, which use all 130 SED-fitted galaxies, may be biased by contamination.
- [Sec. 4.4 / Fig. 7] The claim that USMgII absorbers preferentially align along the major and minor axes rests on a small subsample (40 galaxies with ellipticity e>0.2, 38 with reliable PA) and a KS test between the 'wind' and 'disk' distributions that gives P=0.084, i.e., not significant at the usual threshold. The binning into 30-degree intervals with 30%, 52%, and 18% is suggestive but no significance level is quoted for the departure from a uniform distribution. The thresholds α≤30° and α≥50° are chosen post hoc and not varied; the paper should test the robustness of the bimodality to these thresholds and to the inclusion of the 10 additionally incorporated MEGAFLOW systems.
- [Sec. 4.3 / Fig. 6] The W2796–ρ analysis uses a literature compilation with heterogeneous selection functions and redshift ranges, and the wind/disk subsets are separated by arbitrary azimuthal-angle cuts. The quoted difference in mean W2796 (3.59±0.08 Å for wind versus 3.28±0.06 Å for disk) is small relative to the scatter, and no significance test for the difference between the two subsets is given. Moreover, because most of the USMgII galaxies in this figure come from the photo-z-selected sample, any systematic error in the host identifications propagates directly into the claimed wind/disk dichotomy. The authors should report a KS or rank-sum test between the wind and disk W2796 distributions and should repeat the fit excluding the photo-z-only candidates.
minor comments (5)
- [Sec. 4.1 / Fig. 3] The text reports both 'about 40%' and 'a detection rate of 38%' for the host detection rate; the denominator (all HSC-covered sightlines with 4+ passbands, or those with a detected potential host) should be stated unambiguously.
- [Sec. 4.2] The phrase 'average logM⋆ of 9.90 M⊙' should read 'average log(M⋆/M⊙) = 9.90', and the quoted average SFR of 30.72 M⊙ yr−1 should be accompanied by a dispersion or uncertainty.
- [Fig. 5] The caption mentions 'shaded and hatched regions' but does not identify which region corresponds to the 1σ confidence interval of the main-sequence fit or to the starburst definition; please clarify.
- [Table 1] The summary counts are hard to reconcile: 120 systems have [O II] < 2σ among the 170 within 1.5″, yet categories IB, II, and IIIB sum to 120 only if one reads the table carefully; a brief note explaining the column logic would improve readability.
- [Sec. 3.2] The 2.8σ [O II] detection along 'clear' sightlines is marginal; the interpretation of this signal as evidence of faint or dark galaxies should be presented as tentative, especially given the possibility of extended [O II] from a galaxy group or a distant source.
Circularity Check
No significant circularity: the host-galaxy SED parameters are measured after sample selection, not used to define the selection, and the stacked [OII] check is a post-hoc validation rather than a fitted input.
full rationale
The paper's central claims—detection rate, main-sequence/starburst fraction, and wind/disk azimuthal bimodality—are measurements made on a host-galaxy sample, not quantities that reduce by construction to the selection inputs. The host catalogue combines 50 individual [OII] detections with 86 objects selected via BAGPIPES photometric-redshift agreement or a good z-fixed SED fit. The derived stellar masses and SFRs do not enter the selection criterion: an object is classified as a host based on redshift agreement or fit quality, not on its resulting SFR or mass. The 3.1-sigma [OII] stack for the 86 photo-z-selected objects is computed after sample definition (Sec. 3.3: 'Using 86, out of the above 130, absorbers with [Oii]<2 sigma level and best photo-z estimates, we further generate the spectral stack'), so it is a consistency check, not a fitted input. The abstract phrase 'Utilizing the [OII] emission from the stacked spectrum... we further identify 86 galaxies' slightly misstates the chronological order, but the body text makes clear the stack validates rather than defines the subset. The W2796-rho relation is fitted to external literature samples (MAGIICAT, MEGAFLOW, MAGG, 3D-HST, Guha & Srianand), and the USMgII points are compared against it, not fitted to produce the conclusion. The wind/disk separation is a binning of measured azimuthal angles, and the associated W2796 comparisons are direct observations. Self-citations (e.g., Joshi et al. 2017b, 2018) support the established strong-MgII/[OII] connection and are not load-bearing. The photo-z contamination concern raised by the skeptical reader is a real robustness and correctness risk, but it is selection bias, not logical circularity: a contaminated sample would bias the measurements without making any derived quantity equal to its own input by construction. No load-bearing uniqueness claims, ansatz-by-citation, or renamed-known-result steps are present.
Assumptions & free parameters
free parameters (6)
- log-linear W2796-rho fit offset alpha =
alpha = 0.628 (+0.021/-0.019)
- log-linear W2796-rho slope beta =
beta = -0.018 (+0.001/-0.001)
- SED model parameters (stellar mass, SFR, age, metallicity, Av) =
log M* 8.65-11.67 solar masses; average SFR 30.72 M_sun/yr
- photo-z matching tolerance =
Delta z / (1+z) <= 0.15
- wind/disk azimuthal angle thresholds =
phi > 50 deg wind, phi < 30 deg disk
- ellipticity threshold =
e > 0.2
assumptions (5)
- domain assumption Flat LCDM cosmology with H0=70 km/s/Mpc, Omega_m=0.3, Omega_Lambda=0.7
- domain assumption Quasar light can be modeled as a PSF plus a Sersic host profile; residuals after subtraction are attributed to real sources
- domain assumption If at least 2Re of a candidate galaxy lies within the 1.5 arcsec SDSS/BOSS fiber, [O II] emission from the galaxy will appear in the quasar spectrum at z_abs
- domain assumption A source with photometric redshift matching z_abs within Delta z/(1+z)<=0.15 is physically associated with the absorber
- domain assumption Median stacking of spectra preserves [O II] flux at the absorber redshift
invented entities (1)
-
Unseen faint or dark galaxies as hosts of USMgII absorbers along clear sightlines
Cite this review
Pith. "Pith review of Baryonic Ecosystem in Galaxies (BEINGMgII). Host Galaxies of Ultra-strong MgII Absorbers in Subaru Hyper Suprime-Cam Survey." pith.science (2026). https://pith.science/paper/2VJI4QEF
@misc{pith2026241207835,
  author       = {Pith},
  title        = {Pith review of: Baryonic Ecosystem in Galaxies (BEINGMgII). Host Galaxies of Ultra-strong MgII Absorbers in Subaru Hyper Suprime-Cam Survey},
  year         = {2026},
  howpublished = {\url{https://pith.science/paper/2VJI4QEF}},
  note         = {Machine review of arXiv:2412.07835}
}
abstract
We study the galaxies hosting ultra-strong MgII (USMgII) absorbers at small impact parameters of $\sim$2" (5 - 20 kpc), spanning a redshift range of $0.4 \le z \le 1.7$, using deep, high-resolution images from Hyper Suprime-Cam Subaru Strategic Survey and spectra from SDSS survey. From a total of 418 USMgII absorbers with $W_{2796}\ \ge 3 \mathring{A}$, along 412 quasar sightlines, we detect 50 galaxies based on [O II] $\lambda\lambda$3727,3729 nebular emission detected at $\ge 2\sigma$ level. Utilizing the [O II] emission from the stacked spectrum and employing the best-fit galaxy SED template, we further identify 86 galaxies, leading to a total of 136 bona fide USMgII galaxies. With a prerequisite of having a minimum of four HSC passbands available, we find a detection rate of $\sim$38% at an average impact parameter of 11.4 kpc. We find that galaxies hosting USMgII systems are typically star-forming main sequence galaxies, with 21% exhibiting a starburst nature. The non-zero [O II] emission along the `clear' sightlines, with no stellar counterpart, hints that the USMgII absorbers may likely emanate from the unseen faint galaxies near the quasar. The USMgII absorbers preferentially align along the major and minor axes of the galaxy, which suggests that they originate in the disk or large-scale wind. We show that the distribution of $W_{2796}$ as a function of impact parameter indicates a discernible radial dependence for the `disk' and `wind' subsets, with the observed large scatter in $W_{2796}$ potentially attributed to large-scale outflows. The quasar sightline hosting USMgII systems show a factor three higher galaxy surface density at impact parameters of $\lesssim 50$kpc, highlights the multiple pathways giving rise to USMgII absorption.
Figures


Figures from the paper (6 more)


Reference graph
Works this paper leans on
-
[1]
N., Adelman-McCarthy, J
Abazajian, K. N., Adelman-McCarthy, J. K., Agüeros, M. A., et al. 2009, ApJS, 182, 543
2009
-
[2]
2022, PASJ, 74, 247
Aihara, H., AlSayyad, Y ., Ando, M., et al. 2022, PASJ, 74, 247
2022
-
[3]
D., Allende Prieto, C., et al
Alam, S., Albareti, F. D., Allende Prieto, C., et al. 2015, ApJS, 219, 12
2015
- [4]
-
[5]
& Arnouts, S
Bertin, E. & Arnouts, S. 1996, A&AS, 117, 393
1996
-
[6]
2002, in Astronomical Society of the Pacific Conference Series, V ol
Bertin, E., Mellier, Y ., Radovich, M., et al. 2002, in Astronomical Society of the Pacific Conference Series, V ol. 281, Astronomical Data Analysis Software and Systems XI, ed. D. A. Bohlender, D. Durand, & T. H. Handley, 228
2002
-
[7]
Bielby, R., Crighton, N. H. M., Fumagalli, M., et al. 2017, MNRAS, 468, 1373
2017
-
[8]
I., Grogin, N., & Koekemoer, A
Bisigello, L., Caputi, K. I., Grogin, N., & Koekemoer, A. 2018, A&A, 609, A82
work page 2018
Show all 78 references
-
[9]
A., Churchill, C
Bond, N. A., Churchill, C. W., Charlton, J. C., & V ogt, S. S. 2001, ApJ, 562, 641
2001
-
[10]
J., Knobel, C., et al
Bordoloi, R., Lilly, S. J., Knobel, C., et al. 2011, ApJ, 743, 10 Bouché, N., Hohensee, W., Vargas, R., et al. 2012, MNRAS, 426, 801 Bouché, N., Murphy, M. T., Péroux, C., et al. 2007, ApJ, 669, L5
2011
-
[11]
L., & Storchi-Bergmann, T
Calzetti, D., Kinney, A. L., & Storchi-Bergmann, T. 1994, ApJ, 429, 582
1994
-
[12]
C., McLure, R
Carnall, A. C., McLure, R. J., Dunlop, J. S., & Davé, R. 2018, Monthly Notices of the Royal Astronomical Society, 480, 4379–4401
2018
-
[13]
L., Fielding, D
Carr, C., Bryan, G. L., Fielding, D. B., Pandya, V ., & Somerville, R. S. 2023, ApJ, 949, 21
2023
-
[14]
D., et al
Chen, H.-W., Boettcher, E., Johnson, S. D., et al. 2019, ApJ, 878, L33
2019
-
[15]
E., Gauthier, J.-R., et al
Chen, H.-W., Helsby, J. E., Gauthier, J.-R., et al. 2010, ApJ, 714, 1521
2010
-
[16]
F., Genel, S., et al
DeFelippis, D., Bouché, N. F., Genel, S., et al. 2021, ApJ, 923, 56
2021
-
[17]
J., Lang, D., et al
Dey, A., Schlegel, D. J., Lang, D., et al. 2019, AJ, 157, 168
2019
-
[18]
2023, MNRAS, 522, 535
Dutta, R., Fossati, M., Fumagalli, M., et al. 2023, MNRAS, 522, 535
2023
-
[19]
2020, MNRAS, 499, 5022
Dutta, R., Fumagalli, M., Fossati, M., et al. 2020, MNRAS, 499, 5022
2020
-
[20]
2018, A&A, 616, A110
Elbaz, D., Leiton, R., Nagar, N., et al. 2018, A&A, 616, A110
2018
-
[21]
2018, A&A, 617, A62
Feltre, A., Bacon, R., Tresse, L., et al. 2018, A&A, 617, A62
2018
-
[22]
P., & Bridges, M
Feroz, F., Hobson, M. P., & Bridges, M. 2009, Monthly Notices of the Royal Astronomical Society, 398, 1601–1614
2009
-
[23]
2019, MNRAS, 484, 2212
Fossati, M., Fumagalli, M., Gavazzi, G., et al. 2019, MNRAS, 484, 2212
2019
-
[24]
2013, MNRAS, 432, 1444
Gauthier, J.-R. 2013, MNRAS, 432, 1444
2013
-
[25]
Guha, L. K. & Srianand, R. 2023, MNRAS, 519, 3319
2023
-
[26]
K., Srianand, R., Dutta, R., et al
Guha, L. K., Srianand, R., Dutta, R., et al. 2022, MNRAS, 513, 3836
2022
-
[27]
K., Srianand, R., & Petitjean, P
Guha, L. K., Srianand, R., & Petitjean, P. 2024, MNRAS, 527, 5075
2024
-
[28]
F., et al
Guo, Y ., Bacon, R., Bouché, N. F., et al. 2023, Nature, 624, 53
2023
-
[29]
M., Lehnert, M
Heckman, T. M., Lehnert, M. D., Strickland, D. K., & Armus, L. 2000, ApJS, 129, 493
2000
-
[30]
H., Martin, C
Ho, S. H., Martin, C. L., & Schaye, J. 2020, ApJ, 904, 76
2020
-
[31]
A., et al
Huang, Y .-H., Chen, H.-W., Shectman, S. A., et al. 2021, MNRAS, 502, 4743
2021
-
[32]
J., et al
Ilbert, O., Arnouts, S., McCracken, H. J., et al. 2006, A&A, 457, 841
2006
-
[33]
2020, PASJ, 72, 83
Ishino, T., Matsuoka, Y ., Koyama, S., et al. 2020, PASJ, 72, 83
2020
-
[34]
Jenkins, E. B. 1986, ApJ, 304, 739
1986
-
[35]
2017b, MNRAS, 471, 1910
Joshi, R., Srianand, R., Petitjean, P., & Noterdaeme, P. 2017b, MNRAS, 471, 1910
1910
-
[36]
2018, MNRAS, 476, 210
Joshi, R., Srianand, R., Petitjean, P., & Noterdaeme, P. 2018, MNRAS, 476, 210
2018
-
[37]
G., Churchill, C
Kacprzak, G. G., Churchill, C. W., Evans, J. L., Murphy, M. T., & Steidel, C. C. 2011, MNRAS, 416, 3118
2011
-
[38]
G., Churchill, C
Kacprzak, G. G., Churchill, C. W., & Nielsen, N. M. 2012, ApJ, 760, L7
2012
-
[39]
G., Martin, C
Kacprzak, G. G., Martin, C. L., Bouché, N., et al. 2014, ApJ, 792, L12
2014
-
[40]
E., Forster Schreiber, N
Kehoe, E., Shapley, A. E., Forster Schreiber, N. M., et al. 2024, arXiv e-prints, arXiv:2406.07621
2024 arXiv
-
[41]
2014, ApJ, 795, 31
Lan, T.-W., Ménard, B., & Zhu, G. 2014, ApJ, 795, 31
2014
-
[42]
Lan, T.-W. & Mo, H. 2018, ApJ, 866, 36
2018
-
[43]
F., Creech, S., Brammer, G., et al
Lundgren, B. F., Creech, S., Brammer, G., et al. 2021, ApJ, 913, 50
2021
-
[44]
2017, ApJ, 846, 4
Mas-Ribas, L., Miralda-Escudé, J., Pérez-Ràfols, I., et al. 2017, ApJ, 846, 4
2017
-
[45]
2012, AJ, 144, 159 Ménard, B., Wild, V ., Nestor, D., et al
Matsuoka, Y ., Ienaka, N., Oyabu, S., Wada, K., & Takino, S. 2012, AJ, 144, 159 Ménard, B., Wild, V ., Nestor, D., et al. 2011, MNRAS, 417, 801
2012
-
[46]
Murray, N., Ménard, B., & Thompson, T. A. 2011, ApJ, 735, 66
2011
-
[47]
2019, MNRAS, 490, 3234
Nelson, D., Pillepich, A., Springel, V ., et al. 2019, MNRAS, 490, 3234
2019
-
[48]
B., Johnson, B
Nestor, D. B., Johnson, B. D., Wild, V ., et al. 2011, MNRAS, 412, 1559
2011
-
[49]
B., Turnshek, D
Nestor, D. B., Turnshek, D. A., Rao, S. M., & Quider, A. M. 2007, ApJ, 658, 185
2007
-
[50]
M., Churchill, C
Nielsen, N. M., Churchill, C. W., & Kacprzak, G. G. 2013, ApJ, 776, 115
2013
-
[51]
2014, A&A, 566, A24
Noterdaeme, P., Petitjean, P., Pâris, I., et al. 2014, A&A, 566, A24
2014
-
[52]
2010, MNRAS, 403, 906
Noterdaeme, P., Srianand, R., & Mohan, V . 2010, MNRAS, 403, 906
2010
-
[53]
Oppenheimer, B. D. & Davé, R. 2006, MNRAS, 373, 1265 Péroux, C., Nelson, D., van de V oort, F., et al. 2020, MNRAS, 499, 2462 Péroux, C., Rahmani, H., Quiret, S., et al. 2017, MNRAS, 464, 2053
2006
-
[54]
L., Rupke, D
Perrotta, S., Coil, A. L., Rupke, D. S. N., et al. 2024, arXiv e-prints, arXiv:2409.10013
2024 arXiv
-
[55]
2023, MNRAS, 519, 1526
Popesso, P., Concas, A., Cresci, G., et al. 2023, MNRAS, 519, 1526
2023
-
[56]
M., Turnshek, D
Rao, S. M., Turnshek, D. A., & Nestor, D. B. 2006, ApJ, 636, 610
2006
-
[57]
2018, ApJ, 853, 95
Moustakas, J. 2018, ApJ, 853, 95
2018
-
[58]
Rubin, K. H. R., Juarez, C., Cooksey, K. L., et al. 2022, ApJ, 936, 171
2022
-
[59]
Rubin, K. H. R., Prochaska, J. X., Koo, D. C., Phillips, A. C., & Weiner, B. J. 2010, ApJ, 712, 574
2010
-
[60]
Rupke, D. S. N., Coil, A., Geach, J. E., et al. 2019, Nature, 574, 643
2019
-
[61]
2021, kasperschmidt/FELIS: FELIS version 1.0
Schmidt, K. 2021, kasperschmidt/FELIS: FELIS version 1.0
2021
-
[62]
F., Zabl, J., et al
Schroetter, I., Bouché, N. F., Zabl, J., et al. 2019, MNRAS, 490, 4368
2019
-
[63]
1996, ApJ, 462, 643
Srianand, R. 1996, ApJ, 462, 643
1996
-
[64]
C., Erb, D
Steidel, C. C., Erb, D. K., Shapley, A. E., et al. 2010, ApJ, 717, 289
2010
-
[65]
& Price, K
Storn, R. & Price, K. 1997, Journal of Global Optimization, 11, 341
1997
-
[66]
A., Whichard, Z
Straka, L. A., Whichard, Z. L., Kulkarni, V . P., et al. 2013, MNRAS, 436, 3200
2013
-
[67]
Suresh, J., Nelson, D., Genel, S., Rubin, K. H. R., & Hernquist, L. 2019, MN- RAS, 483, 4040
2019
-
[68]
A., Heckman, T
Tremonti, C. A., Heckman, T. M., Kauffmann, G., et al. 2004, ApJ, 613, 898
2004
-
[69]
S., & Werk, J
Tumlinson, J., Peeples, M. S., & Werk, J. K. 2017, ARA&A, 55, 389 van der Wel, A., Franx, M., van Dokkum, P. G., et al. 2014, ApJ, 788, 28
2017
-
[70]
2005, ARA&A, 43, 769
Veilleux, S., Cecil, G., & Bland-Hawthorn, J. 2005, ARA&A, 43, 769
2005
-
[71]
E., Frisch, P
Welty, D. E., Frisch, P. C., Sonneborn, G., & York, D. G. 1999, ApJ, 512, 636
1999
-
[72]
2023, MNRAS, 523, 676
Weng, S., Péroux, C., Karki, A., et al. 2023, MNRAS, 523, 676
2023
-
[73]
2024, MNRAS, 527, 3494
Weng, S., Péroux, C., Ramesh, R., et al. 2024, MNRAS, 527, 3494
2024
-
[74]
J., et al
Wuyts, S., Franx, M., Cox, T. J., et al. 2009, ApJ, 696, 348
2009
-
[75]
G., Khare, P., Vanden Berk, D., et al
York, D. G., Khare, P., Vanden Berk, D., et al. 2006, MNRAS, 367, 945
2006
-
[76]
F., Schroetter, I., et al
Zabl, J., Bouché, N. F., Schroetter, I., et al. 2019, MNRAS, 485, 1961
2019
-
[77]
F., Wisotzki, L., et al
Zabl, J., Bouché, N. F., Wisotzki, L., et al. 2021, MNRAS, 507, 4294
2021
-
[78]
B., et al
Zibetti, S., Ménard, B., Nestor, D. B., et al. 2007, ApJ, 658, 161 Article number, page 12 of 12
2007
Reviewed August 11, 2026 · model on record in the stance chip above.
Discussion (0). Continue with ORCID to comment.