REVIEW 4 major objections 5 minor 1 cited by
Cluster dynamics in macroscopic photoactive particles
T0 review · 4 major / 5 minor · reviewed 2026-08-11 · deepseek-v4-flash
Pith's one-line read This paper claims that cluster stability in macroscopic photoactive particles is set by a single kinetic control parameter κ, with clusters dissolving above κcrit = 2√3/9 ≈ 0.385 or below a critical initial size.
desk verdict Solid experimental Letter with a genuine new prediction—critical initial cluster size—supported by a clean dissolution experiment; the main caveats are calibrated model mapping and an unmeasured zero-order desorption assumption, both addressable in revision. read the letter →
The pith
A machine-rendered reading of the paper's core claim, the machinery that carries it, and where it could break.
The reading
What carries the argument
The central object is the dimensionless adsorption–desorption balance $dn/d\tau = (1-n)\sqrt{n} - \kappa$. The adsorption term $(1-n)\sqrt{n}$ encodes the collision rate of free particles with a cluster: the gas density contributes $(1-n)$ and the cluster perimeter contributes $\sqrt{n}$, so larger clusters capture particles faster. The desorption term $\kappa$ is zero-order, treated as independent of cluster size. The balance curve $\kappa = (1-n)\sqrt{n}$ has a single maximum at $\kappa_{\mathrm{crit}} = 2\sqrt{3}/9$, which separates a regime where clusters can stabilize from one where every cluster decays, and the lower branch of the same curve fixes the minimum seed size needed for stable growth. This one-equation framework carries the entire phase diagram.
What would settle it
Measure the per-particle detachment rate for clusters of controlled size at fixed illumination: the model requires that this rate be independent of $N$, so a clear dependence on cluster size, such as scaling like $N^{-1/2}$, would refute the zero-order desorption assumption. Alternatively, prepare initial clusters with sizes straddling the predicted $n_0 \approx 0.33$ under the highest activity that still permits stable clusters and check that the dissolution probability drops sharply at that size.
Extended reading notes
Core claim
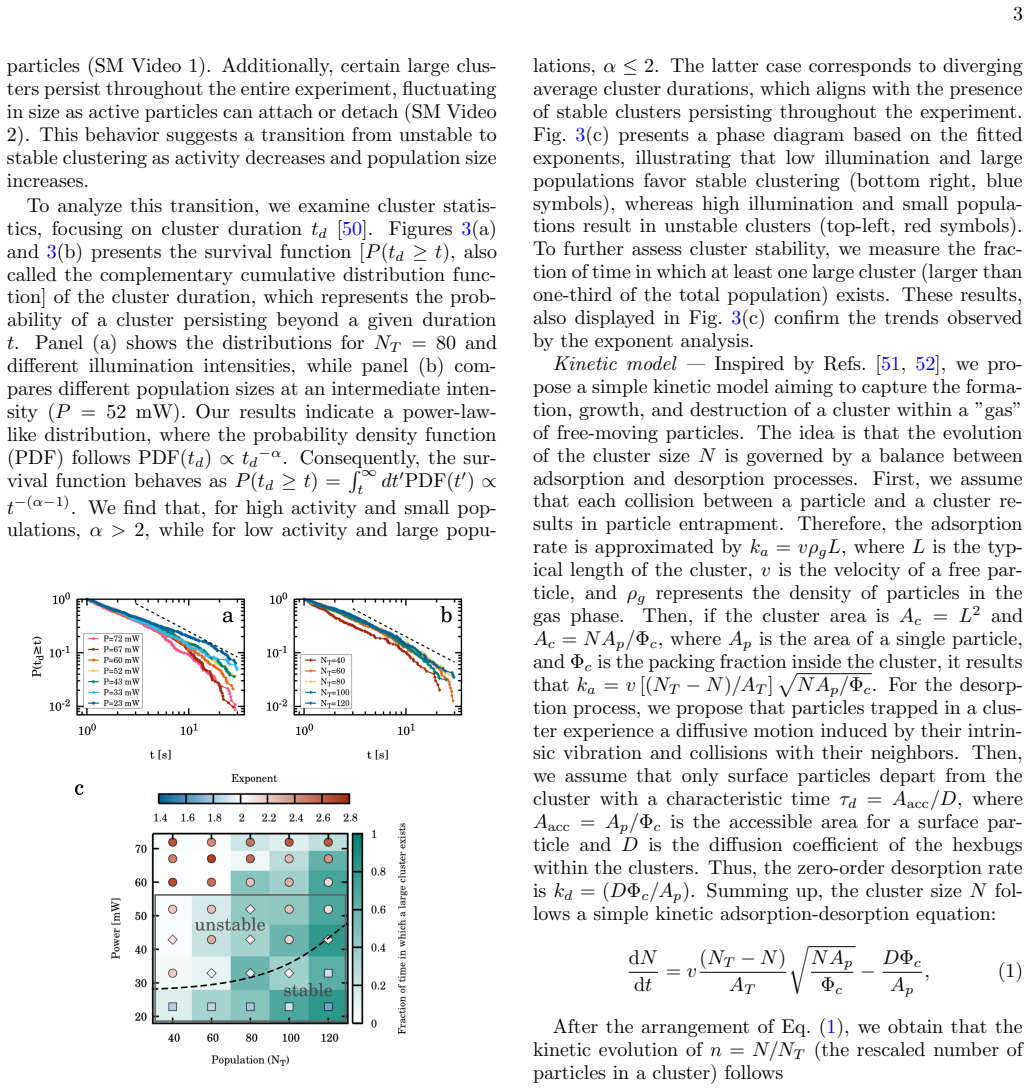
The authors establish a transition between unstable and stable clustering in a macroscopic active-matter system. By analyzing the survival functions of cluster durations, they find a power-law exponent $\alpha > 2$ (finite mean duration, unstable clusters) at high activity and small populations, and $\alpha \le 2$ (diverging mean duration, stable clusters) at low activity and large populations. They then derive a deterministic kinetic model, $dN/dt = v(N_T-N)/A_T\sqrt{NA_p/\Phi_c} - D\Phi_c/A_p$, which rescales to $dn/d\tau = (1-n)\sqrt{n} - \kappa$ with $\kappa = (\Phi_c^{3/2}A_T)/(A_p^{3/2}N_T^{3/2}) \cdot (D/v)$. The model predicts that above $\kappa_{\mathrm{crit}} = 2\sqrt{3}/9 \approx 0.3849$ all clusters disassociate, while below it a cluster must start above a size-dependent critical value $n_{\mathrm{crit}}(\kappa)$ to grow and stabilize. Controlled experiments, in which half of the arena is dark to grow a cluster and then the whole arena is illuminated to dissolve it, recover the predicted $\tanh^2$ growth curve and show the dissociation probability starting to fall near the predicted initial size $n_0 \approx 0.33$.
Load-bearing premise
The load-bearing premise is that particles leave a cluster at a constant rate independent of cluster size, so if small clusters actually lose surface particles faster than large ones the predicted stable phase and critical initial size would shift.
Editorial extensions
If this is right
- With the same arena and particles, lowering $D/v$ (lower light intensity) or raising the population $N_T$ moves the system below the critical $\kappa$, turning transient clustering into persistent clustering.
- A cluster that starts smaller than $n_{\mathrm{crit}}(\kappa)$ will dissolve even under conditions that otherwise support stable clustering, so assembly protocols must seed clusters above this threshold.
- For $\kappa < \kappa_{\mathrm{crit}}$, the model's nullcline $\kappa=(1-n)\sqrt{n}$ determines the final stable cluster size reached as $\tau \to \infty$, giving a quantitative prediction for the long-time cluster population.
- Switching illumination from low to high should reverse cluster growth along the dissociation branch of the kinetic equation, a prediction the authors confirm in controlled $N_T=100$ experiments.
- The cluster-duration statistics should shift from a power law with exponent $\alpha>2$ to $\alpha\le 2$ exactly where the control parameter crosses $\kappa_{\mathrm{crit}}$, linking the measured survival functions to the phase boundary.
Reading between the lines
- If the zero-order desorption term is the right caricature, the same model should transfer to other contact-driven active agents, such as vibrated granular matter or robot swarms, by reinterpreting $D$, $v$, and $\Phi_c$; the predicted critical value $\kappa_{\mathrm{crit}}$ would then be a universal number for this class of systems.
- Because $\kappa$ factors into geometry, population, and activity, an engineering prescription follows: choose the arena size and particle number so the system sits below $\kappa_{\mathrm{crit}}$, then use light gradients to seed clusters larger than $n_{\mathrm{crit}}$; this turns cluster stability into a programmable switch.
- The observation that boundary clustering persists at low activity even with inward-guiding walls points to a quantity the model does not yet contain: a wall-trapping time that could be measured by tracking single-particle residence times near the boundary, potentially extending the kinetic equation to spatially structured light fields.
Editorial analysis
A structured set of objections, weighed in public.
Referee Report
Summary. The paper studies cluster formation and dissolution in a macroscopic photoactive granular system: modified HEXBUG particles powered by photovoltaic cells under programmable illumination. For low light intensity (lower particle activity) and larger population sizes, clusters are stable; for high intensity and small populations, clusters dissolve. The authors measure cluster-duration survival functions, extract a power-law exponent alpha, and build a phase diagram in the (intensity, population-size) plane. They introduce a mean-field kinetic model in which a cluster grows by adsorption of free particles and shrinks by a zero-order desorption rate, giving dn/dtau = (1-n)n^{1/2} - kappa. The model predicts a critical kappa_crit and a critical initial cluster size ncrit. A dedicated experiment with a light-intensity switch is used to test the predicted growth law and the existence of a threshold initial size for dissolution around n0 ~ 0.33.
Significance. If the claims hold, the paper provides a simple, analytically tractable model for cluster stability in inertial dry active matter, together with a versatile experimental platform (light-controlled macroscopic particles) and a dedicated test of a nontrivial prediction (critical initial cluster size). The authors openly provide data and code, repeat experiments five-fold, and include robustness checks with different wall geometries. The model is not derived from the target data, and the dissolution experiment partially corroborates the central zero-order desorption assumption. The critical size prediction and phase diagram are meaningful qualitative results, but the quantitative comparison is weakened by a calibrated P-to-D/v mapping and by the absence of error bars on the experimental phase boundary.
major comments (4)
- [Kinetic model, SM Eq. (S2)] The zero-order desorption rate kd = D*Phi_c/A_p is the load-bearing assumption that generates the lower unstable fixed point and the critical initial cluster size ncrit. The paper does not directly measure kd as a function of cluster size N. The dissolution experiment in Fig. 5(e) provides indirect support, but alternative desorption forms kd(N) = a + b*N^{1/2} + c*N would shift or eliminate ncrit. The authors should either measure the detachment rate for clusters of controlled size or provide a robustness analysis showing that the predicted threshold is stable to plausible perimeter- and size-dependent desorption terms.
- [Results, Fig. 3(a-c)] The experimental phase diagram rests on the fitted power-law exponent alpha, but the paper reports no error bars, no fitting range, and no goodness-of-fit for the alpha values. The dashed boundary in Fig. 3(c) is drawn by eye, and the transition band alpha = 2 +/- 0.1 is arbitrary. Since the phase boundary is the central quantity the model is claimed to reproduce, the authors should provide confidence intervals for alpha (e.g., via bootstrap or by fitting over several t-ranges) and state a quantitative criterion for assigning stable/unstable phases.
- [Kinetic model, Fig. 4(b)] The mapping between the experimental light power P and the model parameter D/v is calibrated from the phase boundaries; the text states that 'based on the phase boundaries, one can establish a relation between these variables.' The agreement between Fig. 3(c) and Fig. 4(b) is therefore partly a fit rather than a parameter-free prediction. The model still makes a nontrivial qualitative prediction through the NT-dependence, but the claim of reproducing the phase space should be qualified, or the calibration should be anchored by independent measurements of D and v from the individual-particle characterization in SM Sec. V.
- [Dissolution experiment, Fig. 5(e)] The dashed line in Fig. 5(e) is called the prediction of the kinetic model for the critical cluster size, evaluated at 'the highest value of D/v that allows the development of stable clusters.' This choice sets kappa = kappa_crit, for which the model's lower stable size is ncrit = 1/3 by construction. The data showing a threshold near 0.33 are consistent, but this is not an independent test of the predicted numeric value. An independent estimate of D/v at the highest intensity, or a distribution of predicted thresholds from particle-level measurements, would make the comparison meaningful.
minor comments (5)
- [Kinetic model, near Eq. (3)] The expression for the association phase, nassoc(t) = (NT/N) tanh^2(1/2 sqrt(NT) (Ct + c)), appears to be a typo: the solution of dn/dtau = (1-n)n^{1/2} in rescaled time is n(t) = tanh^2(1/2 sqrt(NT) (Ct + c)) up to a constant determined by initial conditions. If the factor NT/N is intentional, the derivation should be shown.
- [Caption of Fig. 3(c)] The caption refers to 'the phase diagram obtained with the model [Fig. 4(c)]', but Fig. 4 contains only panels (a) and (b); the intended reference appears to be Fig. 4(b).
- [SM Sec. III] The text uses 'absorption rate' for ka, while 'adsorption' is the standard term for particle attachment to a cluster; the terminology should be made consistent.
- [Fig. 3(a,b)] The fitted power-law exponent alpha is not shown on the survival-function plots; adding fitted lines and the obtained alpha values for each curve would help the reader judge the quality of the power-law description.
- [SM Sec. IV] The wall-geometry comparison changes both the wall structure and the population size NT between panels; state explicitly that this is a qualitative robustness check rather than a controlled comparison of wall geometry alone.
Circularity Check
Phase-diagram 'reproduction' is partly a calibration of the unmeasured P↔D/v mapping, and the n0≈0.33 dissolution threshold is evaluated at a D/v chosen at the model's critical point; the growth-curve fit and functional-form predictions retain independent content.
-
fitted input called prediction
[Kinetic model section, paragraph after Eq. (3) and Fig. 4(b)]
"Importantly, while the populations of the experimental and theoretical phase diagrams are directly comparable, the correspondence between P and D/v is not straightforward. However, based on the phase boundaries, one can establish a relation between these variables."
The model's stability boundary is κ=κcrit, i.e. D/v ∝ N_T^{3/2} (Eq. (3) with κ=2√3/9). If the P↔D/v relation is fixed 'based on the phase boundaries', each experimental transition point (N_T,P) is assigned the model's boundary value D/v, so the model phase diagram in Fig. 4(b) is made to pass through the experimental boundary by construction. The claimed reproduction of the experimental phase space is therefore a calibration of the unmeasured activity mapping rather than an independent test of the model's N_T^{3/2} scaling; a flexible monotonic P↔D/v relation could be chosen to match the boundary points.
-
fitted input called prediction
[Dissociation experiment paragraph, Fig. 5(e)]
"Importantly, the value of n0 at which the probability starts to decay nicely resembles the value offered by the model if we consider the highest value of D/v that allows the development of stable clusters (0.33, dashed line)."
The dashed curve is the model's critical initial size ncrit at κ=κcrit, which is 1/3. The parameter D/v is not measured for the high-intensity illumination; it is selected as 'the highest value of D/v that allows the development of stable clusters', i.e. the model's marginal point. Evaluating the predicted threshold at this chosen parameter makes the n0≈0.33 match a consequence of placing the model at its critical value. The qualitative onset in the dissolution probability is still meaningful evidence for the zero-order desorption structure, but the quantitative 0.33 threshold is not a parameter-free prediction.
full rationale
The kinetic model itself is derived from explicit physical assumptions (adsorption rate ka=vρgL and zero-order desorption kd=DΦ_c/A_p) and is not defined in terms of the measured cluster durations or dissolution probabilities; there is no self-citation chain or uniqueness argument. The main circularity risk is the comparison protocol. Because D/v—the activity parameter of the model—is not measured, the paper sets the P↔D/v relation from the phase boundaries, so the 'reproduction' of the experimental phase diagram is in part a fit. Likewise, the dissolution threshold comparison uses the model at its critical D/v value, so the 0.33 line is a model-derived quantity evaluated at a calibrated parameter rather than a fully independent prediction. Offsetting this, the growth-curve collapse to n_assoc(t)=tanh²(...) is a genuine functional test with fitted prefactors, and the existence of a size-dependent dissolution threshold is a nontrivial qualitative consequence of the zero-order desorption form. Overall the central quantitative agreement is partially fitted, giving a moderate circularity score rather than a clean non-finding.
Assumptions & free parameters
free parameters (4)
- alpha (cluster duration power-law exponent) =
varies by condition; α≈1.6-3 (from Fig. 3)
- P-to-D/v calibration =
D/v = 1.45 cm at the NT=80 transition, e.g. D≈14.5 cm²/s for v=10 cm/s
- growth-curve fit parameters (NT, C, c) =
best NT≈50 (actual 100), C gives v≈6.8 cm/s
- cluster detection thresholds =
minimum 4 particles, minimum lifetime 1 s, 30% overlap, first 2 min removed
assumptions (5)
- ad hoc to paper Every collision between a free particle and a cluster results in entrapment.
- ad hoc to paper Desorption is zero-order with rate kd = DΦc/Ap, independent of cluster size.
- domain assumption Cluster geometry: Ac = L² and Ac = N Ap/Φc with constant packing fraction Φc.
- domain assumption Surface particle motion in clusters is diffusive with constant D.
- domain assumption Power-law tail with α<2 implies stable (diverging mean) clustering.
Cite this review
Pith. "Pith review of Cluster dynamics in macroscopic photoactive particles." pith.science (2026). https://pith.science/paper/5PBESWTQ
@misc{pith2026241214419,
  author       = {Pith},
  title        = {Pith review of: Cluster dynamics in macroscopic photoactive particles},
  year         = {2026},
  howpublished = {\url{https://pith.science/paper/5PBESWTQ}},
  note         = {Machine review of arXiv:2412.14419}
}
read the original abstract
We present an experimental study on the collective behavior of macroscopic self-propelled particles that are externally excited by light. This property allows testing the system response to the excitation intensity in a very versatile manner. We discover that for low excitation intensities, clustering at the boundaries is always present, even when this is prevented by implementing flower-shaped confining walls. For high excitation intensities, however, clusters are dissolved more or less easily depending on their size. Then, a thorough analysis of the cluster dynamics allows us to depict a phase diagram depending on the number of agents in the arena and the excitation intensity. To explain this, we introduce a simple kinetic model where cluster evolution is governed by a balance between adsorption and desorption processes. Interestingly, this simple model is able to reproduce the phase space observed experimentally.
Figures


Figures from the paper (2 more)


Forward citations
Cited by 1 Pith paper
-
Depinning and activated motion of chiral self-propelled robots
Driven chiral robots show a rotational depinning transition and a noise-induced creep regime that exactly match a tilted periodic potential model.
Reference graph
Works this paper leans on
-
[1]
Baconnier, O
P. Baconnier, O. Dauchot, V. D´ emery, G. D¨ uring, S. Henkes, C. Huepe, and A. Shee, Self-aligning polar active matter, Rev. Mod. Phys. 97, 015007 (2025)
2025
-
[2]
S. Palagi et al. , Structured light enables biomimetic swimming and versatile locomotion of photoresponsive soft microrobots, Nat. Mater. 15, 647 (2016)
work page 2016
-
[3]
W. Hu, G. Z. Lum, M. Mastrangeli, and M. Sitti, Small- scale soft-bodied robot with multimodal locomotion, Na- ture 554, 81 (2018)
work page 2018
-
[4]
T. Xu, J. Zhang, M. Salehizadeh, O. Onaizah, and E. Diller, Millimeter-scale flexible robots with pro- grammable three-dimensional magnetization and mo- tions, Sci. Robot. 4, eaav4494 (2019)
work page 2019
- [5]
-
[6]
M. Z. Miskin, A. J. Cortese, K. Dorsey, E. P. Espos- ito, M. F. Reynolds, Q. Liu, M. Cao, D. A. Muller, P. L. McEuen, and I. Cohen, Electronically integrated, mass-manufactured, microscopic robots, Nature 584, 557 (2020)
work page 2020
-
[7]
H. H. Wensink and H. L¨ owen, Aggregation of self- propelled colloidal rods near confining walls, Phys. Rev. E 78, 031409 (2008)
work page 2008
-
[8]
I. Buttinoni, J. Bialk´ e, F. K¨ ummel, H. L¨ owen, C. Bechinger, and T. Speck, Dynamical clustering and phase separation in suspensions of self-propelled colloidal particles, Phys. Rev. Lett. 110, 238301 (2013)
work page 2013
Show all 54 references
-
[9]
Palacci, S
J. Palacci, S. Sacanna, A. P. Steinberg, D. J. Pine, and P. M. Chaikin, Living crystals of light-activated colloidal surfers, Science 339, 936 (2013)
2013
-
[10]
Lozano, B
C. Lozano, B. Ten Hagen, H. L¨ owen, and C. Bechinger, Phototaxis of synthetic microswimmers in optical land- scapes, Nat. Commun. 7, 12828 (2016)
2016
-
[11]
H. R. Vutukuri, M. Lisicki, E. Lauga, and J. Vermant, Light-switchable propulsion of active particles with re- versible interactions, Nat. Commun. 11, 2628 (2020)
2020
-
[12]
J. Arlt, V. A. Martinez, A. Dawson, T. Pilizota, and W. C. K. Poon, Painting with light-powered bacteria, Nat. Commun. 9, 768 (2018)
2018
-
[13]
Be’er and G
A. Be’er and G. Ariel, A statistical physics view of swarming bacteria, Mov. Ecol. 7, 1 (2019)
2019
-
[14]
Mart ´ ınez-Rat´ on and E
Y. Mart ´ ınez-Rat´ on and E. Velasco, Enhanced stability of the tetratic phase due to clustering, Phys. Rev. E 79, 011711 (2009)
2009
-
[15]
Scholz, M
C. Scholz, M. Engel, and T. P¨ oschel, Rotating robots move collectively and self-organize, Nat. Commun.9, 931 (2018)
2018
-
[16]
B¨ ar, R
M. B¨ ar, R. Großmann, S. Heidenreich, and F. Peru- ani, Self-propelled rods: Insights and perspectives for ac- tive matter, Annu. Rev. Condens. Matter Phys. 11, 441 (2020)
2020
-
[17]
H. Soni, N. Kumar, J. Nambisan, R. K. Gupta, A. K. Sood, and S. Ramaswamy, Phases and excitations of ac- tive rod–bead mixtures: simulations and experiments, Soft Matter 16, 7210 (2020)
2020
-
[18]
Mohammadi, K
M. Mohammadi, K. Harth, D. Puzyrev, T. Hanselka, 6 T. Trittel, and R. Stannarius, Dynamics of self-propelled particles passing a bottleneck, New J. Phys. 22, 123025 (2020)
2020
-
[19]
Nishinari, K
K. Nishinari, K. Sugawara, T. Kazama, A. Schadschnei- der, and D. Chowdhury, Modelling of self-driven parti- cles: Foraging ants and pedestrians, Physica A: Statisti- cal Mechanics and its Applications 372, 132 (2006), com- mon Trends in Traffic Systems
2006
-
[20]
Rubenstein, A
M. Rubenstein, A. Cornejo, and R. Nagpal, Pro- grammable self-assembly in a thousand-robot swarm, Sci- ence 345, 795 (2014)
2014
-
[21]
H. Oh, A. R. Shirazi, C. Sun, and Y. Jin, Bio-inspired self-organising multi-robot pattern formation: A review, Rob. Auton. Syst. 91, 83 (2017)
2017
-
[22]
Ariel and A
G. Ariel and A. Ayali, Locust collective motion and its modeling, PLoS Comput. Biol. 11, e1004522 (2015)
2015
-
[23]
Ginelli, F
F. Ginelli, F. Peruani, M.-H. Pillot, H. Chat´ e, G. Ther- aulaz, and R. Bon, Intermittent collective dynamics emerge from conflicting imperatives in sheep herds, PNAS 112, 12729 (2015)
2015
-
[24]
Liebchen and H
B. Liebchen and H. L¨ owen, Synthetic chemotaxis and collective behavior in active matter, Acc. Chem. Res. 51, 2982 (2018)
2018
-
[25]
Mori and Y
I. Mori and Y. Ohshima, Neural regulation of thermo- taxis in caenorhabditis elegans, Nature 376, 344 (1995)
1995
-
[26]
Liebchen, P
B. Liebchen, P. Monderkamp, B. Ten Hagen, and H. L¨ owen, Viscotaxis: Microswimmer navigation in vis- cosity gradients, Phys. Rev. Lett. 120, 208002 (2018)
2018
-
[27]
M. Sun, X. Fan, X. Meng, J. Song, W. Chen, L. Sun, and H. Xie, Magnetic biohybrid micromotors with high maneuverability for efficient drug loading and targeted drug delivery, Nanoscale 11, 18382 (2019)
2019
-
[28]
Siebers, A
F. Siebers, A. Jayaram, P. Bl¨ umler, and T. Speck, Ex- ploiting compositional disorder in collectives of light- driven circle walkers, Sci. Adv. 9, eadf5443 (2023)
2023
-
[29]
Mijalkov, A
M. Mijalkov, A. McDaniel, J. Wehr, and G. Volpe, En- gineering sensorial delay to control phototaxis and emer- gent collective behaviors, Phys. Rev. X 6, 011008 (2016)
2016
-
[30]
Leyman, F
M. Leyman, F. Ogemark, J. Wehr, and G. Volpe, Photo- tactic robot tunable by sensorial delays, arXiv preprint arXiv:1807.11765 (2018)
2018 arXiv
-
[31]
M. Rey, G. Volpe, and G. Volpe, Light, matter, action: Shining light on active matter, ACS Photonics 10, 1188 (2023)
2023
-
[32]
https://www.hexbug.com/nano.html
-
[33]
G. A. Patterson, P. I. Fierens, F. Sangiuliano Jimka, P. G. K¨ onig, A. Garcimart ´ ın, I. Zuriguel, L. A. Pug- naloni, and D. R. Parisi, Clogging transition of vibration- driven vehicles passing through constrictions, Phys. Rev. Lett. 119, 248301 (2017)
2017
-
[34]
Deblais, T
A. Deblais, T. Barois, T. Guerin, P. H. Delville, R. Vau- daine, J. S. Lintuvuori, J. F. Boudet, J. C. Baret, and H. Kellay, Boundaries control collective dynamics of in- ertial self-propelled robots, Phys. Rev. Lett. 120, 188002 (2018)
2018
-
[35]
Barois, J
T. Barois, J. F. Boudet, N. Lanchon, J. S. Lin- tuvuori, and H. Kellay, Characterization and control of a bottleneck-induced traffic-jam transition for self- propelled particles in a track, Phys. Rev. E 99, 052605 (2019)
2019
-
[36]
Barois, J
T. Barois, J. F. Boudet, J. S. Lintuvuori, and H. Kellay, Sorting and extraction of self-propelled chiral particles by polarized wall currents, Phys. Rev. Lett. 125, 238003 (2020)
2020
-
[37]
Leoni, M
M. Leoni, M. Paoluzzi, S. Eldeen, A. Estrada, L. Nguyen, M. Alexandrescu, K. Sherb, and W. W. Ahmed, Surfing and crawling macroscopic active particles under strong confinement: Inertial dynamics, Phys. Rev. Res. 2, 043299 (2020)
2020
-
[38]
J. F. Boudet et al. , From collections of independent, mindless robots to flexible, mobile, and directional su- perstructures, Sci. Robot. 6, eabd0272 (2021)
2021
-
[39]
Baconnier, D
P. Baconnier, D. Shohat, C. H. L´ opez, C. Coulais, V. D´ emery, G. D¨ uring, and O. Dauchot, Selective and collective actuation in active solids, Nat. Phys. 18, 1234 (2022)
2022
-
[40]
G. A. Patterson and D. R. Parisi, Fundamental diagram of vibration-driven vehicles, arXiv preprint arXiv:2311.01211 (2023)
2023 arXiv
-
[41]
Altshuler, O
A. Altshuler, O. L. Bonomo, N. Gorohovsky, S. Mar- chini, E. Rosen, O. Tal-Friedman, S. Reuveni, and Y. Roichman, Environmental memory facilitates search with home returns, Phys. Rev. Res. 6, 023255 (2024)
2024
-
[42]
Y. Xi, T. Marzin, R. B. Huang, T. J. Jones, and P.- T. Brun, Emergent behaviors of buckling-driven elasto- active structures, PNAS 121, e2410654121 (2024)
2024
-
[43]
N. A. M. Ara´ ujoet al., Steering self-organisation through confinement, Soft Matter 19, 1695 (2023)
2023
-
[44]
R. C. Maloney, G.-J. Liao, S. H. L. Klapp, and C. K. Hall, Clustering and phase separation in mixtures of dipolar and active particles, Soft Matter 16, 3779 (2020)
2020
-
[45]
Thapa, B.-E
S. Thapa, B.-E. Pinchasik, and Y. Shokef, Emergent clus- tering due to quorum sensing interactions in active mat- ter, New J. Phys. 26, 023010 (2024)
2024
-
[46]
Becton, J
M. Becton, J. Hou, Y. Zhao, and X. Wang, Dynamic clustering and scaling behavior of active particles under confinement, Nanomaterials 14, 144 (2024)
2024
-
[47]
Caprini, D
L. Caprini, D. Breoni, A. Ldov, C. Scholz, and H. L¨ owen, Dynamical clustering and wetting phenomena in inertial active matter, Commun. Phys. 7, 343 (2024)
2024
-
[48]
The influence of the wall structure is also discussed there
See Supplemental Material at XXX for experimental videos and details on the experimental setup and par- ticle characterization. The influence of the wall structure is also discussed there. Furthermore, we give a detailed description of the kinetic model
-
[49]
Kumar, H
N. Kumar, H. Soni, S. Ramaswamy, and A. K. Sood, Flocking at a distance in active granular matter, Nat. Commun. 5, 4688 (2014)
2014
-
[50]
The first 2 minutes of the 6-minute-long experiments were removed from the analysis in order to prevent the inclusion of a transient that would depend on the initial sample preparation
-
[51]
Peruani, L
F. Peruani, L. Schimansky-Geier, and M. Baer, Cluster dynamics and cluster size distributions in systems of self- propelled particles, Eur. Phys. J. Special Topics 191, 173 (2010)
2010
-
[52]
Ginot, I
F. Ginot, I. Theurkauff, F. Detcheverry, C. Ybert, and C. Cottin-Bizonne, Aggregation-fragmentation and indi- vidual dynamics of active clusters, Nat. Commun. 9, 696 (2018)
2018
-
[53]
L´ evay, A
S. L´ evay, A. Katona, H. L¨ owen, R. Cruz Hidalgo, and I. Zuriguel, Cluster dynamics in macroscopic photoactive particles [data set], Zenodo (2025)
2025
-
[54]
Cluster dynamics in macroscopic photoactive particles
S. L´ evay, A. Katona, H. L¨ owen, R. Cruz Hidalgo, and I. Zuriguel, Cluster dynamics in macroscopic photoactive particles [code], GitHub (2025). 1 Supplemental Material for “Cluster dynamics in macroscopic photoactive particles” S´ ara L´ evay,∗ Axel Katona, Hartmut L¨ owen, ...
2025
Reviewed August 11, 2026 · model on record in the stance chip above.
Discussion (0). Continue with ORCID to comment.