REVIEW 4 major objections 4 minor 31 references
Qua$^2$SeDiMo: Quantifiable Quantization Sensitivity of Diffusion Models
T0 review · 4 major / 4 minor · reviewed 2026-08-11 · deepseek-v4-flash
Pith's one-line read This paper claims that quantization sensitivity of individual layers in diffusion image denoisers can be read directly off a graph neural network, and that these readings can be used to build sub-4-bit mixed-precision weight…
desk verdict Measured sub-4-bit configs are the real contribution; the GNN attribution story is the unvalidated soft spot. read the letter →
The pith
A machine-rendered reading of the paper's core claim, the machinery that carries it, and where it could break.
The reading
What carries the argument
The load-bearing mechanism is the GNN-attribution identity: after a graph neural network is trained to regress a denoiser's end-to-end quality (negative FID, optionally penalized by average bit precision), the L1 norm of a node's embedding at hop $m$, $\|h^m_v\|_1$, is interpreted as the sensitivity score of the $m$-hop subgraph rooted at weight layer $v$. The objective adds a ranking loss to the regression loss at every GNN layer, applied to the norms of the graph-level embeddings, so the norms are forced to order the sampled quantization configurations by quality. Because message passing spreads a node's features across its neighborhood, the hop-$m$ norm of a root node aggregates the quantization choices of an entire block structure (self-attention, feedforward, ResNet block, time-embedding module). Selecting, for each node or subgraph root, the quantization setting that maximizes this norm converts the exponential search space into per-node decisions and yields the final mixed-precision configuration.
What would settle it
Measure, for one denoiser, the paper's predicted per-layer sensitivity scores for its optimal sub-4-bit configuration, then independently quantize each single layer to 3-bit UAQ while leaving all other weights at full precision and record the FID change. If the Spearman correlation between the predicted scores and these single-layer FID deltas is not clearly positive, the attribution that the entire method rests on is falsified.
Extended reading notes
Core claim
The central discovery is that quantitative per-layer sensitivity can be derived from a GNN surrogate rather than from Hessians or activation outliers. Encoding each quantizable weight layer as a graph node whose features describe quantization method, precision, operation type, and position, the paper trains an ensemble of GNNs to regress a combined objective $y = -\mathrm{FID} - \lambda\,\overline{\mathrm{Bits}}$ from only 340–447 sampled configurations per denoiser. A ranking loss (differentiable Spearman rho, LambdaRank/NDCG, or their sum) is applied at every message-passing layer to the L1 norm of the graph-level embedding, which compels the embedding norms to rank configurations by quality; the paper then treats $\|h^m_v\|_1$ as the sensitivity score of the $m$-hop subgraph rooted at layer $v$. Enumerating the six quantization options per node and keeping the highest-scoring setting yields mixed-precision configurations at 3.4–3.9 average weight bits that achieve lower FID than the full-precision model on PixArt-$\alpha$, SDXL, Hunyuan-DiT, and DiT-XL/2, and that outperform Q-Diffusion, TFMQ-DM, and ViDiT-Q at W4A8/W4A6. The paper further claims architecture-level insights from the score distributions: time-embedding and output-projection layers are consistently sensitive, DiT blocks favor K-Means clustering while U-Nets favor uniform affine quantization, and U-Net ResNet blocks are more sensitive than Transformer blocks.
Load-bearing premise
The load-bearing premise is that the L1 norm of a GNN node embedding, learned from a few hundred randomly sampled quantization configurations, faithfully measures how much that layer or block actually contributes to end-to-end image quality; if the embedding norms do not track true sensitivity, the constructed configurations and extracted insights would not be reliable.
Editorial extensions
If this is right
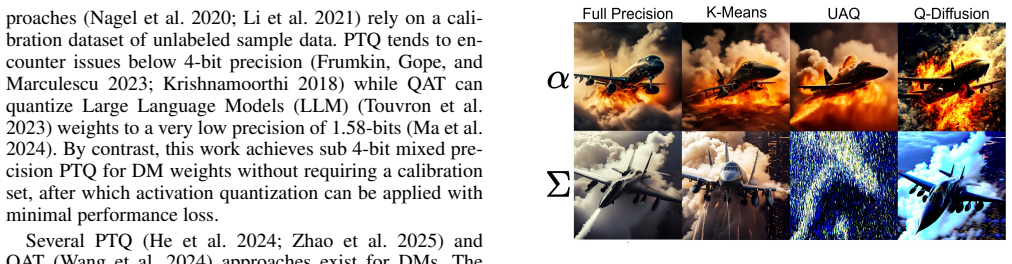
- Sub-4-bit weight-only post-training quantization becomes practical: PixArt-alpha runs at 3.4 average weight bits, PixArt-Sigma at 3.9, Hunyuan-DiT at 3.65, SDXL at 3.7, and DiT-XL/2 at 3.5 bits, with FID and CLIP scores comparable to or better than the W16A16 reference.
- The extracted sensitivity rankings tell developers where to spend bits: time-embedding layers and output projections are consistently fragile, ResNet blocks in U-Nets are more sensitive than Transformer blocks, and patchify/skip-connection layers matter in DiTs.
- Architecture-aware quantization-method choice is quantified: DiT-family models prefer K-Means clustering, U-Nets prefer uniform affine quantization (UAQ), and mixing methods by layer yields better configurations than any single method applied uniformly.
- Pairing these weight configurations with online 6-bit activation quantization (no calibration set) beats calibration-based baselines (Q-Diffusion, TFMQ-DM, ViDiT-Q) on both FID and CLIP for PixArt-alpha/Sigma and Hunyuan-DiT.
Reading between the lines
- A testable transfer claim the paper leaves implicit: because the GNN encodes only quantization features and architecture position, a predictor trained on one PixArt model may rank configurations for its sibling model without retraining, which would slash the evaluation budget.
- One could validate the attribution mechanism itself by ablating each layer to a fixed low-bit setting and correlating measured FID deltas with predicted scores; the paper reports ensemble validation accuracy but not this direct check.
- The same surrogate-search recipe should transfer to video diffusion models or other generative architectures with hundreds of layers, since it needs only a few hundred FID evaluations and the compute is dominated by sampling, not GNN training.
- The paper briefly notes a sinusoidal pattern of layer-wise sensitivity across transformer depth; an extension would be to use these scores to guide block pruning or layer dropping, analogous to depth-pruning policies in large language models.
Signed reviews
Editorial analysis
A structured set of objections, weighed in public.
Referee Report
Summary. The paper proposes Qua²SeDiMo, a mixed-precision post-training quantization (PTQ) framework for diffusion-model denoisers. The denoiser is represented as a directed acyclic graph over weight layers; a GNN is trained on a few hundred randomly sampled quantization configurations using a ranking loss on the L1 norm of the averaged graph embedding (Eq. 6). The authors then interpret the L1 norm of each node embedding as a per-layer sensitivity score and greedily select per-layer quantization methods and precisions (K-Means channel-wise, K-Means tensor-wise, UAQ; 3 or 4 bits) to optimize a FID-plus-average-bit objective. The resulting configurations are evaluated on PixArt-α, PixArt-Σ, Hunyuan-DiT, SDXL, SDv1.5 and DiT-XL/2, with sub-4-bit average precisions (e.g., 3.4-bit on PixArt-α) reported and compared against Q-Diffusion, TFMQ-DM, and ViDiT-Q in FID, CLIP, and a small human-preference study.
Significance. If the per-node sensitivity scores are valid, the paper contributes a scalable, calibration-free way to obtain mixed-precision sub-4-bit weight-only PTQ configurations for both U-Net and DiT denoisers. The final reported configurations are measured, not fitted, and the comparisons in Tables 3 to 6 are extensive, covering three activation-precision levels, multiple architectures, and a human-preference study. The claimed architectural insights (time-embedding importance, U-Net ResBlock fragility, DiT preference for K-Means) are also potentially useful. However, the central attribution from a graph-level ranking loss to per-node scores is not established, and the experimental protocol has a serious FID-protocol inconsistency between search and final evaluation, with no error bars or multiple seeds. These issues are fixable with additional validation experiments, but they currently weaken both the interpretability claim and the statistical reliability of the headline numbers.
major comments (4)
- [Methodology, Eq. (6)] The central claim that the L1 norm of a node embedding is a valid per-layer sensitivity score is not implied by the loss in Eq. (6). The ranking term supervises the scalar norm of the averaged graph embedding ||h^m_G||_1 (Eq. 5), which can be maximized by encoding global summaries such as average bit precision or method mix, or by concentrating signal in a small number of nodes; nothing in the loss forces per-node norms to be additive, counterfactual, or monotone in the true FID effect of changing that node's quantization. The subsequent greedy selection that maximizes each node's score independently therefore rests on an unvalidated attribution. I request a direct validation: hold out random configurations, measure the change in FID when a single layer is toggled from 4-bit to 3-bit (or its method is changed) while other layers are held fixed, and report the rank correlation between these measured marginal effects and the GNN node scores; also compare the greedy per-node choice against a joint search on a small subnetwork. Without this, the qualitative insights in the 'Extracted Insights' section and the claim that the method 'can learn to assign the optimal configuration to each layer' are not supported.
- [Experimental Results and Discussion; Tables 2 vs 3–6] The FID protocol changes between search and final evaluation. The search-time corpus in Table 2 and the Pareto frontiers in Figure 4 use 1k-image FID computed on the COCO 2017 validation split, while Tables 3, 4, 6 and 8 report 10k-image FID on COCO 2014. The gap is not cosmetic: the full-precision PixArt-α FID is 99.67 at 1k images (Table 2) versus 34.05 at 10k images (Table 3). Because the predictor is trained on the 1k scores, λ is tuned for that protocol, and the best configurations are selected from these noisy labels, the reported 10k FID gains may be affected by FID-estimation noise and dataset mismatch. Please report search-time FID using the same 10k COCO-2014 protocol, or at minimum show that the selected configurations are stable when the search objective is re-evaluated on the final protocol, and include multiple seeds or bootstrap intervals.
- [Figures 4 and 9, purple-circle selection] The paper evaluates many predictor variants (three ranking losses, Op-level vs Block-level, two objectives) and then selects a small number of configurations for detailed investigation, marked with purple circles in Figures 4 and 9. The selection rule for these circles is not stated. If the choice was made after inspecting test-set FID, the headline comparisons in Tables 3–6 are a form of best-of-many selection and need correction, e.g., report the full distribution of FID across all variants, or pre-register a selection criterion based only on validation performance. This matters because the reported sub-4-bit results are the best among many searched configurations rather than the output of a single prespecified model selection rule.
- [Supplementary, Fig. 18] The predictor validation metrics in Fig. 18 are reported as ensemble weights, but there is no analysis of the error of the predicted FID itself or of the sensitivity scores. The search space has size 6^#W with #W up to 803, while only 340–447 samples per model are used. A predictor can rank the sampled configurations well while the per-node score attribution is wrong, because the ranking loss only evaluates graph-level order. Please report the calibration and error of the graph-level predictor on held-out configurations and, more importantly, the per-node validation described in the first major comment.
minor comments (4)
- [Table 3] In the W4A6 block of Table 3, the row labeled 'Q-Diffusion OAQ W4A8' (FID 70.96) should presumably be labeled 'Q-Diffusion OAQ W4A6'; as printed, the same precision label appears in two different activation-precision blocks.
- [Methodology, 'Operation-Level Sensitivity via Graphs'] The sentence 'K-Means C quantizes each applies output channel cout separately' contains a typo and should read 'K-Means C quantizes each output channel cout separately'.
- [Table 1 and Tables 2–3] Table 1 reports FID values for PixArt-α/Σ that are close to but not identical to the corresponding values in Table 3, yet the caption does not specify the prompt set or generation protocol; please reconcile these numbers with the COCO-2017/COCO-2014 protocol distinction.
- [Extracted Insights and Figures 8/15] The stacked bar plots in Figures 8 and 15 show quantization-method distributions for a single constructed configuration; statements such as 'DiT blocks have a slight preference for K-Means' would be more convincing if accompanied by variability across configurations, ensemble folds, or random seeds.
Circularity Check
No circular derivation: the reported sub-4-bit FID numbers are ground-truth evaluations of held-out configurations; the GNN scoring is a heuristic attribution, not a fitted parameter renamed as a prediction.
full rationale
Walking the derivation chain, I find no step where a claimed prediction or first-principles result reduces to its own inputs by construction. The surrogate GNN is trained on sampled configurations with ground-truth FID labels (Eq. 6 and Table 2), and the headline 3.4/3.9/3.65/3.7-bit configurations are subsequently evaluated by generating images and computing FID/CLIP from scratch (Tables 3–6). Those numbers are therefore measured outcomes, not values forced by the fitted surrogate. The per-node L1 norms are an attribution heuristic: the paper asserts that because h^m_G is computed by averaging node embeddings per Eq. 5, 'the GNN is forced to learn which nodes contribute or detract from yG' and that ||h^m_{v_i}||_1 can be treated as a numerical score. This is a genuine inferential leap and is unvalidated against direct single-layer perturbation experiments, but it is not circular—Eq. 6 supervises only the aggregate graph-embedding norm, and the selection procedure maximizing node norms is not algebraically identical to the training target. The self-citations to GENNAPE (Mills et al. 2023) and AutoBuild (Mills et al. 2024) supply graph encoding and ensemble-training machinery; they are not invoked as evidence for the quantization results and are not load-bearing. One extracted insight (t-Embed importance) is independently corroborated against TFMQ-DM (Huang et al. 2024), further showing the insights are not merely self-referential. The correct concern is correctness risk—whether the learned norms track true counterfactual sensitivity—not circularity. Score 2 reflects minor non-load-bearing self-citation plus the unvalidated attribution leap, which does not meet the threshold for a circularity finding.
Assumptions & free parameters
free parameters (4)
- lambda (objective coefficient) =
150 for PixArt-alpha, PixArt-Sigma, Hunyuan; 200 for SDXL
- UAQ alpha per weight layer =
grid search over {0,10,...,90} per layer
- Sampling Bernoulli probability p =
p drawn Uniform(0,1) per configuration
- Predictor hyperparameters =
hidden size 64, 4 GNN layers, 10k epochs, batch 128, lr 1e-3, weight decay 1e-6
assumptions (4)
- domain assumption FID on a 1000-image set is a valid proxy target for optimizing end-to-end quantization quality
- ad hoc to paper The L1 norm of a GNN node embedding after ranking-loss training measures the true marginal sensitivity of that layer or block to its quantization choice
- domain assumption The sampled 340 to 447 configurations generalize to the full 6^#W search space
- domain assumption Standard GNN message passing on the denoiser DAG preserves the relevant quantization information
Cite this review
Pith. "Pith review of Qua$^2$SeDiMo: Quantifiable Quantization Sensitivity of Diffusion Models." pith.science (2026). https://pith.science/paper/FIU4GN5S
@misc{pith2026241214628,
  author       = {Pith},
  title        = {Pith review of: Qua$^2$SeDiMo: Quantifiable Quantization Sensitivity of Diffusion Models},
  year         = {2026},
  howpublished = {\url{https://pith.science/paper/FIU4GN5S}},
  note         = {Machine review of arXiv:2412.14628}
}
abstract
Diffusion Models (DM) have democratized AI image generation through an iterative denoising process. Quantization is a major technique to alleviate the inference cost and reduce the size of DM denoiser networks. However, as denoisers evolve from variants of convolutional U-Nets toward newer Transformer architectures, it is of growing importance to understand the quantization sensitivity of different weight layers, operations and architecture types to performance. In this work, we address this challenge with Qua$^2$SeDiMo, a mixed-precision Post-Training Quantization framework that generates explainable insights on the cost-effectiveness of various model weight quantization methods for different denoiser operation types and block structures. We leverage these insights to make high-quality mixed-precision quantization decisions for a myriad of diffusion models ranging from foundational U-Nets to state-of-the-art Transformers. As a result, Qua$^2$SeDiMo can construct 3.4-bit, 3.9-bit, 3.65-bit and 3.7-bit weight quantization on PixArt-${\alpha}$, PixArt-${\Sigma}$, Hunyuan-DiT and SDXL, respectively. We further pair our weight-quantization configurations with 6-bit activation quantization and outperform existing approaches in terms of quantitative metrics and generative image quality.
Figures


Figures from the paper (15 more)





Reference graph
Works this paper leans on
-
[1]
AdaLN/Time Embedding: 2-hop subgraph covering the three time-embedding linear layers
-
[3]
Advances in Neural Information Processing Systems, 36
Ptqd: Accurate post-training quantization for diffu- sion models. Advances in Neural Information Processing Systems, 36. Hessel, J.; Holtzman, A.; Forbes, M.; Bras, R. L.; and Choi, Y . 2021. Clipscore: A reference-free evaluation metric for image captioning. arXiv preprint arXiv:2104.08718. Heusel, M.; Ramsauer, H.; Unterthiner, T.; Nessler, B.; and Hoch...
arXiv 2021
-
[4]
FRAP: Faithful and Realistic Text-to-Image Generation with Adaptive Prompt Weighting
Talaria: Interactively optimizing machine learning models for efficient inference. In Proceedings of the CHI Conference on Human Factors in Computing Systems, 1–19. Huang, Y .; Gong, R.; Liu, J.; Chen, T.; and Liu, X. 2024. Tfmq-dm: Temporal feature maintenance quantization for diffusion models. In Proceedings of the IEEE/CVF Con- ference on Computer Visi...
work page Pith review arXiv 2024
-
[6]
1-hop subgraph containing 3-nodes:
Cross-Attention (2): 2-hop subgraph containing the V and output projection weight layers, and rooted at the lat- ter. 1-hop subgraph containing 3-nodes:
-
[9]
SDXL contains a total of 343458 possible subgraphs split between 11 categories
Projection Out: 0-hop subgraph containing the final ‘proj out’ weight layer in the DiT. SDXL contains a total of 343458 possible subgraphs split between 11 categories
-
[10]
Input ResNet Block w/skip: 2-hop subgraph consist- ing of 5 weight layers: input, output, time-embed, skip- connection and a downsampling layer. Rooted at a dummy ‘Add’ node
-
[12]
Hunyuan-DiT contains a total of 317418 possible sub- graphs split between 9 categories
Projection Out: 1-hop subgraph containing the final ‘norm out’ and ‘proj out’ layers and rooted at the latter. Hunyuan-DiT contains a total of 317418 possible sub- graphs split between 9 categories
-
[13]
Root is the final linear layer
AdaLN/Time Embedding: 2-hop subgraph for the three time-step weight layers. Root is the final linear layer
Show all 31 references
-
[14]
Caption-Embedding: 1-hop subgraph for the two linear layers and rooted at the second layer
-
[15]
Patchify: 0-hop subgraph containing the patch- embedding convolution operation weight layer
-
[16]
Rooted at the output projection layer
Self-Attention: 3-hop subgraph containing 7 nodes, 4 of which are weight layers: Q, K, V and output projection layer. Rooted at the output projection layer
-
[17]
Rooted at the ‘MatMul’ node
Cross-Attention (1): 1-hop subgraph containing the Q and K weight layers and a dummy ‘MatMul’ node for the QK product. Rooted at the ‘MatMul’ node
-
[18]
Cross-Attention (2): 2-hop subgraph containing the V and output projection weight layers, and rooted at the lat- ter
-
[20]
Skip-connection: 1-hop subgraph rooted at an ‘Add’ node that sums the output of the previous transformer block with the input from the long residual skip-connection
-
[32]
Output ResNet Block: 2-hop subgraph consisting of 5 weight layers: input, output, time-embed and two skip- connection layers following (Li et al. 2023). Rooted at an output dummy ‘Add’ node. DiT contains a total of 257688 possible subgraphs split be- tween 4 categories
2023
-
[34]
Attention of the first DiT block contains the ‘Patchify’ convolution
Attention: 4-hop subgraph containing 8 nodes, at least 5 are weight layers: AdaLN linear layer, Q, K, V and output projection layer. Attention of the first DiT block contains the ‘Patchify’ convolution. Rooted at the output projection layer
-
[36]
Root is the second conv layer
Projection Out: 1-hop subgraph for the final two convo- lution layers in the DiT, after the final Transformer block. Root is the second conv layer. SDv1.5 contains a total of 256488 possible subgraphs split between 12 categories
-
[37]
Root is the second linear layer
Time-Embedding: 1-hop subgraph for the two time-step weight layers. Root is the second linear layer
-
[38]
Input Convolution: 0-hop subgraph consisting of the first convolution in the U-Net
-
[39]
Output Convolution: 0-hop subgraph consisting of the last convolution in the U-Net
-
[40]
The other downsam- pling convolutions are merged into ResNet block sub- graphs
Block 9 Downsampler: 0-hop subgraph consisting of one of the downsampling convolutions. The other downsam- pling convolutions are merged into ResNet block sub- graphs
-
[41]
Upsampler: 0-hop subgraph consisting of an upsampling conv
-
[42]
Rooted at the output projection layer
Self-Attention: 3-hop subgraph consisting of 5 weight layers: projection in convolution, Q, K, V and output projection linear layers. Rooted at the output projection layer
-
[43]
Rooted at the output projection layer
Cross-Attention: 3-hop subgraph consisting of 4 weight layers: Q, K, V and output projection linear layers. Rooted at the output projection layer. Note: Where self- attention contains an input projection convolution, cross- attention contains a dummy ‘Add’ node from the self- ...
-
[44]
Root is the second layer
Feedforward: 1-hop subgraph for the two linear layers. Root is the second layer
-
[45]
Transformer Projection Out: 0-hop subgraph consisting of the output projection layer following the feedforward
-
[46]
Rooted at the output layer
Input ResNet Block w/out Skip: 1-hop subgraph con- sisting of the input, output and time-embedding layers. Rooted at the output layer
-
[47]
5th layer is a downsampling con- volution
Input ResNet Block w/skip: 2-hop subgraph consisting of 4 or 5 weight layers: input, output, time-embed, and skip-connection layers. 5th layer is a downsampling con- volution. Rooted at a dummy ‘Add’ node
-
[48]
Output ResNet Block: 2-hop subgraph consisting of 5 weight layers: input, output, time-embed and two skip- connection layers following (Li et al. 2023). Rooted at an output dummy ‘Add’ node. Experimental Hardware and Software Resources All experiments conducted in this paper w...
2023
-
[91]
ISBN 978-3-031-73411-3
Springer Nature Switzerland. ISBN 978-3-031-73411-3. Chen, J.; Yu, J.; Ge, C.; Yao, L.; Xie, E.; Wang, Z.; Kwok, J. T.; Luo, P.; Lu, H.; and Li, Z. 2024. PixArt- α: Fast Training of Diffusion Transformer for Photorealistic Text- to-Image Synthesis. In The Twelfth International...
2024 arXiv
-
[2024]
In Forty-first International Conference on Machine Learning
Scaling rectified flow transformers for high-resolution image synthesis. In Forty-first International Conference on Machine Learning. Fey, M.; and Lenssen, J. E. 2019. Fast Graph Representation Learning with PyTorch Geometric. In ICLR Workshop on Representation Learning on Gra...
2019 arXiv
Reviewed August 11, 2026 · model on record in the stance chip above.
Discussion (0). Continue with ORCID to comment.