REVIEW 5 major objections 7 minor 20 references
Autonomous Crack Detection using Deep Learning on Synthetic Thermogram Datasets
T0 review · 5 major / 7 minor · reviewed 2026-08-11 · deepseek-v4-flash
Pith's one-line read The paper argues that a synthetic training set of finite-element heat-conduction images of cracked steel plates, rendered as color maps, is enough to train a crack detector after fine-tuning, and that the detector transfers to…
desk verdict A solid in-domain synthetic-data proof-of-concept whose abstract overclaims real-data validation; the wild-image check likely isn't thermographic. read the letter →
The pith
A machine-rendered reading of the paper's core claim, the machinery that carries it, and where it could break.
The reading
What carries the argument
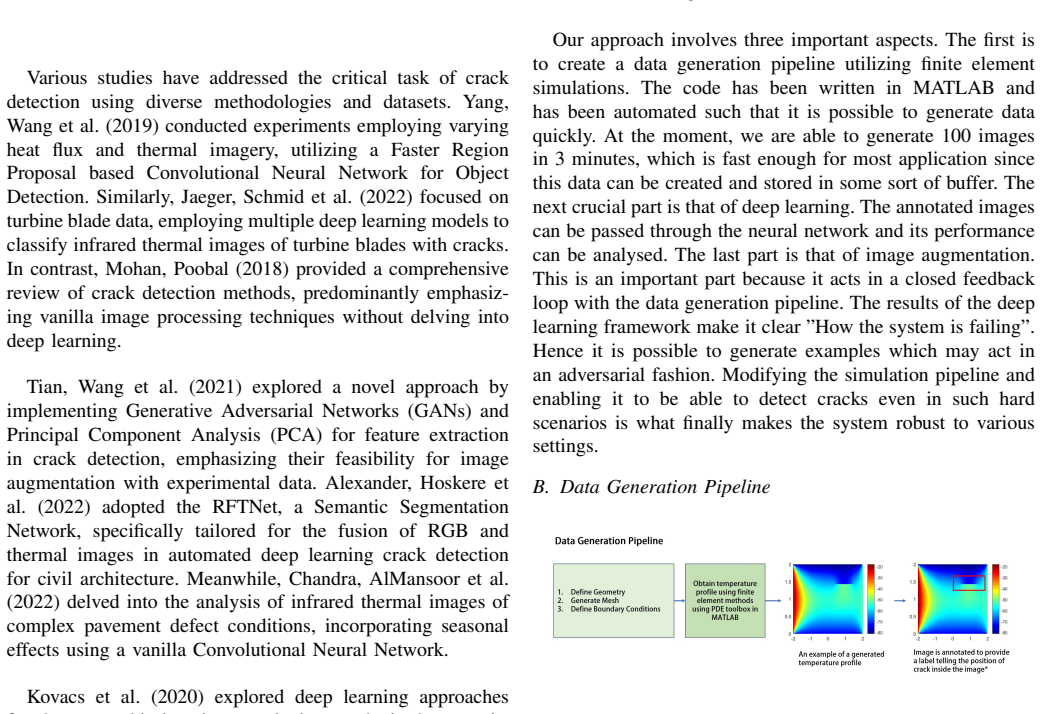
The load-bearing mechanism is the randomized finite-element data-generation pipeline: it solves the steady-state heat equation on a rectangular steel plate, represents a crack as an empty void with randomized length, width, location, and inclination, selects boundary conditions (constant temperature or constant heat flux) on each plate edge, and renders the resulting temperature field through one of several color maps so the image resembles a thermogram. The pipeline feeds annotated synthetic images into a pre-trained Mask R-CNN and YOLO variants that are fine-tuned on the small dataset; convolutional edge-detection filters pick up the abrupt local perturbation of thermal contours at the crack, which is the visual signature the model learns. The finite-element solver is benchmarked against an analytical circular-hole solution to validate the heat-conduction model generally, though not for crack-specific thermal signatures.
What would settle it
Take a detector trained only on the synthetic finite-element thermograms and test it on a set of real thermograms of steel plates with known cracks that match the training distribution in crack shape, size, texture, and thermal contours; if detection performance falls to chance on those matched images, the claimed simulation-to-experiment transfer is false.
Extended reading notes
Core claim
The central claim is that a crack detector can be trained almost entirely on synthetic thermograms generated by solving the steady-state heat equation on a steel plate in which a crack is modeled as a region of removed material. After fine-tuning a pre-trained instance-segmentation model on 105 synthetic images (with 30 for validation and 15 for testing), the model detected the crack in all 15 test images, including cases a human would struggle to see; an earlier object-detection experiment reported precision 0.996, recall 0.95, and mAP50 0.947 on an 80/20 split. The paper also claims that translation to experimental 'wild' images succeeds under matching conditions—similar crack shape, size, image texture, thermal contours, and foreground-background differences—and fails when those are absent, for example with ordinary grayscale images. This establishes the conditions under which simulation-based training data can substitute for experimental thermograms.
Load-bearing premise
The whole approach depends on simulated temperature images looking enough like real thermograms that a model trained on them keeps working on experimental data—a premise the paper itself flags as fragile because simulated images are 'very clean and crisp' compared with real ones.
Editorial extensions
If this is right
- A synthetic training set can be generated in minutes (about 100 images in 3 minutes), removing the thermal-experiment bottleneck for building crack-detection datasets.
- Fine-tuning a pre-trained model on about a hundred synthetic images is enough to detect cracks in all synthetic test images and to transfer to real thermograms under matching appearance conditions.
- Transfer is conditional rather than automatic: real images must resemble the synthetic training distribution in crack shape, size, texture, thermal contours, and foreground-background contrast, and occluded cracks will be missed.
- Adding noise to the clean synthetic images, as the paper suggests, is a direct way to widen the range of real thermograms the model can handle.
- Because the detector does not generalize to ordinary grayscale crack images, the learned representation is specific to the thermal modality rather than to cracks in general.
- A direct experimental measurement of the thermal perturbation around a known crack would test whether the material-removal crack model is physically faithful enough for training data; the paper validates the solver against a circular-hole solution, not against a crack-specific signature.
- A controlled study that adds measured sensor noise, blur, and emissivity variation to synthetic renderings could isolate which rendering choices control the sim-to-real gap and turn the paper's qualitative wild-image observations into a quantitative rule.
- The same pipeline could be extended to transient heating, three-dimensional geometries, subsurface cracks, or cracks modeled as regions of altered material properties; the paper lists these as future work but does not test them.
Editorial analysis
A structured set of objections, weighed in public.
Referee Report
Summary. The manuscript presents a synthetic data generation pipeline for crack detection in steel plates, based on steady-state finite element simulations of thermal profiles with cracks modeled as material removal. The generated temperature maps are rendered with MATLAB colormaps (jet, inferno, grayscale) and augmented. The authors fine-tune pre-trained object detection and segmentation models (YOLO, Detectron2/Mask R-CNN) on 80–105 synthetic images and report high precision/recall and mAP50 on an in-domain synthetic test set (15/15 correct detections). They also report a qualitative "domain adaptation" check on images from the wild, concluding that the approach can translate to realistic experimental data.
Significance. If fully supported, the claim would be significant: it would show that a very small synthetic dataset can replace expensive and difficult thermographic experiments for training crack detectors. The in-domain metrics (Precision 0.996, Recall 0.95, mAP50 0.947; Section VI.B) and the 15/15 detection rate on synthetic test data (Section IX.A) are promising and give a reproducible baseline, especially since Algorithm 1 provides a concrete pipeline and the reported generation speed (100 images in 3 minutes, Section III.A) makes the in-domain setup easy to replicate. However, the paper's headline claim of translation to realistic experimental data rests entirely on a qualitative check on about ten images of unspecified acquisition modality (Section IX.B), and the paper's own observations contradict the suitability of that check. The FEM benchmark (Section IV.B) validates the solver for a circular hole, not for the crack geometry used in training. The external-validity claim is therefore currently unsupported.
major comments (5)
- [Abstract and Section IX.B] The abstract states that the authors 'validated the results by checking if our approach translates to realistic experimental data,' but Section IX.B provides no evidence that the 'wild' images are thermograms. The section never names the acquisition modality; it only says they were 'picked up from real-world scenarios.' Observation (d) says the model 'could not scale onto crack detection scenarios where the images are simply grayscale,' even though Section III.B says the synthetic training set included grayscale colormaps. This mismatch strongly suggests the wild set consisted of visible-light grayscale images, not experimental thermograms. The claimed validation on realistic experimental thermographic data is therefore not established.
- [Section IX.B and Table I] The domain-adaptation evaluation is entirely qualitative: it reports performance on 'of the order of 10^1' images, with no exact count, no quantitative metrics (e.g., mAP, IoU), and no description of the decision procedure behind the ✓/✗ entries in Table I. A qualitative check on roughly ten images cannot support the abstract's generalization claim, especially when the model is reported to fail on grayscale inputs that were part of the training distribution.
- [Section IV.B] The benchmarking against the analytical solution for a circular hole validates the FEM solver's accuracy for a hole, not for the crack geometry (defined as material removal with varying width, length, and inclination) used to generate the training data. The crack-specific thermal signature is the very feature the detector must learn; without a crack-specific validation, the simulation's fidelity for the target defect is unverified. At minimum, a convergence study on the crack geometry or a comparison with a known crack solution is needed.
- [Sections VI.A, VI.B, and IX.A] All quantitative detection results are obtained on synthetic test images drawn from the same generation pipeline as the training data. The 15/15 result in Section IX.A is on this in-domain test set, and the metrics in Section VI.B (Precision 0.996, Recall 0.95, mAP50 0.947) are for the same condition. These results support the weak claim that a detector can be trained on synthetic thermograms, but they do not support the paper's broader transfer claim; the manuscript should clearly separate in-domain performance from any cross-domain evidence.
- [Section XI] The future-work section concedes that 'How our created images directly map to the images obtained through experimental images is also an avenue to check in the future.' This is an explicit admission that the mapping from synthetic to real thermograms has not been established. Given that the abstract claims such a validation, the manuscript is internally inconsistent about what has been demonstrated.
minor comments (7)
- [Abstract] The abstract contains a typo: 'Convolutional Neural Netowrks' should be 'Networks', and the sentence beginning 'There has been a rise in the use of Artificial Intelligence...' is grammatically incomplete.
- [Section III.B] 'CV AT.io' should be 'CVAT.io'.
- [Section IV] The 'Characteristic Range' table is presented as 'Fig. 8' but is a table; it should be numbered as a table with a caption.
- [Section V.C] The text mentions 'RCNN models,' then 'YOLO series of models,' then 'Detectron2' without clarifying which architectures were actually fine-tuned for the reported experimental results.
- [Sections VI.A and VIII.B] Section VI.A reports an 80-image training dataset, while Section VIII.B states a 105-image training dataset; the relationship between these configurations and the metrics reported in Section VI.B is not explained.
- [Section IX.B] The phrase 'the number of images that we could procure were of the order of 10^1' should use 'was' instead of 'were,' and the exact number of wild images should be stated.
- [Figures] Figure numbering is inconsistent: Fig. 8 is a table, and Figs. 5 and 6 (easy/hard examples) appear in the text without clear in-order call-outs.
Circularity Check
No circularity found: the synthetic-to-real transfer claim is under-validated but not constructed from its own outputs.
full rationale
The paper's derivation chain is self-contained. Synthetic thermogram-like images are generated from finite element simulations (Section III.B), rendered with MATLAB colormaps, annotated, and used to fine-tune pretrained detectors (Sections V and VIII). The held-out synthetic test set in Section IX.A measures in-distribution generalization; no fitted parameter is renamed as a prediction. The analytical circular-hole benchmark in Section IV.B independently validates the FEM solver for a hole geometry, and although it does not validate the crack-specific thermal signature, this is a soundness limitation rather than circularity. No load-bearing step relies on the authors' own prior work; all cited deep-learning and synthetic-data references are external. The main weaknesses—the undisclosed acquisition modality of the 'wild' images in Section IX.B, the questionable transfer from synthetic thermograms to real thermographic NDT, and the observed failure on grayscale images despite grayscale training samples—are external-validity and generalization concerns, not cases where the result reduces to its own inputs by definition or by self-citation. Therefore no circular step can be exhibited, and the circularity score is 0.
Assumptions & free parameters
free parameters (5)
- Crack width exponent range =
10^-2 to 10^-4 units
- Crack length sampling range =
[0.3, 0.7] units
- Crack inclination sampling range =
[0, 2*pi]
- Boundary condition types =
constant temperature or constant heat flux per edge
- Colormap set =
jet, inferno, grayscale
assumptions (4)
- domain assumption Steady-state FEM heat conduction is an accurate model of thermographic temperature fields.
- domain assumption A crack can be modeled as a region of removed material (empty space).
- domain assumption Analytical validation on a circular-hole geometry transfers to crack geometries.
- domain assumption Pre-trained natural-image features transfer to synthetic thermograms.
Cite this review
Pith. "Pith review of Autonomous Crack Detection using Deep Learning on Synthetic Thermogram Datasets." pith.science (2026). https://pith.science/paper/DVX4J3S5
@misc{pith2026241216499,
  author       = {Pith},
  title        = {Pith review of: Autonomous Crack Detection using Deep Learning on Synthetic Thermogram Datasets},
  year         = {2026},
  howpublished = {\url{https://pith.science/paper/DVX4J3S5}},
  note         = {Machine review of arXiv:2412.16499}
}
read the original abstract
In a lot of scientific problems, there is the need to generate data through the running of an extensive number of experiments. Further, some tasks require constant human intervention. We consider the problem of crack detection in steel plates. The way in which this generally happens is through humans looking at an image of the thermogram generated by heating the plate and classifying whether it is cracked or not. There has been a rise in the use of Artificial Intelligence (AI) based methods which try to remove the requirement of a human from this loop by using algorithms such as Convolutional Neural Netowrks (CNN)s as a proxy for the detection process. The issue is that CNNs and other vision models are generally very data-hungry and require huge amounts of data before they can start performing well. This data generation process is not very easy and requires innovation in terms of mechanical and electronic design of the experimental setup. It further requires massive amount of time and energy, which is difficult in resource-constrained scenarios. We try to solve exactly this problem, by creating a synthetic data generation pipeline based on Finite Element Simulations. We employ data augmentation techniques on this data to further increase the volume and diversity of data generated. The working of this concept is shown via performing inference on fine-tuned vision models and we have also validated the results by checking if our approach translates to realistic experimental data. We show the conditions where this translation is successful and how we can go about achieving that.
Figures


Figures from the paper (8 more)


Reference graph
Works this paper leans on
-
[1]
Jaeger, B.E., Schmid, S., Grosse, C.U. et al. Infrared Thermal Imaging- Based Turbine Blade Crack Classification Using Deep Learning. J Nondestruct Eval 41, 74 (2022). https://doi.org/10.1007/s10921-022- 00907-9
-
[2]
Yang, J., Wang, W., Lin, G., Li, Q., Sun, Y ., & Sun, Y . (2019). Infrared Thermal Imaging-Based Crack Detection Using Deep Learning. IEEE Access, 7, 182060-182077
work page 2019
-
[3]
Arun Mohan, Sumathi Poobal, Crack detection using image process- ing: A critical review and analysis, Alexandria Engineering Jour- nal, V olume 57, Issue 2, 2018, Pages 787-798, ISSN 1110-0168, https://doi.org/10.1016/j.aej.2017.01.020
-
[4]
Tian, L., Wang, Z., Liu, W. et al. A New GAN-Based Approach to Data Augmentation and Image Segmentation for Crack Detection in Thermal Imaging Tests. Cogn Comput 13, 1263–1273 (2021). https://doi.org/10.1007/s12559-021-09922-w
-
[5]
Alexander, Q.G., Hoskere, V ., Narazaki, Y . et al. Fusion of thermal and RGB images for automated deep learning based crack detection in civil infrastructure. AI Civ. Eng. 1, 3 (2022). https://doi.org/10.1007/s43503- 022-00002-y
-
[6]
Chandra S, AlMansoor K, Chen C, Shi Y , Seo H. Deep Learning Based Infrared Thermal Image Analysis of Complex Pavement Defect Conditions Considering Seasonal Effect. Sensors. 2022; 22(23):9365. https://doi.org/10.3390/s22239365
-
[7]
P ´eter Kov ´acs, Bernhard Lehner, Gregor Thummerer, G ¨unther Mayr, Peter Burgholzer, Mario Huemer; Deep learning approaches for ther- mographic imaging. J. Appl. Phys. 21 October 2020; 128 (15): 155103. https://doi.org/10.1063/5.0020404
-
[8]
Fang Q, Ibarra-Castanedo C, Maldague X. Automatic Defects Segmen- tation and Identification by Deep Learning Algorithm with Pulsed Ther- mography: Synthetic and Experimental Data. Big Data and Cognitive Computing. 2021; 5(1):9. https://doi.org/10.3390/bdcc5010009
Show all 20 references
-
[9]
Matlab Official Documentation: https://in.mathworks.com/help/matlab/
-
[10]
YOLOv5 Official Implementation: https://github.com/ultralytics/yolov5
-
[11]
J., & Shotton, J
Wood, E., Baltru ˇsaitis, T., Hewitt, C., Dziadzio, S., Cashman, T. J., & Shotton, J. (2021). Fake it till you make it: face analysis in the wild using synthetic data alone. Proceedings of the IEEE/CVF International Conference on Computer Vision, 3681–3691
2021
-
[12]
He, R., Sun, S., Yu, X., Xue, C., Zhang, W., Torr, P., Bai, S., & Qi, X. (2022). Is synthetic data from generative models ready for image recognition? ArXiv Preprint arXiv:2210.07574
2022 arXiv
-
[13]
Nikolenko, S. I. (2021). Synthetic data for deep learning (V ol. 174). Springer
2021
-
[14]
Wang, Q., Gao, J., Lin, W., & Yuan, Y . (2021). Pixel-wise crowd understanding via synthetic data. International Journal of Computer Vision, 129(1), 225–245
2021
-
[15]
Hahner, M., Sakaridis, C., Dai, D., & Van Gool, L. (2021). Fog Simula- tion on Real LiDAR Point Clouds for 3D Object Detection in Adverse Weather. Proceedings of the IEEE/CVF International Conference on Computer Vision (ICCV), 15283–15292
2021
-
[16]
Lu, Y ., Shen, M., Wang, H., Wang, X., van Rechem, C., Fu, T., & Wei, W. (2023). Machine learning for synthetic data generation: a review. ArXiv Preprint arXiv:2302.04062
2023 arXiv
-
[17]
A., Paczan, N., Webb, R., & Susskind, J
Roberts, M., Ramapuram, J., Ranjan, A., Kumar, A., Bautista, M. A., Paczan, N., Webb, R., & Susskind, J. M. (2021). Hypersim: A Pho- torealistic Synthetic Dataset for Holistic Indoor Scene Understanding. Proceedings of the IEEE/CVF International Conference on Computer Vision (...
2021
-
[18]
Wu, X., Hong, D., & Chanussot, J. (2022). UIU-Net: U-Net in U-Net for infrared small object detection. IEEE Transactions on Image Processing, 32, 364–376
2022
-
[19]
Tokmakov, P., Li, J., Burgard, W., & Gaidon, A. (2021). Learning To Track With Object Permanence. Proceedings of the IEEE/CVF International Conference on Computer Vision (ICCV), 10860–10869
2021
-
[20]
Jain, S., Seth, G., Paruthi, A., Soni, U., & Kumar, G. (2022). Synthetic data augmentation for surface defect detection and classification using deep learning. Journal of Intelligent Manufacturing, 1–14
2022
Reviewed August 11, 2026 · model on record in the stance chip above.
Discussion (0). Continue with ORCID to comment.