REVIEW 4 major objections 5 minor 1 cited by
SN 2018is: a low-luminosity Type IIP supernova with narrow hydrogen emission lines at early phases
T0 review · 4 major / 5 minor · reviewed 2026-08-10 · deepseek-v4-flash
Pith's one-line read SN 2018is is a low-luminosity Type IIP supernova whose short, steep plateau and unusually narrow hydrogen lines indicate a low-energy explosion of a roughly 9-solar-mass progenitor.
desk verdict Solid observational campaign and honest sample comparison, but the abstract's 9 Msun progenitor claim overstates a grid-boundary fit; this deserves peer review with a required revision of the mass claim. read the letter →
The pith
A machine-rendered reading of the paper's core claim, the machinery that carries it, and where it could break.
The reading
What carries the argument
The load-bearing machinery is the bolometric light curve built from multi-band photometry and compared with two model families: the semi-analytic Arnett-type diffusion-recombination model of Nagy et al. (2014) run through an MCMC sampler, and SNEC, a 1D LTE radiation-hydrodynamics code that takes KEPLER stellar-evolution progenitor models as input and matches multiband magnitudes and photospheric velocities. Plateau duration and decline rate fix the ejecta mass and explosion energy, the early excess requires a compact circumstellar medium, and the nebular [Ni II]/[Fe II] and [Ca II]/[O I] line ratios, together with the plateau colour at half the plateau duration, are the diagnostics that separate iron core collapse from electron capture.
What would settle it
A decisive test would be high-resolution spectroscopy of the sodium absorption feature to pin down the host extinction, combined with a search of pre-explosion archival images of NGC 5054 for the progenitor: if the true extinction is close to $A_V=0.59$ mag the quoted ejecta mass and explosion energy would need revision, and if a progenitor significantly more massive than $9\,M_\odot$ is found the hydrodynamical identification fails.
Extended reading notes
Core claim
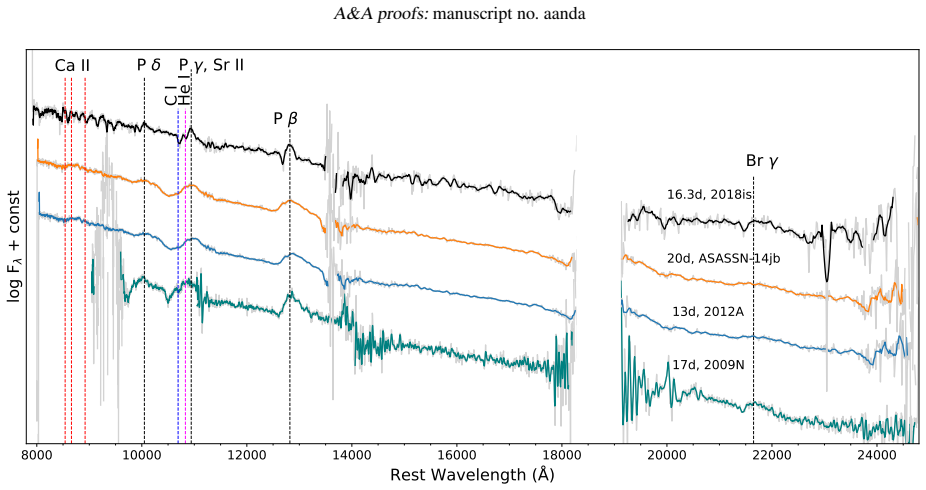
On the paper's own terms, SN 2018is is a low-luminosity Type IIP supernova: at 50 days it reaches $M_V=-15.1\pm0.2$ mag under the adopted extinction $A_V=1.34$ mag, its plateau lasts roughly 110 days with a V-band decline of $1.04\pm0.03$ mag per 100 days, and its optical and near-infrared hydrogen lines are narrower than typical for the class. The photometric and spectroscopic data, including a well-sampled transition to the radioactive tail, are modelled two ways: a semi-analytic diffusion fit gives an ejecta mass near $8\,M_\odot$ (pre-supernova mass about $9.5\,M_\odot$) with explosion energy about $0.40$ foe ($1$ foe $=10^{51}$ erg), while 1D radiation-hydrodynamics models give a $9\,M_\odot$ zero-age main-sequence star, pre-supernova radius $418\,R_\odot$, explosion energy $0.19$ foe, and a wind-like circumstellar medium of $0.17$-$0.43\,M_\odot$ required to match the early light curve. The nebular spectrum shows weak [O I], no [C I] or [Fe I], and a Ni/Fe abundance ratio near $0.04$ ($0.7$ times solar), which together with red colours and the absence of O I 8446 are used to dismiss the electron-capture supernova scenario. The paper therefore presents SN 2018is as a low-energy iron core-collapse explosion from a low-mass red supergiant, extending the observed diversity of low-luminosity SNe II.
Load-bearing premise
The load-bearing premise is the host-galaxy extinction of $A_V=1.34$ mag inferred from the sodium absorption feature; the paper itself cautions that this is an upper limit, and a colour-based alternative gives $A_V=0.59$ mag, which would lower the inferred ejecta mass and explosion energy while keeping the object faint.
Editorial extensions
If this is right
- If the hydrodynamical fit is correct, SN 2018is exploded with only about $0.19\times10^{51}$ erg of kinetic energy from a $9\,M_\odot$ zero-age main-sequence star, placing it near the lower mass limit for iron core collapse.
- The early light curve requires a compact, wind-like circumstellar medium of at least $0.17\,M_\odot$ within roughly 200 solar radii of the progenitor, indicating significant pre-explosion mass loss from a low-mass star.
- Because the electron-capture scenario is dismissed, low-luminosity SNe II should not be assumed to be electron-capture explosions; at least some are low-energy iron core-collapse events.
- With a plateau of about 110 days and a V-band decline of $1.04$ mag per 100 days, SN 2018is extends the observed trend that fainter SNe IIP can have shorter, steeper plateaus than the canonical low-luminosity objects.
- The unusually narrow hydrogen lines and low Fe II and Sc II velocities anchor SN 2018is as an extreme in ejecta velocity among low-luminosity SNe II.
Reading between the lines
- If the lower extinction estimate ($A_V=0.59$ mag) is closer to the truth, the semi-analytic ejecta mass falls from $8.2$ to $6.0\,M_\odot$ and the kinetic energy from $0.36$ to $0.27$ foe; the object stays faint, but the precise progenitor mass and energy are less secure than the headline numbers suggest.
- The paper's Ni/Fe-based rule-out of electron capture inherits the uncertainty that 3D explosion models allow Ni/Fe ratios from sub-solar to tens of times solar, so the strongest case against electron capture is the light-curve behaviour and the absence of O I 8446, not the abundance ratio alone.
- A testable extension: high-resolution spectroscopy of the narrow H-alpha emission during the photospheric phase could separate an ejecta-velocity origin from a circumstellar-interaction origin for the line width, which the present low-resolution spectra cannot fully distinguish.
- If future surveys find more objects with similarly narrow hydrogen lines and steep plateaus, SN 2018is may define a sub-class of fast-declining low-luminosity SNe IIP with distinct progenitor mass-loss histories.
Signed reviews
Editorial analysis
A structured set of objections, weighed in public.
Referee Report
Summary. The paper presents a multi-wavelength observational dataset for the Type IIP supernova SN 2018is in NGC 5054, including optical and near-infrared photometry, optical and NIR spectroscopy, and nebular-phase spectra. The authors derive the explosion epoch from a non-detection, SNID, and EPM; adopt two host-galaxy extinction scenarios (A_V = 1.34 and 0.59 mag); measure light-curve parameters (plateau duration ~110 d, V-band decline 1.04 mag per 100 d); estimate the 56Ni mass from the radioactive tail; and fit the bolometric light curve with both a semi-analytic diffusion model and the 1D hydrodynamical code SNEC. They conclude that SN 2018is is a low-luminosity SN IIP with unusually narrow hydrogen emission lines, low expansion velocities, an ejecta mass of roughly 6-8 M_sun, a low explosion energy (~0.2-0.4 foe), a compact CSM of at least ~0.17 M_sun, and a ZAMS progenitor mass of about 9 M_sun, while explicitly arguing against an electron-capture supernova origin.
Significance. If the central claims hold, SN 2018is adds a valuable data point at the extreme faint, narrow-line end of the low-luminosity SN IIP population, with well-sampled photospheric and nebular phases and a rich spectral time series. The compiled dataset and comparisons with other SNe IIP are useful for future population studies. The quantitative progenitor and explosion properties, however, rest on model fits that carry strong assumptions and degeneracies, so the paper's main lasting contribution is likely the observational characterization and the identification of SN 2018is as an outlier in plateau decline rate and line width, rather than the precise ZAMS mass and explosion energy quoted in the abstract.
major comments (4)
- [§7.2 and Abstract] The SNEC grid is restricted to ZAMS masses between 9 and 11 M_sun, and the best-fit solution lies at the lower grid boundary (9.0 M_sun). A fit at the boundary cannot discriminate 9 M_sun from lower masses; if the merit function is monotonic toward lower masses, the true optimum may lie outside the grid. The paper itself states in §8.1.1 that the progenitor mass 'was 9 M_sun or lower' and in §8.2 that the ZAMS mass is 'below 9 M_sun'. The abstract's assertion that hydrodynamical modelling indicates a ZAMS mass of 9 M_sun is therefore not supported by the modelling as presented. The authors should either extend the grid to lower masses, fit a model with a free mass parameter, or rephrase the claim to acknowledge that only an upper limit near 9 M_sun is constrained.
- [§3.2, §4.2, §7.1, and Abstract] The paper adopts two extinction scenarios, A_V = 1.34 mag (from Na I D, explicitly described as an upper limit) and A_V = 0.59 mag (from colour matching), but the abstract and many quantitative statements use only the high-extinction value. The derived quantities shift substantially between the two scenarios: the semi-analytic ejecta mass changes from 8.2 to 6.0 M_sun, the kinetic energy from 0.36 to 0.27 foe, and the 56Ni mass from 0.0049 to 0.0029 M_sun. The low-luminosity classification is robust, but the headline progenitor mass, explosion energy, and CSM properties are not. The abstract's M50d_V = -15.1 mag is explicitly conditional on A_V = 1.34 mag; the authors should present both scenarios in the abstract and summary, or clearly state that the quoted numbers assume the high-extinction case.
- [§7.2 and Table 5] The SNEC modelling fixes the 56Ni mass to 0.0049 M_sun, which is itself derived from the observed tail luminosity of this same object, and the 56Ni mixing is fixed to 2 M_sun. This introduces a mild circularity in the luminosity normalization of the model light curves. In addition, Table 5 reports the CSM mass as '>0.17 M_sun' and the explosion energy as 0.19 foe without any uncertainties, and the selection of the 'best-match' CSM configuration (R_CSM = 600 R_sun, K_CSM = 2-5 x 10^18 g cm^-1) appears to be based on visual inspection of Figures 17-19 rather than a quantitative criterion. The authors should quantify the uncertainties on the SNEC-derived parameters, or at least state explicitly which parameters are degenerate with the assumed 56Ni mixing and CSM profile.
- [§8.1.1 and §8.2] The text contains an internal inconsistency in the progenitor-mass conclusion. Section 8.1.1 states that the nebular spectrum comparison with Jerkstrand et al. (2018) models indicates a progenitor mass of '9 M_sun or lower', while §8.2 states that the ZAMS mass is 'below 9 M_sun' and the abstract claims a determination of 9 M_sun. Furthermore, the nebular model comparison in Figure 20 shows that the 9 M_sun model overpredicts [O I] and predicts [Fe I], [C I], and Mg I] features that are not detected, while the hydrogen-zone model better matches [Ca II]; the authors still use the 9 M_sun model as the preferred interpretation. These statements need to be reconciled, and the discussion should explicitly acknowledge that the nebular data are at least as consistent with a lower-mass (or ECSN-like) progenitor, even if the ECSN scenario is ultimately disfavoured on other grounds.
minor comments (5)
- [§8.1.1] There is an unresolved citation '?' in the sentence on [O I] luminosity versus ZAMS mass: 'Progenitors with higher masses tend to display more pronounced [O i] features in their nebular spectra (Jerkstrand et al. 2012; ?).' This reference needs to be completed or removed.
- [§4 and Table 3] The text states that the V-band tail-phase decline rate is 0.7 ± 0.2 mag (100 d)^-1, but Table 3 reports 0.51 ± 0.16 mag (100 d)^-1 for the same phase. The text and table should be brought into agreement.
- [§7.1] The text says the reported parameter values are 'the mean of the joint posterior' but the table caption and surrounding text call them 'best-fit core parameters'. The wording should be made consistent, and the distinction between posterior mean and best-fit should be clarified.
- [Throughout] Several typographical issues are present: 'Naid' should be 'Na I D', 'Siii' should be 'Si ii', and the figure caption of Figure 4 has an incomplete sentence ('Parameterised fit to the V-band light curve Valenti et al. (2016) is also shown.').
- [§3.2 and Table 1] The footnote formatting in Table 1 is unclear: the entries 'E(B−V)^host (Colour method)' and 'E(B−V)^host (Na id)' are labelled with footnote markers 'a' and 'b' that are not explained in the caption. Please clarify the notation.
Circularity Check
No significant circularity: the paper's classification, extinction scenarios, and light-curve modelling are anchored in external observations and independent model grids; the SNEC grid-boundary caveat is a correctness risk, not a circular reduction.
full rationale
The central claims do not reduce by construction to their inputs. The low-luminosity classification rests on the observed V-band absolute magnitude (distance from EPM, Eqs. 1-2) and on measured expansion velocities, which are extinction-independent observables. The host-galaxy extinction is estimated from Na I D and from colour matching to SN 2005cs; the colour-match step uses the independently established spectral resemblance and low velocities to justify the LLSN II classification before deriving the low-reddening scenario, so it is not a circular derivation of that classification. The semi-analytic modelling (Nagy et al. 2014; Jäger et al. 2020) fits the observed bolometric light curve with an MCMC over R0, Mej, Ekin, Eth, kappa, and MNi, and the quoted parameters are posterior means, not fitted inputs renamed as predictions. The SNEC hydrodynamical modelling uses an external grid of Sukhbold et al. (2016) progenitors, with a chi2 fit to observed Vri light curves and Sc ii velocities; the 56Ni mass is indeed taken from the same object's tail luminosity, but it is an input parameter, not a quantity the paper claims to predict from the model. The paper's own limitation statements are in scope: it explicitly notes that the Na I D extinction 'can only be considered as an upper limit', and it presents two extinction scenarios rather than forcing one. The most serious issue is that the SNEC grid begins at ZAMS mass 9 Msun, the best fit lands on that lower boundary, and the abstract states 9 Msun while Section 8.1.1 concludes '9 Msun or lower' and Section 8.2 says 'below 9 Msun'. This is an internal consistency and grid-resolution problem, not a circularity: no equation or fitted parameter is equivalent to an input by construction, and the conclusion is not statistically forced by a fit to a subset of the same data. Self-citations (Dastidar et al. 2018, 2024) are methodological references with independent published content and do not carry the load of the central derivation.
Assumptions & free parameters
free parameters (12)
- Host-galaxy reddening A_V (high scenario) =
1.34 mag (SNEC fit prefers 1.18)
- EPM distance D =
21.3 +/- 1.7 Mpc
- Ejecta mass Mej (semi-analytic) =
6.0 (LR) / 8.2 (HR) M_sun
- Kinetic energy Ekin (semi-analytic) =
0.27 / 0.36 foe
- Initial radius R0 (semi-analytic) =
637 / 690 R_sun
- Thermal energy Eth (semi-analytic) =
0.03 / 0.04 foe
- Opacity kappa (semi-analytic) =
0.26 / 0.14 cm2/g
- SNEC ZAMS mass =
9 M_sun (grid 9 to 11 in steps of 0.5)
- SNEC explosion energy =
0.19 foe (grid 0.1 to 0.5 in steps of 0.01)
- SNEC 56Ni mixing mass =
2 M_sun (fixed)
- CSM mass-loading and extent =
K_CSM 2 to 5 x 10^18 g/cm, R_CSM 600 R_sun, M_CSM 0.17 to 0.43 M_sun
- Semi-analytic recombination temperature =
5500 K (fixed)
assumptions (7)
- domain assumption The ejecta is spherically symmetric, homologously expanding, and radiation transport can be treated with the diffusion approximation in the Nagy/Arnett-Fu model.
- domain assumption The early photosphere radiates as a diluted blackbody with Dessart and Hillier 2005 dilution factors for the EPM distance determination.
- domain assumption SNEC's 1D, LTE, grey-opacity, solar-metallicity, non-rotating KEPLER progenitor grid adequately represents the real progenitor.
- ad hoc to paper The 56Ni mass is fixed to 0.0049 M_sun for SNEC and mixed to 2 M_sun.
- domain assumption The Na I D equivalent-width reddening relation gives a usable upper limit for the host extinction.
- domain assumption The Jerkstrand et al. 2018 nebular spectral models correctly predict line strengths as functions of ZAMS mass.
- domain assumption The Sato et al. 2024 B-V color criterion reliably distinguishes electron-capture supernovae from iron core-collapse supernovae.
Cite this review
Pith. "Pith review of SN 2018is: a low-luminosity Type IIP supernova with narrow hydrogen emission lines at early phases." pith.science (2026). https://pith.science/paper/S6MUD3I6
@misc{pith2026250101530,
  author       = {Pith},
  title        = {Pith review of: SN 2018is: a low-luminosity Type IIP supernova with narrow hydrogen emission lines at early phases},
  year         = {2026},
  howpublished = {\url{https://pith.science/paper/S6MUD3I6}},
  note         = {Machine review of arXiv:2501.01530}
}
abstract
We present a comprehensive photometric and spectroscopic study of the Type IIP SN 2018is. The $V$-band luminosity and the expansion velocity at 50 days post-explosion are $-$15.1$\pm$0.2 mag (corrected for A$_V$=1.34 mag) and 1400 km s$^{-1}$, classifying it as a low-luminosity SN II. The recombination phase in the $V$-band is shorter, lasting around 110 days, and exhibits a steeper decline (1.0 mag per 100 days) compared to most other low-luminosity SNe II. Additionally, the optical and near-infrared spectra display hydrogen emission lines that are strikingly narrow, even for this class. The Fe II and Sc II line velocities are at the lower end of the typical range for low-luminosity SNe II. Semi-analytical modelling of the bolometric light curve suggests an ejecta mass of $\sim$8 M$_\odot$, corresponding to a pre-supernova mass of $\sim$9.5 M$_\odot$, and an explosion energy of $\sim$0.40 $\times$ 10$^{51}$ erg. Hydrodynamical modelling further indicates that the progenitor had a zero-age main sequence mass of 9 M$_\odot$, coupled with a low explosion energy of 0.19 $\times$ 10$^{51}$ erg. The nebular spectrum reveals weak [O I] $\lambda\lambda$6300,6364 lines, consistent with a moderate-mass progenitor, while features typical of Fe core-collapse events, such as He I, [C I], and [Fe I], are indiscernible. However, the redder colours and low ratio of Ni to Fe abundance do not support an electron-capture scenario either. As a low-luminosity SN II with an atypically steep decline during the photospheric phase and remarkably narrow emission lines, SN 2018is contributes to the diversity observed within this population.
Figures


Figures from the paper (15 more)




Forward citations
Cited by 1 Pith paper
-
SN 2022xus: bridging the gap between Type IIP and IIL supernovae
SN 2022xus is a transitional Type II supernova with a 94.8-day plateau, a decline rate of 1.23 mag per 100 days, mixed IIP/IIL spectral features, and a likely 12-15 solar-mass progenitor.
Reference graph
Works this paper leans on
-
[1]
Anderson, J. P. 2019, A&A, 628, A7 Anderson, J. P., González-Gaitán, S., Hamuy, M., et al. 2014, ApJ, 786, 67 Arnett, W. D. & Fu, A. 1989, ApJ, 340, 396 Barnsley, R. M., Jermak, H. E., Steele, I. A., et al. 2016, Journal of Astronomical Telescopes, Instruments, and Systems, 2, 015002 Benetti, S., Turatto, M., Balberg, S., et al. 2001, MNRAS, 322, 361 Blon...
arXiv 2019
-
[2]
de Mello et al. (1997),
work page 1997
-
[3]
Turatto et al. (1998),
work page 1998
-
[4]
Hamuy et al. (2001),
work page 2001
-
[5]
Leonard et al. (2002),
work page 2002
-
[6]
Elmhamdi et al. (2003),
work page 2003
-
[7]
Pastorello et al. (2004),
work page 2004
-
[8]
Tsvetkov et al. (2006),
work page 2006
Show all 29 references
-
[9]
Pastorello et al. (2009),
2009
-
[10]
Fraser et al. (2011),
2011
-
[11]
Faran et al. (2014),
2014
-
[12]
Spiro et al. (2014),
2014
-
[13]
Takáts et al. (2014),
2014
-
[14]
Takáts et al. (2015),
2015
-
[15]
Valenti et al. (2016),
2016
-
[16]
Tomasella et al. (2018),
2018
-
[17]
Nakaoka et al. (2018),
2018
-
[18]
Hosseinzadeh et al. (2018),
2018
-
[19]
O’Neill et al. (2019),
2019
-
[20]
Tsvetkov et al. (2019),
2019
-
[21]
Jäger et al. (2020),
2020
-
[22]
Müller-Bravo et al. (2020),
2020
-
[23]
Tsvetkov et al. (2021),
2021
-
[24]
Reguitti et al. (2021),
2021
-
[25]
Valerin et al. (2022),
2022
-
[26]
Bostroem et al. (2023),
2023
-
[27]
Pearson et al. (2023),
2023
-
[28]
Murai et al. (2024),
2024
-
[29]
(2024) Table A.7: Physical parameters of SN II comparison sample
Meza-Retamal et al. (2024) Table A.7: Physical parameters of SN II comparison sample. SN s 2 (mag/100d) t start tend tPT M50d V MNi normal luminosity 1999em 0.32 ± 0.02 24.8 75.5 123.4 ± 3.6 −16.74±0.10 0.050 +0.008 −0.009 intermediate luminosity 2009ib 0.25 ± 0.04 31.0 102.0 ...
2024
Reviewed August 10, 2026 · model on record in the stance chip above.
Discussion (0). Continue with ORCID to comment.