REVIEW 4 major objections 6 minor 67 references
Gaussian process regression of temperature-dependent radial velocities
T0 review · 4 major / 6 minor · reviewed 2026-08-10 · deepseek-v4-flash
Pith's one-line read Solar radial velocities measured from spectral lines formed at 4000–4750 K show the least activity-driven scatter, in both high- and low-activity phases.
desk verdict A careful, reproducible solar RV study whose headline 'sweet spot' finding needs error bars before it should be cited as robust; the GP hyperparameter mapping and SDO comparison are the more solid contributions. read the letter →
The pith
A machine-rendered reading of the paper's core claim, the machinery that carries it, and where it could break.
The reading
What carries the argument
The object carrying the argument is the quasi-periodic covariance kernel $k(t_i,t_j) = A^2 \exp\!\left(-\frac{|t_i-t_j|^2}{\tau^2} - \frac{\sin^2(\pi|t_i-t_j|/P_{\rm rot})}{\mu^2}\right) + \delta_{ij}\beta^2$, with amplitude $A$, evolution timescale $\tau$, rotation period $P_{\rm rot}$, inverse harmonic complexity $\mu$, and jitter $\beta$. The RVs are extracted with the ARVE pipeline from spectral segments binned by their average formation temperature $T_{1/2}$, defined as the photospheric temperature where the cumulative flux contribution reaches 50% of its maximum, using a formation-temperature map computed from PySME spectral synthesis with MARCS atmospheres and VALD line lists. GP hyperparameters are fit via MCMC with MAGPy_RV, and the temperature-dependent RVs are additionally correlated with convective and photometric RV components from SDO Dopplergrams extracted with SolAster.
What would settle it
Recomputing the same HARPS-N RVs with a different spectral synthesis code or a shifted temperature scale would either preserve the 4000–4750 K minimum or move it; if the minimum disappears or shifts substantially, the result is an artifact of the adopted model, not a property of the Sun.
Extended reading notes
Core claim
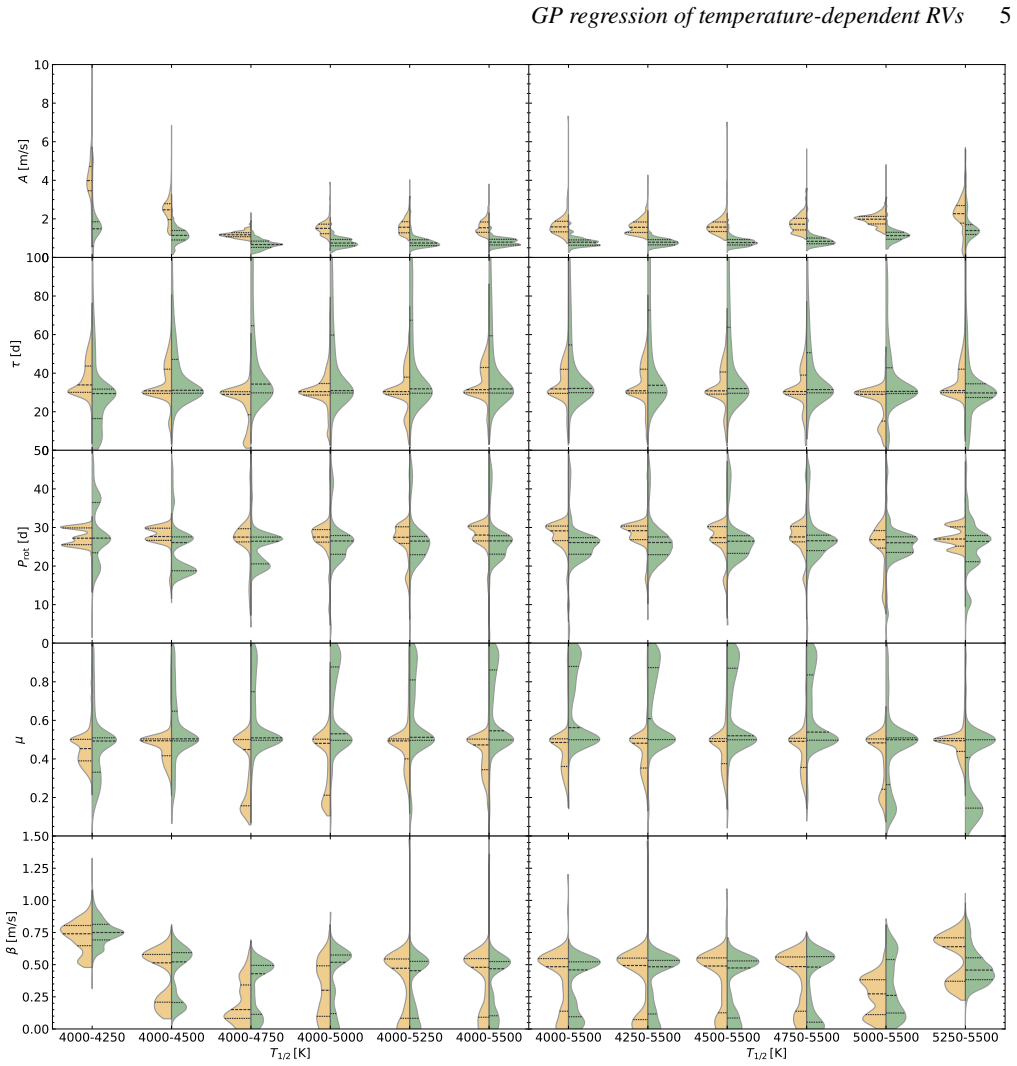
The central claim is that the formation-temperature range giving the smallest RV dispersion is not the full spectral range (4000–5500 K) but an intermediately cool range (4000–4750 K). This holds for both the observed RVs and the residuals after subtracting the best-fit quasi-periodic GP model, at both high and low solar activity. The paper further claims that the GP evolution timescale τ is invariant to activity level and temperature range, that the rotation period is better constrained at high activity, that the inverse harmonic complexity tends to be smaller at high activity, and that the jitter term is bimodal in several cases, reflecting a degeneracy with the other hyperparameters. Finally, comparing the temperature-dependent RVs with convective and photometric RV components extracted from SDO Dopplergrams, the paper finds a consistently strong correlation between hotter-temperature RVs and the convective component due to inhibition of convective blueshift, transitioning to an anti-correlation at the coolest range.
Load-bearing premise
The formation-temperature map from spectral synthesis with the adopted solar parameters (Teff=5770 K, log g=4.40, [Fe/H]=0.00) correctly assigns each spectral segment's photospheric temperature, so the ordering of 'hot' and 'cool' ranges is physically meaningful.
Editorial extensions
If this is right
- RVs extracted from the 4000–4750 K range are intrinsically less scattered and better described by a quasi-periodic GP, so using this line-formation range could reduce the need for aggressive detrending in exoplanet surveys.
- The invariance of the evolution timescale $\tau$ across activity levels and temperature ranges allows a multi-season GP model with a single shared $\tau$, reducing the free parameters from $5N_k$ to $4N_k+1$ when modelling $N_k$ independent intervals.
- The common residual floor near 50 cm s$^{-1}$ across all temperature ranges and activity states indicates unmodelled granulation or supergranulation, motivating more complex covariance kernels or additional high-cadence indicators to reach the EPRV regime.
- The dominance of the convective component in hotter-line RVs, confirmed by the SDO correlation, implies that activity mitigation in those lines must target convection inhibition rather than photometric contrast.
- The periodogram transition from $P_{\rm rot}$ at hotter ranges to $P_{\rm rot}/2$ at cooler ranges is consistent with a changing balance between convective and photometric contributions, providing a diagnostic for the dominant activity process from a single spectrum.
Reading between the lines
- If the 4000–4750 K advantage is not a solar coincidence, pipeline builders could weigh spectral segments by formation temperature to produce a 'quiet RV' channel for Sun-like stars, a testable prediction for existing HARPS and ESPRESSO data.
- The shared 8–10 day residual peak could be a genuine solar oscillation signal (e.g., r-modes or a rotational harmonic); a longer-baseline analysis or a search for mode lifetimes would distinguish it from a systematic.
- The ratio of RVs from hot-line and cool-line segments may serve as a new activity diagnostic that separates convective inhibition from photometric imbalances, independent of traditional indicators like the $S$-index.
- The temperature dependence of the correlation with the convective component suggests that a map of correlation versus $T_{1/2}$ could be used to empirically calibrate or validate spectral synthesis temperature scales across different stellar parameters.
Editorial analysis
A structured set of objections, weighed in public.
Referee Report
Summary. This paper applies quasi-periodic Gaussian process regression to solar RV time series extracted from spectral segments formed at different photospheric temperatures, using HARPS-N solar data over two 140-day intervals at high and low activity. The authors fit GP hyperparameters for 11 overlapping temperature ranges, examine the posterior distributions, compute RV RMS before and after GP subtraction, and correlate the temperature-dependent RVs with SDO/HMI Dopplergram-derived convective and photometric components. The main claimed result is that the 4000–4750 K range yields the smallest RV dispersion for both observed and GP-subtracted RVs, and that hotter temperature ranges correlate strongly with the convective component.
Significance. If the central claim were robustly established, the paper would be a valuable contribution: it would identify a spectral window that is intrinsically less affected by stellar activity, inform GP kernel choices for activity mitigation, and connect disk-integrated RVs to physical surface components. The study has clear strengths: it uses public solar data, open-source pipelines (ARVE and MAGPy_RV), a well-documented MCMC setup with 100 chains, 50,000 iterations, burn-in, and Gelman-Rubin convergence checks, consistent priors across all time series, and an independent SDO comparison. These features make the analysis reproducible and the physical interpretation testable. However, the headline RMS ordering currently lacks uncertainty quantification, so the central empirical result is not yet demonstrated at the claimed level of certainty.
major comments (4)
- [§4.3, Figs. 3–4] The central claim that the 4000–4750 K range yields the smallest RV dispersion is not supported by any uncertainty quantification. The RMS values are reported as point estimates without error bars. With roughly 100 daily-binned points per series (Sect. 2), the sampling uncertainty on a sample RMS is approximately RMS/√(2(N−1)) ≈ 0.07 m/s for RMS ≈ 1 m/s and N = 100. The text itself states the advantage is "if only by a small margin" (§4.3). The differences between adjacent ranges (e.g., 4000–4750 K versus 4000–4500 K or 4000–5000 K) appear to be at this level. Please provide bootstrap or analytic error bars on every RMS value and a significance test for the ordering, rather than only point estimates.
- [§4.1] The 11 temperature ranges are constructed with overlapping boundaries: five ranges share the 4000 K lower bound with decreasing upper bounds, and five share the 5500 K upper bound with increasing lower bounds. The RMS values from these ranges are therefore not independent, because they are computed from largely the same spectral segments. A comparison that treats each range as an independent sample will overstate the significance of the differences. Use a paired or nested bootstrap that resamples days and recomputes all temperature-dependent RVs and their RMS values, or otherwise account for the correlated data structure.
- [§4.3] The GP-subtracted residuals are computed using only the 50th percentile hyperparameter values, as stated in the text, and the residual RMS values do not propagate the posterior uncertainty of the hyperparameters into the residuals. The conclusion that the QP kernel "particularly well describes" the 4000–4750 K series is therefore based on point-estimate fits. Please show that the residual RMS ordering is stable across the posterior distribution, or report a posterior predictive RMS distribution with uncertainties. This also affects the GP model plots in Figs. 3–4, which show only single best-fit curves.
- [§4.4, Fig. 5] The Pearson correlation coefficients between temperature-dependent RVs and the SDO convective and photometric components are reported without error bars or significance levels. Because the RV time series are strongly autocorrelated, the effective number of independent points is far smaller than the number of days, so the nominal p-values (if any) would be invalid. Please provide bootstrap or permutation-based confidence intervals for the correlations, especially for the claim of a "consistently strong correlation" with the convective component, which is used to support the physical interpretation.
minor comments (6)
- [§4.2] In the paragraph on the inverse harmonic complexity, the sentence "The distributions of the inverse harmonic complexity, μ, tend to be biased toward lower values during high activity and and higher values during low activity" contains a duplicated "and" and a grammatical issue.
- [Figs. 3–4] The RMS panels use a logarithmic x-axis, which visually compresses the differences between the key temperature ranges. Consider adding a table that lists the RMS values and their uncertainties for all 11 ranges and both activity intervals.
- [§3.2, Table 1] The prior on the evolution timescale τ is U[0, 140] days, which is exactly the baseline of the time series. Please state whether any posterior distribution hits or piles up against the upper boundary, since that would indicate that the prior is limiting the inference.
- [Fig. 2] The full range (4000–5500 K) appears twice, at the rightmost panel of the left group and the leftmost panel of the right group. The caption notes that the full range was analysed twice, but labelling the two runs explicitly (e.g., "full range, run 1" and "full range, run 2") would avoid confusion.
- [§4.3] The statement that the ~8–10 day peak in the residual periodograms is "unlikely to be a product of improper GP fitting" because it is consistent between datasets is an assertion rather than a demonstration. Showing that the peak persists under a more flexible kernel or in out-of-sample predictions would strengthen this point.
- [Abstract and §5] The abstract and conclusions state the 4000–4750 K result without hedging. Given the lack of uncertainty quantification identified in the major comments, the wording should be softened or qualified until the statistical support is added.
Circularity Check
No circular derivation: the minimal-dispersion finding is a descriptive comparison of in-sample fits, and the independent SDO Dopplergram comparison provides external grounding.
full rationale
I inspected the derivation chain from the formation-temperature map (PySME/MARCS/VALD, with stated solar parameters) through ARVE-based RV extraction, GP regression with MAGPy_RV, residual RMS ranking, and SDO Dopplergram correlation. The headline claim that the 4000–4750 K range has the smallest RV dispersion is a descriptive comparison of computed in-sample RMS values, not a prediction derived from a fitted parameter; no equation defines the claimed output in terms of an input in a way that would make the result true by construction. The formation-temperature map is adopted from Al Moulla et al. (2022) with stated assumptions that do not include the target result, so this self-citation is independent support rather than a circular premise. The SDO comparison uses an independent code (SolAster) and independent disk-resolved data, providing external grounding for the physical interpretation. The paper does report some marginal claims, such as the 4000–4750 K advantage being small, and it does not quote uncertainties on the RMS values; however, that is a robustness or correctness concern, not a circularity. The self-citations to ARVE, MAGPy_RV, and Al Moulla et al. (2022) are method and software attributions, not load-bearing justifications that reduce the conclusions to those citations. Therefore no significant circularity is present; the score reflects only the minor presence of non-load-bearing self-citations.
Assumptions & free parameters
free parameters (5)
- GP amplitude A =
posterior median varies with temperature range and activity (Fig. 2)
- GP evolution timescale tau =
posterior median between 30 and 40 days (Fig. 2)
- GP rotation period P_rot =
posterior median near 27 to 30 days, activity dependent (Fig. 2)
- GP inverse harmonic complexity mu =
posterior medians biased lower at high activity and higher at low activity (Fig. 2)
- GP jitter beta =
posterior median roughly 0.3 to 0.8 m/s, bimodal in some temperature ranges (Fig. 2)
assumptions (5)
- standard math GP regression and MCMC convergence (Gelman-Rubin) provide valid inference.
- domain assumption The quasi-periodic kernel of Eq. 1 adequately describes the covariance of the solar activity signal in all temperature ranges.
- domain assumption The spectral synthesis model (PySME, MARCS, VALD) with adopted solar parameters yields accurate line-formation temperatures.
- ad hoc to paper The two selected 140-day intervals are representative of high and low solar activity.
- ad hoc to paper The prior distributions do not substantially bias the posterior hyperparameters.
Cite this review
Pith. "Pith review of Gaussian process regression of temperature-dependent radial velocities." pith.science (2026). https://pith.science/paper/2DYACVJE
@misc{pith2026250102959,
  author       = {Pith},
  title        = {Pith review of: Gaussian process regression of temperature-dependent radial velocities},
  year         = {2026},
  howpublished = {\url{https://pith.science/paper/2DYACVJE}},
  note         = {Machine review of arXiv:2501.02959}
}
read the original abstract
Gaussian processes (GPs) described by quasi-periodic covariance functions have in recent years become a widely used tool to model the impact of stellar activity on radial velocity (RV) measurements. We perform a GP regression analysis on solar RV time series measured from spectral segments formed at different temperatures within the photosphere in order to evaluate the relation between the best-fit GP kernel hyperparameters and the observed activity signal as a function of temperature. The posterior distributions of the hyperparameters show subtle differences between high- and low-activity phases and as a function of the spectral formation temperature range, which could have implications on the characteristics of the activity signal and its optimal modelling. For the temperature-dependent RVs, we find that at high and low activity alike, the minimal RV dispersion is obtained at intermediately cool temperature ranges (4000-4750 K), for both the observed and GP model-subtracted RVs. Finally, we compare and correlate our temperature-dependent RVs with RV components derived from disk-resolved Dopplergrams of the Sun, for which we find a consistently strong correlation between RVs related to hotter temperature ranges and the dominant RV component due to the inhibition of convection.
Figures


Figures from the paper (2 more)


Reference graph
Works this paper leans on
-
[1]
Al Moulla K., Dumusque X., Cretignier M., Zhao Y., Valenti J. A., 2022, @doi [ ] 10.1051/0004-6361/202243276 , https://ui.adsabs.harvard.edu/abs/2022A&A...664A..34A 664, A34
-
[2]
Al Moulla K., Dumusque X., Figueira P., Lo Curto G., Santos N. C., Wildi F., 2023, @doi [ ] 10.1051/0004-6361/202244663 , https://ui.adsabs.harvard.edu/abs/2023A&A...669A..39A 669, A39
-
[3]
Al Moulla K., Dumusque X., Cretignier M., 2024, @doi [ ] 10.1051/0004-6361/202348150 , https://ui.adsabs.harvard.edu/abs/2024A&A...683A.106A 683, A106
-
[4]
Anglada-Escud \'e G., Butler R. P., 2012, @doi [ ] 10.1088/0067-0049/200/2/15 , https://ui.adsabs.harvard.edu/abs/2012ApJS..200...15A 200, 15
-
[5]
Artigau \'E ., et al., 2022, @doi [ ] 10.3847/1538-3881/ac7ce6 , https://ui.adsabs.harvard.edu/abs/2022AJ....164...84A 164, 84
-
[6]
Asplund M., Grevesse N., Sauval A. J., Scott P., 2009, @doi [ ] 10.1146/annurev.astro.46.060407.145222 , https://ui.adsabs.harvard.edu/abs/2009ARA&A..47..481A 47, 481
arXiv 2009
-
[7]
Baranne A., et al., 1996, , https://ui.adsabs.harvard.edu/abs/1996A&AS..119..373B 119, 373
work page 1996
-
[8]
Barros S. C. C., Demangeon O., D \' az R. F., Cabrera J., Santos N. C., Faria J. P., Pereira F., 2020, @doi [ ] 10.1051/0004-6361/201936086 , https://ui.adsabs.harvard.edu/abs/2020A&A...634A..75B 634, A75
Show all 67 references
-
[9]
D., Faria J
Camacho J. D., Faria J. P., Viana P. T. P., 2022, arXiv e-prints, https://ui.adsabs.harvard.edu/abs/2022arXiv220506627C p. arXiv:2205.06627
2022 arXiv
-
[10]
Collier Cameron A., et al., 2019, @doi [ ] 10.1093/mnras/stz1215 , https://ui.adsabs.harvard.edu/abs/2019MNRAS.487.1082C 487, 1082
2019 doi
-
[11]
S., Ramsay S
Cosentino R., et al., 2012, in McLean I. S., Ramsay S. K., Takami H., eds, Society of Photo-Optical Instrumentation Engineers (SPIE) Conference Series Vol. 8446, Ground-based and Airborne Instrumentation for Astronomy IV. p. 84461V, @doi 10.1117/12.925738
2012 doi
-
[12]
K., McLean I
Cosentino R., et al., 2014, in Ramsay S. K., McLean I. S., Takami H., eds, Society of Photo-Optical Instrumentation Engineers (SPIE) Conference Series Vol. 9147, Ground-based and Airborne Instrumentation for Astronomy V. p. 91478C, @doi 10.1117/12.2055813
2014 doi
-
[13]
C., et al., 2021, @doi [ ] 10.1093/mnras/stab1183 , https://ui.adsabs.harvard.edu/abs/2021MNRAS.505..830C 505, 830
Costes J. C., et al., 2021, @doi [ ] 10.1093/mnras/stab1183 , https://ui.adsabs.harvard.edu/abs/2021MNRAS.505..830C 505, 830
2021 doi
- [14]
-
[15]
C., Pepe F., 2021, @doi [ ] 10.1051/0004-6361/202140986 , https://ui.adsabs.harvard.edu/abs/2021A&A...653A..43C 653, A43
Cretignier M., Dumusque X., Hara N. C., Pepe F., 2021, @doi [ ] 10.1051/0004-6361/202140986 , https://ui.adsabs.harvard.edu/abs/2021A&A...653A..43C 653, A43
2021 doi
-
[16]
Cretignier M., Dumusque X., Aigrain S., Pepe F., 2023, @doi [ ] 10.1051/0004-6361/202347232 , https://ui.adsabs.harvard.edu/abs/2023A&A...678A...2C 678, A2
2023 doi
-
[17]
Cretignier M., Pietrow A. G. M., Aigrain S., 2024, @doi [ ] 10.1093/mnras/stad3292 , https://ui.adsabs.harvard.edu/abs/2024MNRAS.527.2940C 527, 2940
2024 doi
-
[18]
Dalal S., et al., 2024, @doi [ ] 10.1093/mnras/stae1367 , https://ui.adsabs.harvard.edu/abs/2024MNRAS.531.4464D 531, 4464
2024 doi
-
[19]
M., Galland F., Udry S., Mayor M., 2007, @doi [ ] 10.1051/0004-6361:20078144 , https://ui.adsabs.harvard.edu/abs/2007A&A...473..983D 473, 983
Desort M., Lagrange A. M., Galland F., Udry S., Mayor M., 2007, @doi [ ] 10.1051/0004-6361:20078144 , https://ui.adsabs.harvard.edu/abs/2007A&A...473..983D 473, 983
2007 doi
-
[20]
Dumusque X., 2018, @doi [ ] 10.1051/0004-6361/201833795 , https://ui.adsabs.harvard.edu/abs/2018A&A...620A..47D 620, A47
2018 doi
-
[21]
C., Monteiro M
Dumusque X., Udry S., Lovis C., Santos N. C., Monteiro M. J. P. F. G., 2011, @doi [ ] 10.1051/0004-6361/201014097 , https://ui.adsabs.harvard.edu/abs/2011A&A...525A.140D 525, A140
2011 doi
-
[22]
Dumusque X., et al., 2015, @doi [ ] 10.1088/2041-8205/814/2/L21 , https://ui.adsabs.harvard.edu/abs/2015ApJ...814L..21D 814, L21
2015 doi
-
[23]
Dumusque X., et al., 2021, @doi [ ] 10.1051/0004-6361/202039350 , https://ui.adsabs.harvard.edu/abs/2021A&A...648A.103D 648, A103
2021 doi
-
[24]
Ervin T., et al., 2022, @doi [ ] 10.3847/1538-3881/ac67e6 , https://ui.adsabs.harvard.edu/abs/2022AJ....163..272E 163, 272
2022 doi
-
[25]
A., et al., 2016, @doi [PASP] 10.1088/1538-3873/128/964/066001 , https://ui.adsabs.harvard.edu/abs/2016PASP..128f6001F 128, 066001
Fischer D. A., et al., 2016, @doi [PASP] 10.1088/1538-3873/128/964/066001 , https://ui.adsabs.harvard.edu/abs/2016PASP..128f6001F 128, 066001
2016 doi
-
[26]
Foreman-Mackey D., Agol E., Ambikasaran S., Angus R., 2017, @doi [ ] 10.3847/1538-3881/aa9332 , https://ui.adsabs.harvard.edu/abs/2017AJ....154..220F 154, 220
2017 doi
-
[27]
F., 2008, The Observation and Analysis of Stellar Photospheres , 3 edn
Gray D. F., 2008, The Observation and Analysis of Stellar Photospheres , 3 edn. Cambridge University Press
2008
-
[28]
G., Nordlund A ., Plez B., 2008, @doi [ ] 10.1051/0004-6361:200809724 , https://ui.adsabs.harvard.edu/abs/2008A&A...486..951G 486, 951
Gustafsson B., Edvardsson B., Eriksson K., J rgensen U. G., Nordlund A ., Plez B., 2008, @doi [ ] 10.1051/0004-6361:200809724 , https://ui.adsabs.harvard.edu/abs/2008A&A...486..951G 486, 951
2008 doi
-
[29]
D., et al., 2014, @doi [ ] 10.1093/mnras/stu1320 , https://ui.adsabs.harvard.edu/abs/2014MNRAS.443.2517H 443, 2517
Haywood R. D., et al., 2014, @doi [ ] 10.1093/mnras/stu1320 , https://ui.adsabs.harvard.edu/abs/2014MNRAS.443.2517H 443, 2517
2014 doi
-
[30]
D., et al., 2016, @doi [ ] 10.1093/mnras/stw187 , https://ui.adsabs.harvard.edu/abs/2016MNRAS.457.3637H 457, 3637
Haywood R. D., et al., 2016, @doi [ ] 10.1093/mnras/stw187 , https://ui.adsabs.harvard.edu/abs/2016MNRAS.457.3637H 457, 3637
2016 doi
-
[31]
D., et al., 2022, @doi [ ] 10.3847/1538-4357/ac7c12 , https://ui.adsabs.harvard.edu/abs/2022ApJ...935....6H 935, 6
Haywood R. D., et al., 2022, @doi [ ] 10.3847/1538-4357/ac7c12 , https://ui.adsabs.harvard.edu/abs/2022ApJ...935....6H 935, 6
2022 doi
-
[32]
Janssen K., Cauzzi G., 2006, @doi [ ] 10.1051/0004-6361:20054310 , https://ui.adsabs.harvard.edu/abs/2006A&A...450..365J 450, 365
2006 doi
-
[33]
A., Collier Cameron A., Wilson T
John A. A., Collier Cameron A., Wilson T. G., 2022, @doi [ ] 10.1093/mnras/stac1814 , https://ui.adsabs.harvard.edu/abs/2022MNRAS.515.3975J 515, 3975
2022 doi
-
[34]
Klein B., et al., 2024, @doi [ ] 10.1093/mnras/stae1313 , https://ui.adsabs.harvard.edu/abs/2024MNRAS.531.4238K 531, 4238
2024 doi
-
[35]
G., Ryabchikova T
Kupka F. G., Ryabchikova T. A., Piskunov N. E., Stempels H. C., Weiss W. W., 2000, @doi [Baltic Astronomy] 10.1515/astro-2000-0420 , https://ui.adsabs.harvard.edu/abs/2000BaltA...9..590K 9, 590
2000 doi
-
[36]
S., et al., 2024, @doi [ ] 10.1093/mnras/stad3723 , https://ui.adsabs.harvard.edu/abs/2024MNRAS.527.7681L 527, 7681
Lakeland B. S., et al., 2024, @doi [ ] 10.1093/mnras/stad3723 , https://ui.adsabs.harvard.edu/abs/2024MNRAS.527.7681L 527, 7681
2024 doi
-
[37]
F., Gizon L., Zaqarashvili T
Lanza A. F., Gizon L., Zaqarashvili T. V., Liang Z. C., Rodenbeck K., 2019, @doi [ ] 10.1051/0004-6361/201834712 , https://ui.adsabs.harvard.edu/abs/2019A&A...623A..50L 623, A50
2019 doi
-
[38]
R., 1976, @doi [ ] 10.1007/BF00648343 , https://ui.adsabs.harvard.edu/abs/1976Ap&SS..39..447L 39, 447
Lomb N. R., 1976, @doi [ ] 10.1007/BF00648343 , https://ui.adsabs.harvard.edu/abs/1976Ap&SS..39..447L 39, 447
1976 doi
- [39]
-
[40]
M., 2010, @doi [ ] 10.1051/0004-6361/200913551 , https://ui.adsabs.harvard.edu/abs/2010A&A...512A..39M 512, A39
Meunier N., Desort M., Lagrange A. M., 2010, @doi [ ] 10.1051/0004-6361/200913551 , https://ui.adsabs.harvard.edu/abs/2010A&A...512A..39M 512, A39
2010 doi
-
[41]
M., Borgniet S., Rieutord M., 2015, @doi [ ] 10.1051/0004-6361/201525721 , https://ui.adsabs.harvard.edu/abs/2015A&A...583A.118M 583, A118
Meunier N., Lagrange A. M., Borgniet S., Rieutord M., 2015, @doi [ ] 10.1051/0004-6361/201525721 , https://ui.adsabs.harvard.edu/abs/2015A&A...583A.118M 583, A118
2015 doi
-
[42]
W., et al., 2019, @doi [ ] 10.3847/1538-4357/ab064a , https://ui.adsabs.harvard.edu/abs/2019ApJ...874..107M 874, 107
Milbourne T. W., et al., 2019, @doi [ ] 10.3847/1538-4357/ab064a , https://ui.adsabs.harvard.edu/abs/2019ApJ...874..107M 874, 107
2019 doi
-
[43]
Nava C., et al., 2022, @doi [ ] 10.3847/1538-3881/ac3141 , https://ui.adsabs.harvard.edu/abs/2022AJ....163...41N 163, 41
2022 doi
-
[44]
A., Aigrain S., 2022, @doi [ ] 10.1093/mnras/stac2097 , https://ui.adsabs.harvard.edu/abs/2022MNRAS.515.5251N 515, 5251
Nicholson B. A., Aigrain S., 2022, @doi [ ] 10.1093/mnras/stac2097 , https://ui.adsabs.harvard.edu/abs/2022MNRAS.515.5251N 515, 5251
2022 doi
-
[45]
L., Ford E
Palumbo M. L., Ford E. B., Gonzalez E. B., Wright J. T., Al Moulla K., Schlichenmaier R., 2024, @doi [ ] 10.3847/1538-3881/ad4c6d , https://ui.adsabs.harvard.edu/abs/2024AJ....168...46P 168, 46
2024 doi
-
[46]
C., Udry S., Burnet M., 2002, @doi [ ] 10.1051/0004-6361:20020433 , https://ui.adsabs.harvard.edu/abs/2002A&A...388..632P 388, 632
Pepe F., Mayor M., Galland F., Naef D., Queloz D., Santos N. C., Udry S., Burnet M., 2002, @doi [ ] 10.1051/0004-6361:20020433 , https://ui.adsabs.harvard.edu/abs/2002A&A...388..632P 388, 632
2002 doi
-
[47]
D., Thompson B
Pesnell W. D., Thompson B. J., Chamberlin P. C., 2012, @doi [SolPhys] 10.1007/s11207-011-9841-3 , https://ui.adsabs.harvard.edu/abs/2012SoPh..275....3P 275, 3
2012 doi
-
[48]
F., et al., 2016, in Navarro R., Burge J
Phillips D. F., et al., 2016, in Navarro R., Burge J. H., eds, Society of Photo-Optical Instrumentation Engineers (SPIE) Conference Series Vol. 9912, Advances in Optical and Mechanical Technologies for Telescopes and Instrumentation II. p. 99126Z, @doi 10.1117/12.2232452
2016 doi
-
[49]
A., 2017, @doi [ ] 10.1051/0004-6361/201629124 , https://ui.adsabs.harvard.edu/abs/2017A&A...597A..16P 597, A16
Piskunov N., Valenti J. A., 2017, @doi [ ] 10.1051/0004-6361/201629124 , https://ui.adsabs.harvard.edu/abs/2017A&A...597A..16P 597, A16
2017 doi
-
[50]
E., Kupka F., Ryabchikova T
Piskunov N. E., Kupka F., Ryabchikova T. A., Weiss W. W., Jeffery C. S., 1995, , https://ui.adsabs.harvard.edu/abs/1995A&AS..112..525P 112, 525
1995
-
[51]
Queloz D., et al., 2001, @doi [ ] 10.1051/0004-6361:20011308 , https://ui.adsabs.harvard.edu/abs/2001A&A...379..279Q 379, 279
2001 doi
-
[52]
Queloz D., et al., 2009, @doi [ ] 10.1051/0004-6361/200913096 , https://ui.adsabs.harvard.edu/abs/2009A&A...506..303Q 506, 303
2009 doi
-
[53]
A., Reece S., Roberts S., 2015, @doi [ ] 10.1093/mnras/stv1428 , https://ui.adsabs.harvard.edu/abs/2015MNRAS.452.2269R 452, 2269
Rajpaul V., Aigrain S., Osborne M. A., Reece S., Roberts S., 2015, @doi [ ] 10.1093/mnras/stv1428 , https://ui.adsabs.harvard.edu/abs/2015MNRAS.452.2269R 452, 2269
2015 doi
-
[54]
Rajpaul V., Aigrain S., Roberts S., 2016, @doi [ ] 10.1093/mnrasl/slv164 , https://ui.adsabs.harvard.edu/abs/2016MNRAS.456L...6R 456, L6
2016 doi
-
[55]
D., 2023, MAGPy-RV: Gaussian Process regression pipeline with MCMC parameter searching , Astrophysics Source Code Library, record ascl:2310.006 ( @eprint ascl 2310.006 )
Rescigno F., Dixon B., Haywood R. D., 2023, MAGPy-RV: Gaussian Process regression pipeline with MCMC parameter searching , Astrophysics Source Code Library, record ascl:2310.006 ( @eprint ascl 2310.006 )
2023
-
[56]
Rescigno F., et al., 2024a, @doi [ ] 10.1093/mnras/stad3255 , https://ui.adsabs.harvard.edu/abs/2024MNRAS.527.5385R 527, 5385
-
[57]
Rescigno F., et al., 2024b, @doi [ ] 10.1093/mnras/stae1634 , https://ui.adsabs.harvard.edu/abs/2024MNRAS.532.2741R 532, 2741
-
[58]
L., Stempels H
Ryabchikova T., Piskunov N., Kurucz R. L., Stempels H. C., Heiter U., Pakhomov Y., Barklem P. S., 2015, @doi [ ] 10.1088/0031-8949/90/5/054005 , https://ui.adsabs.harvard.edu/abs/2015PhyS...90e4005R 90, 054005
2015 doi
-
[59]
D., 1982, @doi [ ] 10.1086/160554 , https://ui.adsabs.harvard.edu/abs/1982ApJ...263..835S 263, 835
Scargle J. D., 1982, @doi [ ] 10.1086/160554 , https://ui.adsabs.harvard.edu/abs/1982ApJ...263..835S 263, 835
1982 doi
-
[60]
H., et al., 2012, @doi [Solar Physics] 10.1007/s11207-011-9834-2 , https://ui.adsabs.harvard.edu/abs/2012SoPh..275..207S 275, 207
Scherrer P. H., et al., 2012, @doi [Solar Physics] 10.1007/s11207-011-9834-2 , https://ui.adsabs.harvard.edu/abs/2012SoPh..275..207S 275, 207
2012 doi
-
[61]
Schou J., et al., 2012, @doi [Solar Physics] 10.1007/s11207-011-9842-2 , https://ui.adsabs.harvard.edu/abs/2012SoPh..275..229S 275, 229
2012 doi
-
[62]
M., Barros S
Serrano L. M., Barros S. C. C., Oshagh M., Santos N. C., Faria J. P., Demangeon O., Sousa S. G., Lendl M., 2018, @doi [ ] 10.1051/0004-6361/201731206 , https://ui.adsabs.harvard.edu/abs/2018A&A...611A...8S 611, A8
2018 doi
-
[63]
A., Fischer D
Valenti J. A., Fischer D. A., 2005, @doi [ ] 10.1086/430500 , https://ui.adsabs.harvard.edu/abs/2005ApJS..159..141V 159, 141
2005 doi
-
[64]
A., Piskunov N., 1996, , https://ui.adsabs.harvard.edu/abs/1996A&AS..118..595V 118, 595
Valenti J. A., Piskunov N., 1996, , https://ui.adsabs.harvard.edu/abs/1996A&AS..118..595V 118, 595
1996
-
[65]
Wehrhahn A., Piskunov N., Ryabchikova T., 2023, @doi [ ] 10.1051/0004-6361/202244482 , https://ui.adsabs.harvard.edu/abs/2023A&A...671A.171W 671, A171
2023 doi
-
[66]
C., 1968, @doi [ ] 10.1086/149652 , https://ui.adsabs.harvard.edu/abs/1968ApJ...153..221W 153, 221
Wilson O. C., 1968, @doi [ ] 10.1086/149652 , https://ui.adsabs.harvard.edu/abs/1968ApJ...153..221W 153, 221
1968 doi
-
[67]
Zechmeister M., K \"u rster M., 2009, @doi [ ] 10.1051/0004-6361:200811296 , https://ui.adsabs.harvard.edu/abs/2009A&A...496..577Z 496, 577
2009 doi
Reviewed August 10, 2026 · model on record in the stance chip above.
Discussion (0). Continue with ORCID to comment.