REVIEW 3 major objections 4 minor 1 cited by
Quantifying the detection likelihood of faint peaks in interferometric data through jackknifing: Test application on finding $z>10$ galaxy candidates
T0 review · 3 major / 4 minor · reviewed 2026-08-10 · deepseek-v4-flash
Pith's one-line read This paper argues that the 3–5σ emission-line detections previously reported for three z>10 galaxy candidates in archival ALMA data are statistically consistent with noise, and presents a jackknife-based likelihood-ratio tool for…
desk verdict Useful jackknife tool and a plausible null result for z>10 candidates, but the headline claim overreaches because the null analysis never uses the imaging under which the original detections were claimed. read the letter →
The pith
A machine-rendered reading of the paper's core claim, the machinery that carries it, and where it could break.
The reading
What carries the argument
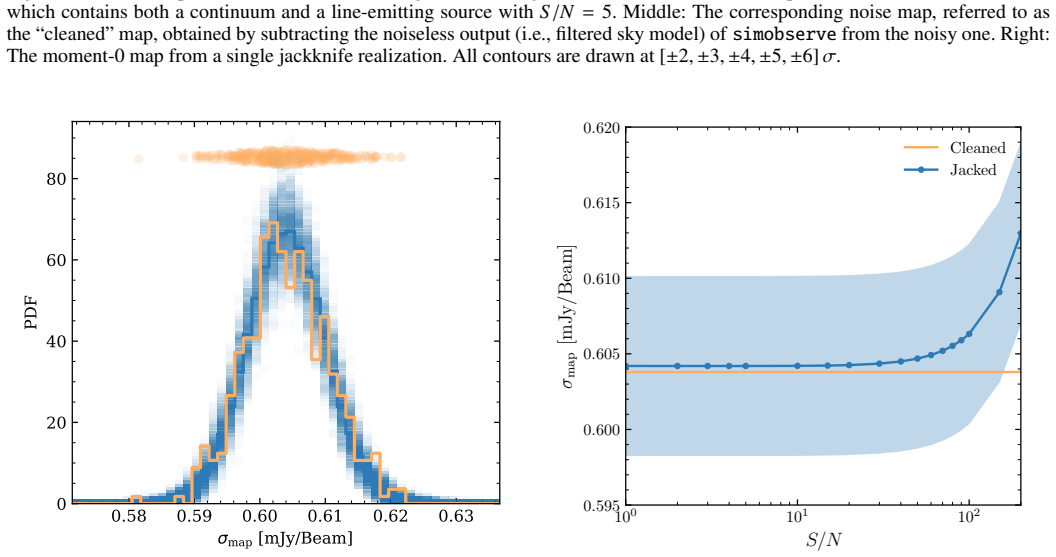
The central mechanism is jackknifing in the visibility plane: randomly multiplying half of a measurement set's real and imaginary visibility amplitudes by -1, then re-imaging, so that the coherent source signal averages to zero while the zero-mean Gaussian noise remains. This yields observation-specific noise-only cubes with the same uv-coverage, beam, and imaging-related correlated noise as the real data, from which the false-detection probability distribution PFD(x) is sampled without assuming an analytic noise model. The detection statistic is the likelihood ratio Λ(γ) = LD(γ)/LFD(γ), computed by applying the line-finding algorithm used in the paper to both the real cube and 50 jackknife realizations; the ratio exceeds the threshold k=3 when the data contain more peaks at a given S/N than the noise alone would produce.
What would settle it
Re-image the GLASS-z12 measurement set with the same tapered weighting and 150 km/s channels used in the original 5.8σ report and run the jackknife likelihood ratio; if the peak at the reported position then yields Λ ≥ 3, the conclusion that the detection is pure noise would be refuted.
Extended reading notes
Core claim
The paper's central claim is that the previously reported 3–5σ [O III] 88 μm detections in the archival ALMA scans of GLASS-z12, GLASS-z10, and S5-z17-1 are statistically indistinguishable from the noise in those same measurement sets. The evidence is a likelihood-ratio test built from jackknife noise cubes: flipping the sign of half the complex visibilities before re-imaging removes the source while preserving the uv-coverage, beam, and correlated noise pattern, so the false-detection distribution PFD(x) is sampled directly from the data. Integrating the peak S/N distributions above γ = 4σ gives false-detection likelihoods LFD = 0.0011, 0.0054, and 0.0032; multiplied by the number of peaks in each real cube, these predict 1.3±1.1, 1.5±1.2, and 0.7±0.8 noise peaks above 4σ, and the data contain 1, 2, and 1 such peaks, giving Λ = 0.80, 1.4, and 1.4. Since Λ is below the k=3 threshold, the null hypothesis (no line) cannot be rejected for any source. The paper further shows that a JWST/MRS redshift prior for GLASS-z12 narrows the search but still leaves Λ = 1.64 at 2.5σ, below the threshold.
Load-bearing premise
Jackknife noise cubes share the exact statistical distribution of the true noise in the real data — same covariance, no leftover source signal — a premise validated only on narrow-band six-channel simulations with a simple point source and a negligible w-term.
Editorial extensions
If this is right
- The three tentative z>10 [O III] detections (GLASS-z12, GLASS-z10, S5-z17-1) are statistically consistent with noise, with likelihood ratios 0.80, 1.4, and 1.4 at 4σ, all below the k=3 detection threshold.
- In a blind search across ~30 GHz of ALMA bandwidth, a 4σ peak is not rare: given the ~200–1000 peaks in these cubes, ~3±2 noise peaks at S/N 4–5 are expected, so a >5σ threshold is required for secure line confirmation.
- Even adding a JWST redshift prior for GLASS-z12 leaves the likelihood ratio at 1.64 (below k=3), so the prior does not rescue the marginal detection.
- Detecting two lines at a matching redshift would strengthen the case, but the chance that two noise features appear at the right spatial and frequency offset must still be counted.
- The publicly released jackknify tool can be applied to any interferometric measurement set in the standard radio-astronomy format, making the false-detection likelihood calculation reproducible for other targets.
Reading between the lines
- If jackknife noise realizations remain faithful for full 30 GHz scans with continuum subtraction and multiple lines, the Λ > 3 threshold could become a standard, observation-specific detection criterion for ALMA line searches, replacing global S/N cutoffs.
- The same visibility-differencing idea could be ported to single-dish time-domain data, as the paper hints, giving false-positive rates for future large-aperture submillimeter surveys where the beam and noise correlations differ.
- A direct test of the method's generality would be to run jackknify on a cube with a known faint line embedded in a full-band scan and measure how often Λ exceeds 3 as a function of line S/N; the paper only validates the noise statistics, not the detection completeness across the full bandwidth.
Editorial analysis
A structured set of objections, weighed in public.
Referee Report
Summary. The manuscript presents 'jackknify', a tool that generates noise realizations from interferometric visibilities by randomly sign-flipping half of the real and imaginary visibility amplitudes and re-imaging. The authors apply FindClump to the real data cube and to 50 jackknife realizations of three archival ALMA spectral scans targeting z>10 candidates (GLASS-z12, GLASS-z10, and S5-z17-1), compute likelihood ratios between the positive-peak distribution in the data and that in the jackknife noise, and conclude that the previously reported tentative [O III] 88 micron detections are consistent with noise. They validate the method against simobserve simulations for a six-channel point-source setup and demonstrate a Bayesian extension that incorporates a JWST redshift prior for GLASS-z12. The paper also provides a public implementation of the tool.
Significance. The tool addresses a real and timely problem: false-positive emission-line detections in broad ALMA spectral scans can bias number counts and redshift distributions of high-redshift galaxies. The strengths of the paper are the public implementation of the method, the simulation-based validation of the jackknife noise model for point sources, and the explicit quantitative comparison of expected and observed numbers of peaks above 4 sigma (1.3 vs 1, 1.5 vs 2, and 0.7 vs 1 in Table 2). If the results are interpreted as conditional on the adopted imaging, they support the null conclusion for those specific cubes. The main weakness is that the null analysis is carried out in natural-weighted, 46 km/s channel cubes, whereas the original reported detections were made with tapered, wider-channel imaging; the paper itself documents that this imaging change reduces the GLASS-z12 feature from 5.8 sigma to 2.9 sigma and the S5-z17-1 feature from 5.1 sigma to 3.9 sigma. The claim that the previously reported detections are consistent with noise is therefore not fully established for the imaging in which those detections were originally reported.
major comments (3)
- [Section 5.2, Table 2] The conclusion that the previously reported tentative detections are consistent with noise is computed only for the authors' fixed imaging choice (natural weighting, ~46 km/s channels). Under this imaging, the GLASS-z12 feature drops from 5.8 sigma at 400 km/s to 2.9 sigma at 280 km/s, and the S5-z17-1 feature drops from 5.1 sigma to 3.9 sigma; the authors explicitly attribute this to imaging differences and state that this 'highlights the importance of imaging the jackknifed data in the same way as the real data.' Because the likelihood ratios and false-detection probabilities in Table 2 are not computed for the tapered, wider-channel cubes in which the detections were originally reported, the central claim overreaches. The authors should either repeat the jackknifing analysis for the original imaging setups or explicitly restrict the conclusion to their adopted imaging.
- [Section 4, footnote 3] The simobserve validation covers only a six-channel, 31 MHz setup with a single unresolved source observed with natural weighting and under the assumption that the w-term is negligible. The three real data sets are full ~30 GHz spectral scans with continuum subtraction and multiple tunings; the paper does not validate that jackknifed realizations from such scans have the same noise distribution as the true noise, particularly regarding spectral correlations across tunings and possible residual continuum-subtraction artifacts. This is a load-bearing assumption for the method's application to the full spectral scans, and it should be either validated with a more representative simulation or clearly flagged as a scope limitation.
- [Section 3.2, Eq. (2)] The definition of the likelihood ratio in Eq. (2) is internally inconsistent with its use in Section 5.2 and Table 2. Equation (2) writes Lambda = Npos/Nneg and identifies negative peaks in the real cube with the false-detection distribution, while the actual analysis uses positive peaks in jackknife cubes for PFD and computes Lambda as the ratio of the number of real peaks above gamma to the expected number of jackknife peaks above gamma (approximately Nfound/(LFD x Npeaks)). Please define Lambda unambiguously and align the equation with the procedure actually implemented.
minor comments (4)
- [Keywords] The keyword 'galaxies:high-redsfhits' contains a typo and should be 'galaxies:high-redshift.'
- [Section 5.2] The text states Npeaks = 1150 for GLASS-z12 while Table 2 reports Npeaks found above 4 sigma as 1; please clarify that Npeaks is the total number of FindClump peaks in the full cube, not the number above the detection threshold.
- [Section 5.3] In the Bayesian subsection, the posterior is normalized and priors are introduced, but the reported value Lambda(gamma = 2.5) = 1.64 appears to be computed without explicitly showing how the JWST redshift prior enters the likelihood-ratio calculation; please clarify whether the prior is included in the quoted ratio.
- [Table 1 and Section 5.3] The ALMA project code for the Bakx data is written as 2021.A.00020.S in Table 1 and as 2021.A0020.S in Section 5.3; please use a consistent notation.
Circularity Check
No significant circularity: the jackknife noise model is validated against external simobserve simulations, and the likelihood-ratio test is applied symmetrically to real and noise cubes rather than fitted to the null result.
full rationale
The derivation chain is self-contained. Jackknife noise realizations are produced by randomly sign-flipping half the visibilities and re-imaging, and the validity of this procedure is checked against external CASA simobserve simulations (Section 4, Figs. 5–6), not against the three science targets. The likelihood ratio Lambda = LD/LFD is defined from two empirically sampled peak distributions, one from the real cube and one from jackknifed noise cubes; it is not fitted to reproduce the null result. The thresholds gamma = 4 and k = 3 are fixed a priori and applied symmetrically to both distributions. The redshift-prior re-analysis of GLASS-z12 uses independent JWST/MRS data (Zavala et al. 2024b). The only self-reference is building on the visibility-differencing idea of Kaasinen et al. (2023), but the present paper independently validates the approach with simulations and releases a public tool, so the citation is not load-bearing. The dependence of the null result on the chosen imaging (natural weighting and 46 km/s channels versus the tapered, wider-channel cubes of the original reports) is a scope and generality limitation, not a circular reduction: the paper explicitly identifies the S/N difference and does not claim the conclusion is imaging-independent. No equation reduces to its own input, and no fitted parameter is renamed as a prediction.
Assumptions & free parameters
free parameters (6)
- Detection threshold gamma =
4 sigma (2.5 sigma in the Bayesian section)
- Likelihood-ratio threshold k =
3
- Aperture radius =
0.6 arcsec
- Line-width search range =
100 to 500 km/s
- Number of jackknife realizations =
50
- SExtractor detection and analysis thresholds =
2
assumptions (4)
- domain assumption Visibility-plane noise is Gaussian, additive, and zero-mean after proper calibration
- domain assumption Random sign-flipping of visibilities removes the source while preserving the noise distribution
- domain assumption The peak distribution sampled by FindClump in jackknife cubes is an unbiased estimator of the false detection PDF
- domain assumption The w-term can be neglected for these small fields
Cite this review
Pith. "Pith review of Quantifying the detection likelihood of faint peaks in interferometric data through jackknifing: Test application on finding $z>10$ galaxy candidates." pith.science (2026). https://pith.science/paper/OHNM6HM2
@misc{pith2026250103150,
  author       = {Pith},
  title        = {Pith review of: Quantifying the detection likelihood of faint peaks in interferometric data through jackknifing: Test application on finding $z>10$ galaxy candidates},
  year         = {2026},
  howpublished = {\url{https://pith.science/paper/OHNM6HM2}},
  note         = {Machine review of arXiv:2501.03150}
}
abstract
False-positive emission-line detections bias our understanding of astronomical sources; for example, falsely identifying $z\sim3-4$ passive galaxies as $z>10$ galaxies leads to incorrect number counts and flawed tests of cosmology. In this work, we provide a novel but simple tool to better quantify the detection of faint lines in interferometric data sets and properly characterize the underlying noise distribution. We demonstrate the method on three sets of archival observations of $z>10$ galaxy candidates, taken with the Atacama Large Millimeter/Submillimeter Array (ALMA). By jackknifing the visibilities using our tool, $jackknify$, we create observation-specific noise realizations of the interferometric measurement set. We apply a line-finding algorithm to both the noise cubes and the real data and determine the likelihood that any given positive peak is a real signal by taking the ratio of the two sampled probability distributions. We show that the previously reported, tentative emission-line detections of these $z>10$ galaxy candidates are consistent with noise. We further expand upon the technique and demonstrate how to properly incorporate prior information on the redshift of the candidate from auxiliary data, such as from JWST. Our work highlights the need to achieve a significance of $\gtrsim 5\sigma$ to confirm an emission line when searching in broad 30 GHz bandwidths. Using our publicly available method enables the quantification of false detection likelihoods, which are crucial for accurately interpreting line detections.
Figures


Figures from the paper (6 more)



Forward citations
Cited by 1 Pith paper
-
A Decentralized Framework for Radio-interferometric Image Reconstruction
A decentralized imaging framework that parallelizes radio-interferometric reconstruction by spatial frequency achieves near-2x speedups with comparable image quality on large datasets.
Reference graph
Works this paper leans on
-
[1]
2024, in American Astronomical So- ciety Meeting Abstracts, V ol
Baker, A., Blyth, S., Holwerda, B., et al. 2024, in American Astronomical So- ciety Meeting Abstracts, V ol. 243, American Astronomical Society Meeting Abstracts, 346.07
work page 2024
-
[2]
Bakx, T. J. L. C., Zavala, J. A., Mitsuhashi, I., et al. 2023, MNRAS, 519, 5076
work page 2023
-
[3]
Baronchelli, I., Bonato, M., De Zotti, G., et al. 2024, Galaxies, 12, 26
work page 2024
-
[4]
M., Rodríguez-Muñoz, L., et al
Baronchelli, I., Scarlata, C. M., Rodríguez-Muñoz, L., et al. 2021, ApJS, 257, 67
work page 2021
-
[5]
& Arnouts, S
Bertin, E. & Arnouts, S. 1996, A&AS, 117, 393
1996
-
[6]
Boogaard, L., Meyer, R. A., & Novak, M. 2021, Interferopy: analysing datacubes from radio-to-submm observations
work page 2021
-
[7]
2024, in Society of Photo-Optical In- strumentation Engineers (SPIE) Conference Series, V ol
Booth, M., Klaassen, P., Cicone, C., et al. 2024, in Society of Photo-Optical In- strumentation Engineers (SPIE) Conference Series, V ol. 13102, Millimeter, Submillimeter, and Far-Infrared Detectors and Instrumentation for Astron- omy XII, ed. J. Zmuidzinas & J.-R. Gao, 1310206
work page 2024
-
[8]
2024a, arXiv e-prints, arXiv:2409.20533
Carniani, S., D’Eugenio, F., Ji, X., et al. 2024a, arXiv e-prints, arXiv:2409.20533
Show all 45 references
-
[9]
2023, in Physics and Chemistry of Star Formation: The Dynamical ISM Across Time and Spatial Scales, ed
Carpenter, J., Brogan, C., Iono, D., & Mroczkowski, T. 2023, in Physics and Chemistry of Star Formation: The Dynamical ISM Across Time and Spatial Scales, ed. V . Ossenkopf-Okada, R. Schaaf, I. Breloy, & J. Stutzki, 304 CASA Team, Bean, B., Bhatnagar, S., et al. 2022, PASP, 13...
2023
-
[10]
2022, ApJ, 938, L15
Castellano, M., Fontana, A., Treu, T., et al. 2022, ApJ, 938, L15
2022
-
[11]
2020, ApJ, 902, 110
Decarli, R., Aravena, M., Boogaard, L., et al. 2020, ApJ, 902, 110
2020
-
[12]
E., Hall, P
Dewdney, P. E., Hall, P. J., Schilizzi, R. T., & Lazio, T. J. L. W. 2009, IEEE Proceedings, 97, 1482 Di Mascolo, L., Saro, A., Mroczkowski, T., et al. 2023, Nature, 615, 809
2009
-
[13]
Endo, A., Werf, P., Janssen, R. M. J., et al. 2012, Journal of Low Temperature Physics, 167, 341
2012
-
[14]
A., Walter, F., et al
Fudamoto, Y ., Oesch, P. A., Walter, F., et al. 2024, MNRAS, 530, 340
2024
-
[15]
L., Burgarella, D., et al
Fujimoto, S., Finkelstein, S. L., Burgarella, D., et al. 2023, ApJ, 955, 130
2023
-
[16]
2024, ApJ, 964, 146 González-López, J., Decarli, R., Pavesi, R., et al
Fujimoto, S., Ouchi, M., Nakajima, K., et al. 2024, ApJ, 964, 146 González-López, J., Decarli, R., Pavesi, R., et al. 2019, ApJ, 882, 139 González-López, J., Novak, M., Decarli, R., et al. 2020, ApJ, 897, 91
2024
-
[17]
K., Ellis, R
Harikane, Y ., Inoue, A. K., Ellis, R. S., et al. 2024, arXiv e-prints, arXiv:2406.18352
2024 arXiv
-
[18]
K., Mawatari, K., et al
Harikane, Y ., Inoue, A. K., Mawatari, K., et al. 2022, ApJ, 929, 1
2022
-
[19]
2023, ApJS, 265, 5
Harikane, Y ., Ouchi, M., Oguri, M., et al. 2023, ApJS, 265, 5
2023
-
[20]
2015, The Messenger, 162, 24
Hatziminaoglou, E., Zwaan, M., Andreani, P., et al. 2015, The Messenger, 162, 24
2015
-
[21]
2023, A&A, 671, A29
Kaasinen, M., van Marrewijk, J., Popping, G., et al. 2023, A&A, 671, A29
2023
-
[22]
J., Verheijen, M., et al
Kazemi-Moridani, A., Baker, A. J., Verheijen, M., et al. 2024, arXiv e-prints, arXiv:2412.11426
2024 arXiv
-
[23]
K., Bower, G
Keating, G. K., Bower, G. C., Marrone, D. P., et al. 2015, ApJ, 814, 140
2015
-
[24]
2020, PASJ, 72, 33
Kitayama, T., Ueda, S., Akahori, T., et al. 2020, PASJ, 72, 33
2020
-
[25]
A., Öberg, K
Loomis, R. A., Öberg, K. I., Andrews, S. M., et al. 2018, AJ, 155, 182
2018
-
[26]
E., et al
Naess, S., Aiola, S., Austermann, J. E., et al. 2020, J. Cosmology Astropart. Phys., 2020, 046
2020
-
[27]
P., Oesch, P
Naidu, R. P., Oesch, P. A., van Dokkum, P., et al. 2022, ApJ, 940, L14
2022
-
[28]
K., Mason, B
Padin, S., Cartwright, J. K., Mason, B. S., et al. 2001, ApJ, 549, L1
2001
-
[29]
E., Riechers, D
Pavesi, R., Sharon, C. E., Riechers, D. A., et al. 2018, ApJ, 864, 49
2018
-
[30]
2020, The Messenger, 181, 16 Planck Collaboration, Ade, P
Petry, D., Stanke, T., Biggs, A., et al. 2020, The Messenger, 181, 16 Planck Collaboration, Ade, P. A. R., Aghanim, N., et al. 2014, A&A, 561, A97
2020
-
[31]
2023, A&A, 669, L8
Popping, G. 2023, A&A, 669, L8
2023
-
[32]
Readhead, A. C. S., Myers, S. T., Pearson, T. J., et al. 2004, Science, 306, 836
2004
-
[33]
F., et al
Romero, C., McWilliam, M., Macías-Pérez, J. F., et al. 2018, A&A, 612, A39
2018
-
[34]
J., Ormerod, K., et al
Schouws, S., Bouwens, R. J., Ormerod, K., et al. 2024, arXiv e-prints, arXiv:2409.20549
2024 arXiv
-
[35]
2014, SoFiA: Source Finding Applica- tion, Astrophysics Source Code Library, record ascl:1412.001
Serra, P., Westmeier, T., Giese, N., et al. 2014, SoFiA: Source Finding Applica- tion, Astrophysics Source Code Library, record ascl:1412.001
2014
-
[36]
K., Marrone, D
Sharp, M. K., Marrone, D. P., Carlstrom, J. E., et al. 2010, ApJ, 713, 82
2010
-
[37]
R., Moran, J
Thompson, A. R., Moran, J. M., & Swenson, George W., J. 2017, Interferometry and Synthesis in Radio Astronomy, 3rd Edition
2017
-
[38]
2022, in Society of Photo- Optical Instrumentation Engineers (SPIE) Conference Series, V ol
Tsukui, T., Iguchi, S., Mitsuhashi, I., & Tadaki, K. 2022, in Society of Photo- Optical Instrumentation Engineers (SPIE) Conference Series, V ol. 12190,
2022
-
[39]
Millimeter, Submillimeter, and Far-Infrared Detectors and Instrumentation for Astronomy XI, ed. J. Zmuidzinas & J.-R. Gao, 121901C van Marrewijk, J. & Di Mascolo, L. 2024, Joshiwavm /jackknify: Release Jack- knify 1.0.0
2024
-
[40]
& Andreani, P
Vio, R. & Andreani, P. 2016, A&A, 589, A20
2016
-
[41]
2016, ApJ, 833, 67 Weiß, A., Kovács, A., Coppin, K., et al
Walter, F., Decarli, R., Aravena, M., et al. 2016, ApJ, 833, 67 Weiß, A., Kovács, A., Coppin, K., et al. 2009, ApJ, 707, 1201
2016
-
[42]
2021, MNRAS, 506, 3962
Westmeier, T., Kitaeff, S., Pallot, D., et al. 2021, MNRAS, 506, 3962
2021
-
[43]
2024, ApJ, 966, L36
Xi, H., Peng, B., Staveley-Smith, L., et al. 2024, ApJ, 966, L36
2024
-
[44]
L., Fujimoto, S., et al
Yoon, I., Carilli, C. L., Fujimoto, S., et al. 2023, ApJ, 950, 61
2023
-
[45]
A., Castellano, M., Akins, H
Zavala, J. A., Castellano, M., Akins, H. B., et al. 2024b, arXiv e-prints, arXiv:2403.10491 Article number, page 11 of 12 A&A proofs: manuscript no. z10_paper Appendix A: Further comparison between the simulated noise and jackknifed realizations Figure A.1 shows the difference...
Reviewed August 10, 2026 · model on record in the stance chip above.
Discussion (0). Continue with ORCID to comment.