REVIEW 1 major objections 6 minor 7 cited by
The LOFAR Two-metre Sky Survey: Deep Fields Data Release 2. I. The ELAIS-N1 field
T0 review · 1 major / 6 minor · reviewed 2026-08-10 · deepseek-v4-flash
Pith's one-line read The final 505-hour, 6-arcsecond, 144 MHz image of ELAIS-N1 reaches 10.7 microjansky per beam noise, half of it from source confusion, making it the most sensitive low-frequency radio map to date.
desk verdict A careful, externally cross-checked final data release: the 10.7 µJy/beam image and catalogue are the real product, while the 'half confusion' claim is explicitly model-dependent and should not be over-read. read the letter →
The pith
A machine-rendered reading of the paper's core claim, the machinery that carries it, and where it could break.
The reading
What carries the argument
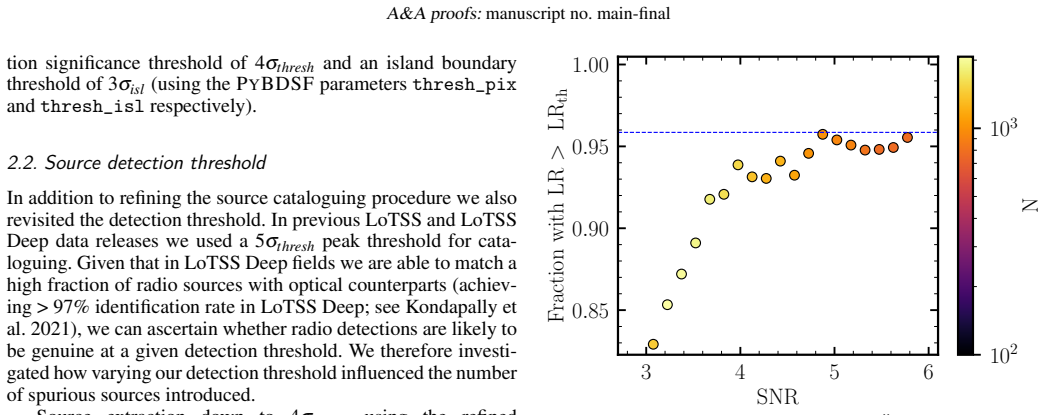
The load-bearing machinery is the 6-arcsecond Stokes I image itself, formed from 505 hours (290 TB) of LOFAR High Band Antenna data after direction-dependent calibration, together with the noise-budget identity $\sigma_{I,\rm RMS}^2 = \sigma_{V,\rm RMS}^2 + \sigma_{\rm CONF}^2$. The thermal term is measured from stacked Stokes V dirty maps, which contain no astrophysical signal for ordinary sources and therefore serve as a thermal-noise benchmark; the confusion term is the difference from the total Stokes I noise, and is reproduced by simulations that inject a point-source population with counts taken from the previous data release above 0.43 mJy and from the T-RECS simulation below that flux. The catalogue side of the argument rests on a multi-step PyBDSF procedure that builds a source-subtracted RMS map, detects at a 4-$\sigma$ peak threshold justified by optical likelihood-ratio matching, and then re-runs detection on residuals to recover complex emission. These two pieces, the noise decomposition and the refined extraction, together carry the paper's central claims.
What would settle it
Re-image the 505-hour dataset after subtracting every source detected in the 0.3-arcsecond international-LOFAR image of the same field: if the residual noise does not drop toward the 7.5 microjansky per beam thermal level, the confusion-noise attribution is wrong. Alternatively, measure the ELAIS-N1 source counts at 0.05-0.4 mJy from the released catalogue; counts that disagree with T-RECS at the relevant flux densities would change the predicted confusion floor and the claim that the 6-arcsecond image is near its sensitivity limit.
Extended reading notes
Core claim
The paper's central claim is that the final 6-arcsecond image of ELAIS-N1 reaches an RMS noise of $10.7\,\mu$Jy beam$^{-1}$ at 144 MHz, making it the most sensitive image achieved at this frequency, and that half of this noise (about $7.5\,\mu$Jy beam$^{-1}$ of thermal noise, with $\sigma_{\rm CONF} = \sqrt{\sigma_{I,\rm RMS}^2 - \sigma_{V,\rm RMS}^2}$) is due to source confusion rather than instrumental or atmospheric noise. On that basis the authors argue the 6-arcsecond map has nearly reached its confusion-limited depth, and that further gains require higher angular resolution rather than more integration time. The release also claims a catalogue of 154,952 sources (182,184 Gaussian components) across 24.53 square degrees, detected down to a 4-$\sigma$ peak threshold after a refined source-extraction procedure, with a flux-density scale accurate to about 9 percent and sub-0.2-arcsecond astrometric agreement with Pan-STARRS for high-significance sources. The same dataset yields 39 high-significance variable sources and three detections of known circularly polarised emitters, with a statistical limit that typical circular polarisation plus leakage is below 0.045 percent.
Load-bearing premise
The load-bearing premise is that stacked Stokes V maps measure the true thermal noise and that the unmeasured population of faint sources below 0.43 mJy follows the T-RECS simulation; if either fails, the claimed half-confusion split shifts, though the total measured 10.7 microjansky per beam stands on its own.
Editorial extensions
If this is right
- Doubling the observing time would lower total noise only from roughly 10.7 to about 8.8 microjansky per beam, because the confusion component would rise from about 7.0 microjansky per beam while thermal noise drops to 5.3; deeper 6-arcsecond imaging is therefore not an efficient route to fainter sources.
- The 154,952-source catalogue, with roughly 30 percent more sources than a 5-sigma extraction would give, provides a large sample of sub-millijansky radio sources for optical identification and demographic studies of star-forming galaxies and active galactic nuclei.
- The 39 high-significance variables, mostly compact and detected in the 0.3-arcsecond image, point to intrinsic changes or scintillation in compact low-frequency emitters as a population to be studied with the multi-epoch data.
- The null Stokes V search confines the typical circular-polarisation fraction plus leakage of unresolved sources to below 0.045 percent, a benchmark for future polarisation surveys.
- At an assumed spectral index of -0.8, the map's sensitivity equals about 1.85 microjansky per beam at 1.4 GHz, placing it on par with planned square-degree-scale surveys at centimetre wavelengths.
Reading between the lines
- If the half-confusion budget is right, the effective scientific depth of this survey is set by angular resolution, not exposure; that makes sub-arcsecond imaging with the international LOFAR stations the natural next step, and suggests similar confusion-limited behaviour in other LoTSS Deep fields once they reach comparable depth.
- The paper's confusion estimate depends on T-RECS source counts below 0.43 mJy; the new catalogue itself can test that assumption, since its own number counts at 0.05-0.4 mJy should either confirm or revise the predicted confusion floor.
- The 5-percent residual flux-scale uncertainty between epochs implies that variability studies of faint sources are bounded by calibration systematics; subtracting facet-level beam-model errors could push sensitivity to smaller modulation indices.
Editorial analysis
A structured set of objections, weighed in public.
Referee Report
Summary. The paper presents the final 6-arcsecond resolution data release of the ELAIS-N1 field from the LOFAR Two-metre Sky Survey Deep Fields project. The authors combine 505 hours of LOFAR HBA observations into a 24.53 square degree image reaching a central RMS noise of 10.7 microjansky per beam at 144 MHz, with a source catalogue of 154,952 sources (182,184 Gaussian components) using a refined PYBDSF detection procedure. They characterise the image quality by measuring a flux density scale accuracy of about 9%, astrometric scatter below 0.2 arcseconds for bright sources relative to Pan-STARRS, the area affected by dynamic range limitations (7.4%), and an epoch-to-epoch flux scale consistency of about 5%. The paper also reports a variability study identifying 39 variable-source candidates and a circular-polarisation search that recovers three known Stokes V emitters and sets an upper limit of 0.045% on the fractional circular polarisation plus leakage. The central claim is that this is the most sensitive image at 144 MHz to date and that approximately half of the noise is due to source confusion, implying the image is approaching the sensitivity limit at 6 arcsecond resolution.
Significance. If the claims hold, this is a landmark data release: it provides the deepest wide-area low-frequency radio continuum image and catalogue currently available, with careful internal consistency checks and external validation against Pan-STARRS, FIRST, GMRT, and LoLSS. The public availability of the deep image, individual epoch images, and catalogues will enable a wide range of astrophysical studies, from radio source populations and AGN physics to variability and polarisation. The paper is particularly strong in its transparent documentation of the processing, the quantified flux-scale and astrometric uncertainties, and the refined source-detection approach that substantially improves completeness at low signal-to-noise. The main caveat is that the decomposition of the total noise into thermal and confusion components relies on an assumed faint source population (T-RECS below 0.43 mJy) rather than direct measurement; the authors acknowledge this but the abstract presents the confusion fraction without qualification.
major comments (1)
- [Abstract; Sec. 4.2, Figs. 11-12] The claim that 'approximately half of the noise is due to source confusion' is model-dependent and should be qualified. The confusion component is derived as sigma_ICONF = sqrt(sigma_IRMS^2 - sigma_VRMS^2), with sigma_VRMS measured from Stokes V maps but sigma_ICONF inferred from simulations that assume the Mandal et al. (2021) counts above 0.43 mJy and T-RECS counts below that flux. As the authors note, the sub-0.43 mJy counts are not directly measured, and the good agreement between the simulated and measured stacked-image noise in Fig. 11 is not fully independent because the same assumed counts are an input to the simulation. Since this decomposition underpins the statement that the image is 'approaching the sensitivity limit', please (i) add a sentence to the Abstract noting the model dependence, and (ii) provide a quantitative uncertainty on sigma_ICONF, e.g. by repeating the simulation with a range of T-RECS normalisations or by fitting the faint counts from the stacked residual maps. The total RMS of 10.7 microjansky per beam is a direct measurement and would stand regardless of this caveat.
minor comments (6)
- [Abstract; Sec. 4.2] The phrase 'half of the noise' would be clearer as 'half of the noise variance' or 'half of the quadrature noise', since the confusion amplitude (about 7.6 microjansky per beam) is comparable to, not half of, the thermal amplitude (7.5 microjansky per beam).
- [Sec. 5, public data release list] The catalogue derived from the individual epoch images is described as containing '36,676 unresolved isolated sources', but Sec. 4.3 states 37,676 sources were searched for variability; please correct the number to 37,676.
- [Appendix A] In the final PYBDSF command, the parameter 'frequency=restfrq' appears to be a typo for 'frequency=restfreq'.
- [Sec. 4.4] The phrase 'the deep field SI sigma_SP' is unclear; it should probably be 'the deep field SI/sigma_SP' or the intended ratio should be written explicitly.
- [Sec. 3.3] The astrometric verification against Pan-STARRS is not fully independent because Pan-STARRS was used for facet alignment during data processing; this is not a problem given the additional comparison with the de Jong et al. (2024) 0.3-arcsecond image, but it could be stated explicitly in the text.
- [Sec. 4.2, Fig. 11 caption] The empirical fit sigma_IRMS = 0.9 sigma_VRMS + 5.7e-4 sigma_VRMS^2 + 3.96 is given without uncertainties on the fitted parameters; please add the fit uncertainties or a note on how the fit was performed.
Circularity Check
No significant circularity: the central sensitivity, confusion, astrometric, and flux-scale claims are grounded in direct measurements or external references.
full rationale
The paper's central claims are direct measurements or standard calibration transfers. The headline noise level of 10.7 uJy/beam is measured from the final image, and the thermal-noise benchmark of 7.5 uJy/beam is measured from stacked Stokes V maps. The confusion component is then defined as sigma_conf = sqrt(sigma_I^2 - sigma_V^2), which is a definitional decomposition from two measured quantities, not a fitted prediction. The Mandal et al. (2021) and T-RECS source counts below 0.43 mJy enter only as inputs to a simulation that reproduces the measured stacked-residual noise trend as a consistency check; the counts are not fitted to the confusion measurement, and the headline confusion fraction does not reduce to those assumed counts. The flux-density scale is aligned to the earlier Sabater et al. (2021) catalogue and then independently cross-checked against FIRST, GMRT, and LoLSS measurements; this is a calibration transfer with external verification, not a circular prediction. The 5% epoch-to-epoch fractional error used in the variability analysis is estimated from the same epoch images, but it functions as a noise model applied to candidate selection rather than a predicted result, and the variability search is not the paper's central claim. The paper explicitly acknowledges the uncertainty in the unmeasured faint counts below 0.43 mJy, which is a stated limitation rather than a concealed circular step. Overall, no derivation step reduces to its own input by construction.
Assumptions & free parameters
free parameters (6)
- SI/SP radial blurring correction coefficients =
1.038 and 0.094 per degree
- Unresolved/extended sigmoid parameters (Eq. 1) =
0.10, 0.93, 14.95, 3.99
- Dynamic range area coefficients (Eq. 2) =
-5.37e-4, 6.62e-3, 22.7
- Flux density scale factor =
0.89
- Per-facet added flux uncertainty relation =
sigma_SI,A = D^-0.76 / 10 * SI
- Source detection thresholds =
thresh_pix=4.0, thresh_isl=3.0
assumptions (5)
- domain assumption The sky model from observation 798146 and 45 calibration directions are sufficient to calibrate all 72 target datasets.
- domain assumption The sub-mJy source population follows the T-RECS simulation extrapolated below 0.43 mJy.
- domain assumption Stokes V stacked dirty maps are a clean thermal-noise benchmark with negligible circular polarisation and leakage.
- domain assumption The likelihood-ratio reliability estimates from the previous multi-wavelength catalogue remain valid for the new 4-sigma radio catalogue.
- domain assumption The Sabater et al. 2021 flux density scale is the correct reference for the 144 MHz map.
Cite this review
Pith. "Pith review of The LOFAR Two-metre Sky Survey: Deep Fields Data Release 2. I. The ELAIS-N1 field." pith.science (2026). https://pith.science/paper/ECEMQ4U5
@misc{pith2026250104093,
  author       = {Pith},
  title        = {Pith review of: The LOFAR Two-metre Sky Survey: Deep Fields Data Release 2. I. The ELAIS-N1 field},
  year         = {2026},
  howpublished = {\url{https://pith.science/paper/ECEMQ4U5}},
  note         = {Machine review of arXiv:2501.04093}
}
abstract
We present the final 6'' resolution data release of the ELAIS-N1 field from the LOw-Frequency ARray (LOFAR) Two-metre Sky Survey Deep Fields project (LoTSS Deep). The 144MHz images are the most sensitive achieved to date at this frequency and were created from 290 TB of data obtained from 505 hrs on-source observations taken over 7.5 years. The data were processed following the strategies developed for previous LoTSS and LoTSS Deep data releases. The resulting images span 24.53 square degrees and, using a refined source detection approach, we identified 154,952 radio sources formed from 182,184 Gaussian components within this area. The maps reach a noise level of 10.7 $\mu$Jy/beam at 6'' resolution where approximately half of the noise is due to source confusion. In about 7.4% of the image our limited dynamic range around bright sources results in a further > 5% increase in the noise. The images have a flux density scale accuracy of about 9% and the standard deviation of offsets between our source positions and those from Pan-STARRS is 0.2'' in RA and Dec for high significance detections. We searched individual epoch images for variable sources, identifying 39 objects with considerable variation. We also searched for circularly polarised sources achieving three detections of previously known emitters (two stars and one pulsar) whilst constraining the typical polarisation fraction plus leakage to be less than 0.045%.
Figures


Figures from the paper (12 more)



Forward citations
Cited by 7 Pith papers
-
Prospects for radio weak lensing: studies using LOFAR observations in the ELAIS-N1 field
In ELAIS-N1, HSC galaxies show a 9 sigma cosmic shear signal, LOFAR ILT data show a 0.15 radio-optical position angle correlation, and simulations suggest a 3200-hour ILT campaign could detect radio shear at about 6.8 sigma.
-
The DESI View of the Faint Radio Source Population in LoTSS DR2
Probabilistic spectroscopic classification of 251k LoTSS radio sources yields the largest high-confidence sample and confirms LERGs accrete below ~1% Eddington while HERGs accrete above it.
-
The LOFAR Two-metre Sky Survey Deep Fields: new probabilistic spectroscopic classifications and the accretion rates of radio galaxies
A probabilistic spectroscopic classification of 4,471 radio sources finds that radiatively efficient and inefficient AGN have distinct Eddington-scaled accretion rates.
-
Investigating radio source population $\&$ spatial characteristics of diffuse Galactic synchrotron emission in the GAMA-23 field with uGMRT Band-3
A 325 MHz uGMRT mosaic of the GAMA-23 field yields a 5741-source catalog, source counts, spectral indices, and angular power spectra of diffuse Galactic synchrotron emission.
-
A description of the radio astronomy data processing tool DDF Pipeline
A single profiling run of the DDF Pipeline on 134.4 GB of LOFAR data took 68.87 hours, with killMS consuming 53.4 percent of the time and DDFacet 33.9 percent.
-
Exploring the Influence of the Jet-environment Interactions on the Observed Asymmetry of Extragalactic Radio Sources with SKAO
A review chapter argues that jet-environment interactions drive radio-source arm-length and flux asymmetries and that SKAO will enable population-scale tests of those effects.
-
A decade of sub-arcsecond imaging with the International LOFAR Telescope
A decade of sub-arcsecond imaging with the International LOFAR Telescope is reviewed, covering calibration, scientific highlights, and future surveys.
Reference graph
Works this paper leans on
- [1]
-
[5]
L., de Gasperin F., Hardcastle M
doi:10.3847/1538- 4357/abcaa3 Williams W. L., de Gasperin F., Hardcastle M. J. H., van Weeren R., Tasse C., Shimwell T. W., Best P. N., et al., 2021, A&A, 655, A40. doi:10.1051/0004- 6361/202141745 White R. L., Becker R. H., Helfand D. J., Gregg M. D., 1997, ApJ, 475,
doi:10.3847/1538- 2021
-
[6]
doi:10.22323/1.277.0006 Jeli´c V ., de Bruyn A. G., Mevius M., Abdalla F. B., Asad K. M. B., Bernardi G., Brentjens M. A., et al., 2014, A&A, 568, A101. doi:10.1051/0004- 6361/201423998 Kondapally R., Best P. N., Hardcastle M. J., Nisbet D., Bonato M., Sabater J., Duncan K. J., et al., 2021, A&A, 648, A3. doi:10.1051/0004- 6361/202038813 Kondapally R., Be...
-
[23]
doi:10.1088/0004-637X/758/1/23 de Gasperin F., et al., 2019, A&A, 622, A5 de Gasperin F., Edler H. W., Williams W. L., Callingham J. R., Asabere B., Brüggen M., Brunetti G., et al., 2023, A&A, 673, A165. doi:10.1051/0004- 6361/202245389 de Jong J. M. G. H. J., van Weeren R. J., Sweijen F., Oonk J. B. R., Shimwell T. W., Offringa A. R., Morabito L. K., et ...
-
[24]
doi:10.3847/1538-4365/abb82a V . Makarov, C. T. Berghea, & J. H. Frouard, Technical Memorandum, AADD USNO, 2017 Mandal S., Prandoni I., Hardcastle M. J., Shimwell T. W., Intema H. T., Tasse C., van Weeren R. J., et al., 2021, A&A, 648, A5. doi:10.1051/0004- 6361/202039998 Mevius M., 2018, ascl.soft. ascl:1806.024 Mingo B., Croston J. H., Best P. N., Dunca...
-
[75]
doi:10.1111/j.1365-2966.2007.12562.x Gloudemans A. J., Duncan K. J., Kondapally R., Sabater J., Cochrane R. K., Röttgering H. J. A., Best P. N., et al., 2021, A&A, 648, A7. doi:10.1051/0004- 6361/202038819 Groeneveld C., van Weeren R. J., Osinga E., Williams W. L., Callingham J. R., de Gasperin F., Botteon A., et al., 2024, NatAs, 8,
arXiv 2007
-
[111]
doi:10.1016/j.ascom.2019.03.003 Sabater J., Best P. N., Tasse C., Hardcastle M. J., Shimwell T. W., Nisbet D., Jelic V ., et al., 2021, A&A, 648, A2. doi:10.1051/0004-6361/202038828 Scaife A. M. M., Heald G. H., 2012, MNRAS, 423, L30. doi:10.1111/j.1745- 3933.2012.01251.x Šnidari´c I., Jeli ´c V ., Mevius M., Brentjens M., Erceg A., Shimwell T. W., Piras ...
arXiv 2019
-
[245]
J., Williams W., de Jong J., Morabito L
doi:10.1093/mnras/stac2140 Ye H., Sweijen F., van Weeren R. J., Williams W., de Jong J., Morabito L. K., Rottgering H., et al., 2024, A&A, 691, A347. doi:10.1051/0004- 6361/202348103 Zwart J. T. L., Santos M., Jarvis M. J., 2015, MNRAS, 453,
Show all 35 references
-
[259]
J., Broderick J
doi:10.1051/aas:1997358 Rowlinson A., Stewart A. J., Broderick J. W., Swinbank J. D., Wijers R. A. M. J., Carbone D., Cendes Y ., et al., 2019, A&C, 27,
2019 doi
-
[269]
M., Tasse C., 2015, MNRAS, 449, 2668 Smith D
doi:10.1111/j.1365-2966.2009.14317.x Smirnov O. M., Tasse C., 2015, MNRAS, 449, 2668 Smith D. J. B., Dunne L., Maddox S. J., Eales S., Bonfield D. G., Jarvis M. J., Sutherland W., et al., 2011, MNRAS, 416,
2009
- [271]
-
[327]
J., Jahoda K., McCammon D., 1986, ApJ, 302,
doi:10.1093/mnras/stu256 Lockman F. J., Jahoda K., McCammon D., 1986, ApJ, 302,
1986 doi
-
[350]
doi:10.48550/arXiv.1410.8706 Tasse C., Hugo B., Mirmont M., Smirnov O., Atemkeng M., Bester L., Hardcas- tle M
doi:10.1038/s41550- 021-01573-z Tasse C., 2014, arXiv, arXiv:1410.8706. doi:10.48550/arXiv.1410.8706 Tasse C., Hugo B., Mirmont M., Smirnov O., Atemkeng M., Bester L., Hardcas- tle M. J., et al., 2018, A&A, 611, A87. doi:10.1051/0004-6361/201731474 Tasse C., Shimwell T., Hardc...
-
[413]
J., Röttgering H
doi:10.1093/mnras/259.3.413 Sweijen F., van Weeren R. J., Röttgering H. J. A., Morabito L. K., Jackson N., Of- fringa A. R., van der Tol S., et al., 2022, NatAs, 6,
2022 doi
-
[432]
A., Schlafly E
doi:10.1086/164002 Magnier E. A., Schlafly E. F., Finkbeiner D. P., Tonry J. L., Goldman B., Röser S., Schilbach E., et al., 2020, ApJS, 251,
2020 doi
-
[479]
H., Jarvis M
doi:10.1086/303564 Whittam I. H., Jarvis M. J., Hale C. L., Prescott M., Morabito L. K., Heywood I., Adams N. J., et al., 2022, MNRAS, 516,
2022 doi
-
[559]
N., Kondapally R., Williams W
doi:10.1086/176166 Best P. N., Kondapally R., Williams W. L., Cochrane R. K., Duncan K. J., Hale C. L., Haskell P., et al., 2023, MNRAS, 523,
2023 doi
-
[749]
J., Boxelaar J
doi:10.1046/j.1365- 8711.2000.03550.x Osinga E., van Weeren R. J., Boxelaar J. M., Brunetti G., Botteon A., Brüggen M., Shimwell T. W., et al., 2021, A&A, 648, A11. doi:10.1051/0004- 6361/202039076 Piras S., Horellou C., Conway J. E., Thomasson M., del Palacio S., Shimwell T. ...
2000
-
[786]
doi:10.1038/s41550- 024-02266-z Hales S. E. G., Masson C. R., Warner P. J., Baldwin J. E., 1990, MNRAS, 246, 256 Hardcastle M. J., Gürkan G., van Weeren R. J., Williams W. L., Best P. N., de Gasperin F., Rafferty D. A., et al., 2016, MNRAS, 462,
1990 doi
-
[857]
doi:10.1111/j.1365- 2966.2011.18827.x Smith D. J. B., Best P. N., Duncan K. J., Hatch N. A., Jarvis M. J., Röttgering H. J. A., Simpson C. J., et al., 2016, sf2a.conf,
2011
-
[974]
K., Kondapally R., Best P
doi:10.1086/422675 Cochrane R. K., Kondapally R., Best P. N., Sabater J., Duncan K. J., Smith D. J. B., Hardcastle M. J., et al., 2023, MNRAS, 523,
2023 doi
-
[977]
J., Nijhuis M., van Diepen G., Offringa A., Krombeen L., de Wever M., Maljaars J., et al., 2023, ascl.soft
doi:10.1093/mnras/stae1204 Dijkema T. J., Nijhuis M., van Diepen G., Offringa A., Krombeen L., de Wever M., Maljaars J., et al., 2023, ascl.soft. ascl:2305.014 Article number, page 18 of 20 Shimwell et al.: ELAIS-N1 Duncan K. J., Kondapally R., Brown M. J. I., Bonato M., Best ...
2023 doi
-
[993]
N., Bondi M., Calistro Rivera G., Cochrane R
doi:10.1093/mnras/stad1913 Bonato M., Prandoni I., De Zotti G., Best P. N., Bondi M., Calistro Rivera G., Cochrane R. K., et al., 2021, A&A, 656, A48. doi:10.1051/0004- 6361/202141286 Bondi M., Scaramella R., Zamorani G., Ciliegi P., Vitello F., Arias M., Best P. N., et al., 2...
2021 doi
-
[1127]
R., van de Gronde J
doi:10.1093/mnras/stz2954 Offringa A. R., van de Gronde J. J., Roerdink J. B. T. M., 2012, A&A, 539, A95. doi:10.1051/0004-6361/201118497 Offringa A. R., 2016, A&A, 595, A99 Oliver S., Rowan-Robinson M., Alexander D. M., Almaini O., Balcells M., Baker A. C., Barcons X., et al....
2012 doi
-
[1693]
J., Cotton W
doi:10.1086/300337 Condon J. J., Cotton W. D., Fomalont E. B., Kellermann K. I., Miller N., Perley R. A., Scott D., et al., 2012, ApJ, 758,
2012 doi
-
[1729]
E., Murphy T., Hancock P
doi:10.1093/mnras/stad1308 Bell M. E., Murphy T., Hancock P. J., Callingham J. R., Johnston S., Kaplan D. L., Hunstead R. W., et al., 2019, MNRAS, 482,
2019 doi
-
[1740]
main-final Appendix A: PyBDSF Source detection Below we detail the multi-step P YBDSF process that we used to generate the catalogue for the ELAIS-N1 deep image
doi:10.1093/mnras/stv1716 Article number, page 19 of 20 A&A proofs: manuscript no. main-final Appendix A: PyBDSF Source detection Below we detail the multi-step P YBDSF process that we used to generate the catalogue for the ELAIS-N1 deep image. – Firstly, we run P YBDSF over t...
-
[1910]
J., Shimwell T
doi:10.1093/mnras/stw1763 Hardcastle M. J., Shimwell T. W., Tasse C., Best P. N., Drabent A., Jarvis M. J., Prandoni I., et al., 2021, A&A, 648, A10. doi:10.1051/0004-6361/202038814 Hale C. L., Williams W., Jarvis M. J., Hardcastle M. J., Morabito L. K., Shimwell T. W., Tasse ...
2021 doi
-
[2150]
T., Jagannathan P., Mooley K
doi:10.1093/mnras/stab3021 Intema H. T., Jagannathan P., Mooley K. P., Frail D. A., 2017, A&A, 598, A78. doi:10.1051/0004-6361/201628536 Ishwara-Chandra C. H., Taylor A. R., Green D. A., Stil J. M., Vaccari M., Ocran E. F., 2020, MNRAS, 497,
2017 doi
-
[2484]
J., de Gasperin F., Röttgering H
doi:10.1093/mnras/sty2801 Böhme L., Schwarz D. J., de Gasperin F., Röttgering H. J. A., Williams W. L., 2023, A&A, 674, A189. doi:10.1051/0004-6361/202245669 Bonaldi A., Hartley P., Ronconi T., De Zotti G., Bonato M., 2023, MNRAS, 524,
2023 doi
-
[3250]
K., Jackson N
doi:10.1093/mnras/stac140 Mohan N., Rafferty D., 2015, ascl.soft, ascl:1502.007 Morabito L. K., Jackson N. J., Mooney S., Sweijen F., Badole S., Kukreti P., Venkattu D., et al., 2022, A&A, 658, A1. doi:10.1051/0004-6361/202140649 Ocran E. F., Taylor A. R., Vaccari M., Ishwara-...
2015 doi
-
[3742]
N., Raouf M., Thomas N
doi:10.1093/mnras/stac1128 Kondapally R., Best P. N., Raouf M., Thomas N. L., Davé R., Sha- bala S. S., Röttgering H. J. A., et al., 2023, MNRAS, 523,
2023 doi
-
[5292]
M., Cotton W
doi:10.1093/mnras/stad1813 Lane W. M., Cotton W. D., van Velzen S., Clarke T. E., Kassim N. E., Helmboldt J. F., Lazio T. J. W., et al., 2014, MNRAS, 440,
2014 doi
-
[5383]
T., Dey A., 1999, ASPC, 191, 111 Jarvis M., Taylor R., Agudo I., Allison J
doi:10.1093/mnras/staa2341 Jannuzi B. T., Dey A., 1999, ASPC, 191, 111 Jarvis M., Taylor R., Agudo I., Allison J. R., Deane R. P., Frank B., Gupta N., et al., 2016, mks..conf,
1999 doi
-
[6082]
J., Cotton W
doi:10.1093/mnras/stad1602 Condon J. J., Cotton W. D., Greisen E. W., Yin Q. F., Perley R. A., Taylor G. B., Broderick J. J., 1998, AJ, 115,
1998 doi
Reviewed August 10, 2026 · model on record in the stance chip above.
Discussion (0). Continue with ORCID to comment.