REVIEW 3 major objections 4 minor 2 cited by
Nebular emission from composite star-forming galaxies -- I. A novel modelling approach
T0 review · 3 major / 4 minor · reviewed 2026-08-10 · deepseek-v4-flash
Pith's one-line read Direct-method oxygen abundances in metal-rich galaxies can underestimate true O/H by factors of up to several.
desk verdict A genuinely useful method paper for composite galaxy emission; the qualitative direct-method bias is solid, but the 'factors of several' at high metallicity rests on an unvaried input distribution. read the letter →
The pith
A machine-rendered reading of the paper's core claim, the machinery that carries it, and where it could break.
The reading
What carries the argument
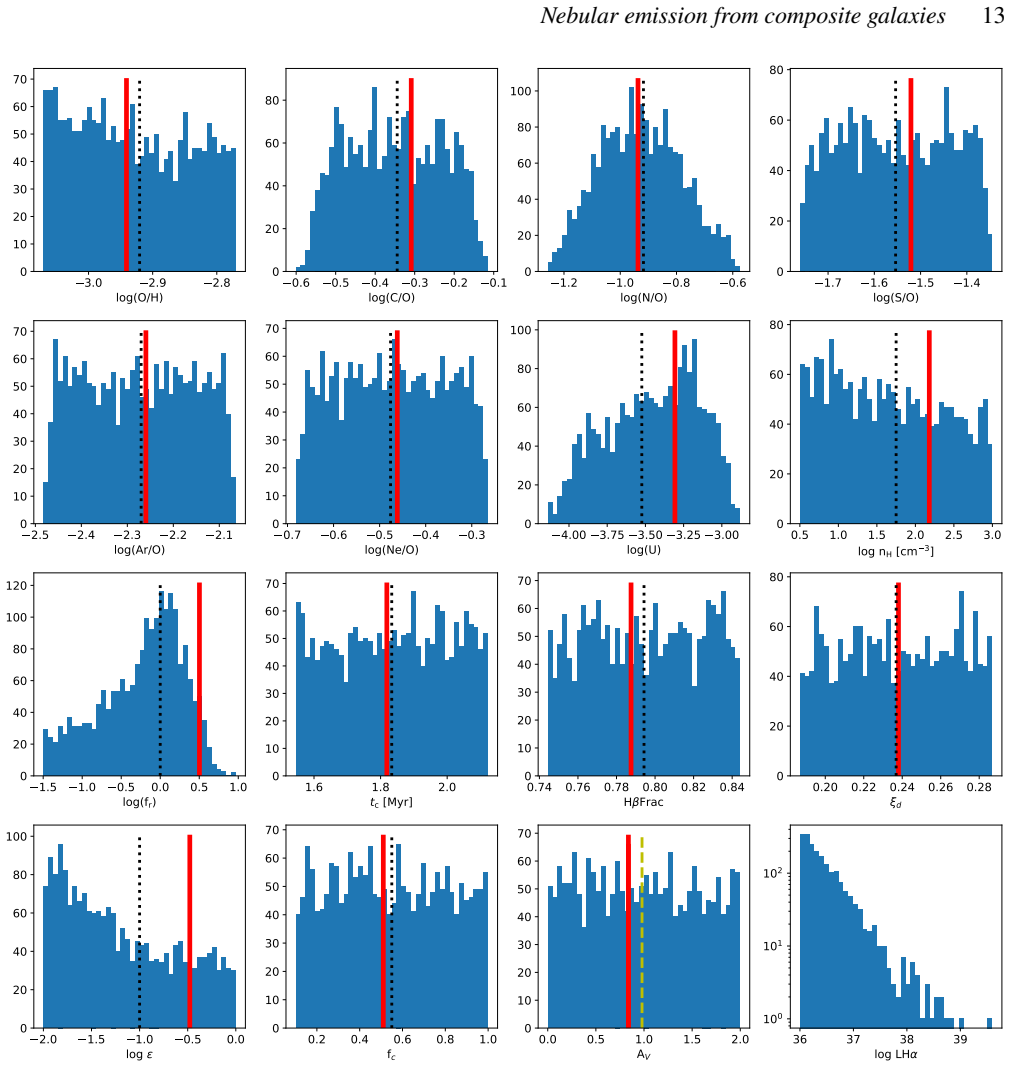
The load-bearing tool is a regression artificial neural network used as a fast surrogate for the photoionization code Cloudy. The network has three hidden layers with 256, 512, and 256 GELU activation cells, is trained on 800,000 of the one-million-model H II region grid, takes 13 input parameters (ionization parameter, hydrogen density, gas filling factor, geometric form factor, stellar age, oxygen, carbon-to-oxygen, nitrogen-to-oxygen, neon-to-oxygen, sulfur-to-oxygen, argon-to-oxygen abundance ratios, the H-$\beta$ fraction of matter-bounded models, and the dust-to-metal mass ratio), and returns 14 emission-line ratios, the electron temperature, and the H-$\alpha$ luminosity. It predicts these quantities with roughly one percent (in dex) scatter, and runs a million predictions in under 0.2 seconds on one GPU. The composite-galaxy construction then draws H II regions from tunable distributions around a galactic baseline: oxygen abundance scatters by $\sigma_{\mathrm{O/H}} = 0.15$ dex, ionization parameter follows the inverse relation $\log U = -2.5 - [\log(\mathrm{O/H})+4]$ with a scatter of 0.5 dex, and regions are kept according to an H-$\alpha$ luminosity function with slope $\alpha_{\mathrm{LF}} = -1.9$. A separate network, the DIG-ANN, adds diffuse ionized gas photoionized by old low-mass evolved stars, and each region receives random dust attenuation before a global H-$\alpha$/H-$\beta$ correction is applied.
What would settle it
Compute integrated spectra for a set of galaxies both by summing measured individual H II region spectra and DIG and by running Cloudy directly on the same region populations; if the direct method on the integrated spectra does not reproduce the factor-of-several O/H deficits predicted at $12+\log(\mathrm{O/H}) > 8.5$ with large temperature spreads, the pipeline's distribution assumptions or its ANN interpolation in that metallicity range would be falsified.
Extended reading notes
Core claim
The core claim is that compositeness itself produces a systematic error in direct-method oxygen abundances. When many H II regions with different physical conditions are summed, the integrated [O III] 4363/5007 and [N II] 5755/6584 ratios are not those of the average region: cold, metal-rich regions contribute most of the strong-line flux, while the faint auroral lines come disproportionately from hotter regions, so the derived electron temperature is biased upward and the derived O/H downward. In the 250,000 synthetic galaxies, this produces a small underestimation of about 0.05 dex at $12+\log(\mathrm{O/H}) < 7.5$ (from the neglect of O$^{3+}$), and a much larger underestimation at $12+\log(\mathrm{O/H}) > 8.5$, reaching factors of up to several. The most severe high-metallicity deficits occur in galaxies with the largest H-$\alpha$-weighted spread in electron temperature among their H II regions ($t^2 > 0.03$), supporting the idea that temperature fluctuations, not just a single-region temperature, govern the bias.
Load-bearing premise
The size and location of the reported bias rest on the assumed distributions of H II region properties inside real galaxies: the width of oxygen-abundance scatter, the inverse ionization-parameter relation, the spread parameters, and the H-alpha luminosity function slope, none of which are validated against observed composite spectra or direct Cloudy calculations of full galaxy spectra.
Editorial extensions
If this is right
- Direct-method metallicity measurements of metal-rich star-forming galaxies should no longer be treated as unbiased estimates of the mean oxygen abundance; the composite nature of the galaxy pulls them low.
- The effect predicts that galaxies with the largest internal temperature spread will show the largest negative offset between direct-method O/H and the H-alpha-weighted truth, a correlation observable with spatially resolved spectroscopy.
- The ANN surrogate makes it practical to run fitting algorithms such as MCMC over millions of H II region models, opening parameter estimation for resolved regions and galaxies that was previously computationally prohibitive.
- The synthetic sample lands in the observed regions of standard diagnostic diagrams such as BPT and VO87, so the model can be used to re-interpret line-ratio sequences in terms of underlying H II region populations.
Reading between the lines
- If the high-metallicity bias applies to real galaxies, direct-method mass-metallicity relations may be too shallow at the metal-rich end, and part of the discrepancy between direct-method and strong-line abundances could trace to which galaxies have large temperature spreads.
- A testable extension is to fit integrated lines with the same ANN in an inversion mode, recovering the H-alpha-weighted distribution of region temperatures and abundances rather than a single-region abundance; the paper's methodology supports this but does not attempt it.
- The adopted inverse relation between ionization parameter and oxygen abundance is a key driver of where the bias appears; re-running the pipeline with a flat or positive log U-O/H relation, as some surveys report, would produce a different bias map and is a direct way to bound the model's assumptions.
Editorial analysis
A structured set of objections, weighed in public.
Referee Report
Summary. The paper introduces a new method for modelling the integrated nebular emission of star-forming galaxies. A regression ANN is trained on approximately 800,000 Cloudy photoionization models of individual HII regions, predicts 16 output quantities (line ratios, electron temperature, H-alpha luminosity) from 13 input parameters, and is validated on a held-out test set. The ANN is then used to assemble 250,000 synthetic composite galaxies containing up to about 3000 HII regions each, with randomly drawn physical parameters, a prescribed H-alpha luminosity function, individual dust attenuation, and a diffuse ionized-gas component photoionized by HOLMES. The main scientific application is an assessment of the direct method for oxygen abundances: the authors find that direct-method O/H estimates can be biased low by about 0.05 dex at low metallicity and, more dramatically, can underestimate the true O/H by factors of up to several at high metallicity, with the largest deficits occurring in galaxies with the largest H-alpha-weighted electron-temperature spread among their constituent HII regions.
Significance. If the quantitative results are robust, the paper provides a fast and flexible tool for an important problem: modelling galaxy-scale nebular emission as a superposition of many HII regions rather than as a single representative region. The use of a held-out test set for the ANN, the generation of a very large public synthetic-galaxy sample, and the reproducibility-oriented release of scripts and trained networks are clear strengths. The qualitative conclusion that direct-method O/H estimates can be biased by temperature-spread effects is consistent with earlier work and is physically plausible. However, the headline quantitative claim of 'factors of up to several' at high metallicity is not yet demonstrated to be independent of the assumed distribution of HII-region properties, particularly the adopted inverse relation between ionization parameter and oxygen abundance. Because the paper presents this bias as a motivation for the new method, the robustness of that result needs to be established.
major comments (3)
- [Section 5.2 / Eq. (3)] The high-metallicity direct-method bias in Fig. 10 is computed from synthetic galaxies built with a single assumed relation between ionization parameter and oxygen abundance. Equation (3) sets log U = -2.5 - [12+log(O/H)-8] plus offsets, so at 12+log(O/H)=9 the baseline log U is -3.5, with sigma_U=0.5; this creates a low-U, low-Te population whose high-Te tail dominates the auroral [O III] 4363 flux. The paper's own Fig. 6 shows that changing the U-O/H relation, for instance to the positive relation of Ji & Yan (2022), substantially moves the models in line-ratio and Te-sensitive diagrams. No experiment in Section 5.2 varies the slope, sign, or scatter of Eq. (3). I therefore ask for a robustness test: recompute the bias map of Fig. 10 for at least a few alternative U-O/H relations (including the positive relation shown in Fig. 6 and a flat relation) and state explicitly how the 'factors of up to several' change. Without such a test, the quantitative magnitude of the high-metallicity bias is a property of the assumed input distribution rather than a demonstrated property of real galaxies.
- [Section 3.2 / Fig. 2] The ANN test error grows toward high oxygen abundance: Fig. 2 shows visibly increasing 5th-95th percentile spreads for 12+log(O/H) > 9, and the text in Section 3.2 acknowledges that the regression model 'starts to lose accuracy' there. This is exactly the regime in which Fig. 10 reports the largest direct-method bias. The paper quotes global standard deviations of 0.01-0.02 dex for the BPT-filtered test set, but it does not propagate the per-region ANN errors through the galaxy-integration procedure into the derived O/H bias. At minimum, the authors should quantify the contribution of ANN interpolation error to the high-metallicity tail of Fig. 10; for example, by Monte Carlo perturbing the ANN outputs by their O/H-dependent error distribution and recomputing the bias map, or by comparing a sample of integrated synthetic galaxies built from ANN predictions against the same galaxies built directly from the underlying Cloudy models.
- [Section 4.2 / Section 5.2] The entire synthetic-galaxy pipeline is validated only at the level of individual HII regions against Cloudy, and in aggregate against observed diagnostic diagrams. There is no direct validation of the integrated composite spectra: no test shows that summing the emission of many Cloudy HII regions with the same parameter distributions and then applying the PyNeb direct method reproduces the integrated line ratios and O/H offsets claimed in Fig. 10. I request a direct comparison for a small subset of galaxies (e.g. a few dozen) in which the full set of constituent HII regions is run with Cloudy, the emission is summed in the same way, and the direct-method O/H is compared with the ANN-based result. This would simultaneously test the ANN systematics at high O/H and the integration procedure, and it would make the bias claim independent of emulation error.
minor comments (4)
- [Table 3] The row for log(Ne/O) gives the description as 'N/O abundance ratio'; this should be 'Ne/O abundance ratio'.
- [Section 5.1] In the discussion of the C/O distribution, the text reads 'corresponding to -3.7 <~ 12+log(O/H) <~ 3.0'; the upper limit should presumably be 9.0 rather than 3.0.
- [Fig. 7 / Section 4.2] The text in Section 4.2 states that the example galaxy shown in Fig. 7 contains 1616 HII regions, while the Fig. 7 caption says 2002 HII regions; these numbers should be reconciled.
- [Section 6] In the summary, 'generic algorithms' should be 'genetic algorithms'.
Circularity Check
No significant circularity: the direct-method bias is an emergent property of the synthetic-galaxy construction, and the ANN is validated on a held-out test set.
full rationale
The paper's derivation chain is: a Cloudy model grid -> a regression ANN emulator (validated on a 20% held-out test set, with standard deviations below ~0.02 dex per Table A1 and Fig. 2) -> 250,000 synthetic composite galaxies built by summing individual HII regions with tunable parameter distributions -> a direct-method O/H bias quantified in Fig. 10. No step reduces a claimed result to an input by construction. The high-metallicity direct-method underestimate is an emergent property of summing many HII regions with different electron temperatures: the integrated auroral-line flux is dominated by the high-T_e tail, whereas the 'true' H-alpha-weighted O/H is computed from input abundances, so the bias is not a restatement of Eq. (3) or of any fitted parameter. The ANN is not fitted to the bias; its target outputs are Cloudy line ratios, and the bias appears only after the synthetic-galaxy summation and the independent PyNeb two-zone direct-method analysis. Equation (3) is an assumed input relation, explicitly attributed to Carton et al. (2017), and the paper itself displays the alternative positive U-O/H relation of Ji & Yan (2022) in Fig. 6, so the assumption is not smuggled in through self-citation. The many self-references (3MdB, PyNeb, AI4Neb, pyCloudy) are software tools or databases rather than load-bearing uniqueness claims. The paper also labels its results 'primarily illustrative' in Section 6, dampening any claim that the quantitative bias map is a universal prediction. The only caveats are robustness/sensitivity concerns rather than circularity: the assumed U-O/H relation and spread parameters in Table 3 are not directly validated against observations, and Fig. 2 shows the ANN loses accuracy at 12+log(O/H) near and above 9, which overlaps the highest-metallicity tail of Fig. 10. These concerns affect the strength of the quantitative claim, but they do not make any equation in the paper equivalent to its own inputs.
Assumptions & free parameters
free parameters (7)
- delta(O/H) galaxy baseline spread =
1.2 dex (chosen)
- sigma(O/H) HII-region spread =
0.15 dex (chosen)
- log U canonical normalization and slope =
-2.5 at 12+log(O/H)=8, slope -1 (eq. 3)
- sigma_U ionization parameter spread =
0.5 dex (chosen)
- alpha_LF H-alpha luminosity function slope =
-1.9 (adopted from Rousseau-Nepton et al. 2018; Santoro et al. 2022)
- delta(X/O) and sigma(X/O) abundance ratio spreads =
0.3 and 0.2 dex (chosen)
- DIGFrac diffuse ionized gas fraction =
uniform in [0, 0.4] (chosen)
assumptions (5)
- domain assumption Cloudy v17.03 photoionization code computes accurate emission-line luminosities for HII regions across the drawn parameter space.
- domain assumption BPASS v2.23 binary stellar population models provide reliable ionizing spectra.
- domain assumption Nicholls et al. (2017) abundance relations and Dopita et al. (2013) depletion factors describe real metal abundances.
- domain assumption ANN interpolation errors are small enough not to change the integrated line ratios and the derived bias.
- ad hoc to paper Diffuse ionized gas is entirely produced by HOLMES, with no contribution from HII-region photon leakage.
Cite this review
Pith. "Pith review of Nebular emission from composite star-forming galaxies -- I. A novel modelling approach." pith.science (2026). https://pith.science/paper/ZHK5GKWP
@misc{pith2026250105424,
  author       = {Pith},
  title        = {Pith review of: Nebular emission from composite star-forming galaxies -- I. A novel modelling approach},
  year         = {2026},
  howpublished = {\url{https://pith.science/paper/ZHK5GKWP}},
  note         = {Machine review of arXiv:2501.05424}
}
read the original abstract
We introduce a novel approach to modelling the nebular emission from star-forming galaxies by combining the contributions from many HII regions incorporating loose trends in physical properties, random dust attenuation, a predefined Halpha luminosity function and a diffuse ionized-gas component. Using a machine-learning-based regression artificial neural network trained on a grid of models generated by the photoionization code Cloudy, we efficiently predict emission-line properties of individual HII regions over a wide range of physical conditions. We generate 250,000 synthetic star-forming galaxies composed of up to 3000 HII regions and explore how variations in parameters affect their integrated emission-line properties. Our results highlight systematic biases in oxygen-abundance estimates derived using traditional methods, emphasizing the importance of accounting for the composite nature of star-forming galaxies when interpreting integrated nebular emission. Future work will leverage this approach to explore in detail its impact on parameter estimates of star-forming galaxies.
Figures


Figures from the paper (7 more)




Forward citations
Cited by 2 Pith papers
-
End-to-end differentiable retrieval of molecular spectra using hydrodynamics, chemistry, and radiative transfer
An end-to-end differentiable JAX pipeline couples 1D hydrodynamics, time-dependent chemistry, and radiative transfer, and recovers shock and rate parameters from synthetic HCO+ spectra.
-
Recovering the properties of the interstellar medium through integrated spectroscopy: application to the z~0 ECO volume-limited star-forming galaxy sample
Integrated optical spectra of 2052 ECO star-forming galaxies, modeled as superpositions of many H II regions, reveal low-excitation gas with average metallicity near 0.3 solar and a mass-metallicity relation consisten...
Reference graph
Works this paper leans on
-
[1]
Abadi M., et al., 2015, TensorFlow : Large-Scale Machine Learning on Heterogeneous Systems
2015
-
[2]
H., Liller W., 1959, @doi [ ] 10.1086/146695 , 130, 45
Aller L. H., Liller W., 1959, @doi [ ] 10.1086/146695 , 130, 45
-
[3]
Alloin D., Collin-Souffrin S., Joly M., Vigroux L., 1979, , 78, 200
1979
-
[4]
Astropy Collaboration et al., 2018, , 156, 123
2018
-
[5]
E., et al., 2022, , 926, 161
Backhaus B. E., et al., 2022, , 926, 161
2022
-
[6]
Badenas-Agusti M., Via \ n a J., Vanderburg A., Blouin S., Dufour P., Xu S., Sha L., 2024, , 529, 1688
2024
-
[7]
M., Terlevich R., 1981, , 93, 817
Baldwin A., Phillips M. M., Terlevich R., 1981, , 93, 817
1981
- [8]
Show all 105 references
-
[9]
aosabook.org
Bayer M., 2012, in Brown A., Wilson G., eds, , The Architecture of Open Source Applications Volume II: Structure, Scale, and a Few More Fearless Hacks. aosabook.org
2012
-
[10]
K., Peiris H
Bird S., Rogers K. K., Peiris H. V., Verde L., Font-Ribera A., Pontzen A., 2019, , 2019, 050
2019
-
[11]
Bron E., et al., 2021, , 645, A28
2021
-
[12]
J., Conroy C., Johnson B
Byler N., Dalcanton J. J., Conroy C., Johnson B. D., Levesque E. M., Berg D. A., 2018, , 863, 14
2018
-
[13]
M., Stanway E
Byrne C. M., Stanway E. R., Eldridge J. J., McSwiney L., Townsend O. T., 2022, , 512, 5329
2022
-
[14]
J., Katz H., Rey M
Cameron A. J., Katz H., Rey M. P., 2023, , 522, L89
2023
-
[15]
Carton D., et al., 2017, , 468, 2140
2017
-
[16]
Chabrier G., 2003, , 586, L133
2003
-
[17]
Charlot S., Longhetti M., 2001, , 323, 887
2001
-
[18]
Cormier D., et al., 2019, , 626, A23
2019
-
[19]
DeRose J., Chen S.-F., White M., Kokron N., 2022, , 2022, 056
2022
-
[20]
A., Sutherland R
Dopita M. A., Sutherland R. S., Nicholls D. C., Kewley L. J., Vogt F. P. A., 2013, , 208, 10
2013
-
[21]
J., Stanway E
Eldridge J. J., Stanway E. R., Xiao L., McClelland L. A. S., Taylor G., Ng M., Greis S. M. L., Bray J. C., 2017, , 34, e058
2017
-
[22]
J., et al., 2017, , 53, 385
Ferland G. J., et al., 2017, , 53, 385
2017
-
[23]
L., 1999, , 111, 63
Fitzpatrick E. L., 1999, , 111, 63
1999
-
[24]
Flores-Fajardo N., Morisset C., Stasi \'n ska G., Binette L., 2011, , 415, 2182
2011
-
[25]
Froese Fischer C., Tachiev G., 2004, Atomic Data and Nuclear Data Tables, 87, 1
2004
-
[26]
Galliano F., 2018, , 476, 1445
2018
-
[27]
G \'o mez-Llanos V., Morisset C., Garc \' a-Rojas J., Jones D., Wesson R., Corradi R. L. M., Boffin H. M. J., 2020, , 498, L82
2020
-
[28]
P., Bovino S., Picogna G., Ercolano B., 2022, , 668, A139
Grassi T., Nauman F., Ramsey J. P., Bovino S., Picogna G., Ercolano B., 2022, , 668, A139
2022
-
[29]
Gutkin J., Charlot S., Bruzual G., 2016, , 462, 1757
2016
-
[30]
R., et al., 2020, Nature, 585, 357
Harris C. R., et al., 2020, Nature, 585, 357
2020
-
[31]
M., et al., 2011, , 730, 5
Heckman T. M., et al., 2011, , 730, 5
2011
- [32]
-
[33]
S., Choi E., 2019, , 487, 333
Hirschmann M., Charlot S., Feltre A., Naab T., Somerville R. S., Choi E., 2019, , 487, 333
2019
-
[34]
T., 2019, , 485, 3569
Ho I. T., 2019, , 485, 3569
2019
-
[35]
J., Ilee J
Holdship J., Viti S., Haworth T. J., Ilee J. D., 2021, , 653, A76
2021
-
[36]
Hu W., et al., 2024, , 971, 21
2024
-
[37]
D., 2007, Computing in Science and Engineering, 9, 90
Hunter J. D., 2007, Computing in Science and Engineering, 9, 90
2007
-
[38]
B., Strom K
Jensen E. B., Strom K. M., Strom S. E., 1976, @doi [ ] 10.1086/154773 , 209, 748
1976 doi
-
[39]
Ji X., Yan R., 2022, , 659, A112
2022
-
[40]
Katz H., et al., 2023, @doi [ ] 10.1093/mnras/stac2657 , 518, 592
2023 doi
-
[41]
Kauffmann G., et al., 2003, , 346, 1055
2003
-
[42]
J., Dopita M
Kewley L. J., Dopita M. A., 2002, , 142, 35
2002
-
[43]
J., Ellison S
Kewley L. J., Ellison S. L., 2008, , 681, 1183
2008
-
[44]
J., Dopita M
Kewley L. J., Dopita M. A., Sutherland R. S., Heisler C. A., Trevena J., 2001, , 556, 121
2001
-
[45]
C., Sutherland R
Kewley L., Nicholls D. C., Sutherland R. S., 2019, Understanding Galaxy Evolution Through Emission Lines, 57, 511
2019
-
[46]
P., Ba J., 2014, arXiv e-prints, p
Kingma D. P., Ba J., 2014, arXiv e-prints, p. arXiv:1412.6980
2014 arXiv
-
[47]
J., Ferland G
Kisielius R., Storey P. J., Ferland G. J., Keenan F. P., 2009, , 397, 903
2009
-
[48]
P., Ferland G
Kisielius R., Kulkarni V. P., Ferland G. J., Bogdanovich P., Lykins M. L., 2014, , 780, 76
2014
-
[49]
A., Kennicutt Jr
Kobulnicky H. A., Kennicutt Jr. R. C., Pizagno J. L., 1999, , 514, 544
1999
-
[50]
Korobov A., 1959, in Dokl. Akad. Nauk SSSR. pp 1207--1210
1959
-
[51]
Lecroq M., et al., 2024, @doi [ ] 10.1093/mnras/stad3838 , 527, 9480
2024 doi
-
[52]
D., Tacchella S., Davies R., Belli S., Park M., Emami R., 2024, arXiv e-prints, p
Li Y., Leja J., Johnson B. D., Tacchella S., Davies R., Belli S., Park M., Emami R., 2024, arXiv e-prints, p. arXiv:2405.04598
2024 arXiv
-
[53]
Liu D., Nocedal J., 1989, Mathematical Programming, 45, 503
1989
-
[54]
Z., S \'a nchez S
Lugo-Aranda A. Z., S \'a nchez S. F., Barrera-Ballesteros J. K., L \'o pez-Cob \'a C., Espinosa-Ponce C., Galbany L., Anderson J. P., 2024, , 528, 6099
2024
-
[55]
A., 2015, , 573, A42
Luridiana V., Morisset C., Shaw R. A., 2015, , 573, A42
2015
-
[56]
Maltsev K., Schneider F. R. N., R \"o pke F. K., Jordan A. I., Qadir G. A., Kerzendorf W. E., Riedmiller K., van der Smagt P., 2024, , 681, A86
2024
-
[57]
A., et al., 2013, , 559, A114
Marino R. A., et al., 2013, , 559, A114
2013
-
[58]
Mart \' nez-Paredes M., Bruzual G., Morisset C., Kim M., Mel \'e ndez M., Binette L., 2023, , 525, 2916
2023
-
[59]
Mast D., et al., 2014, , 561, A129
2014
-
[60]
McClymont W., et al., 2024, @doi [ ] 10.1093/mnras/stae1587 , 532, 2016
2024 doi
-
[61]
S., 1991, , 380, 140
McGaugh S. S., 1991, , 380, 140
1991
-
[62]
H., Heavens A
Mootoovaloo A., Jaffe A. H., Heavens A. F., Leclercq F., 2022, Astronomy and Computing, 38, 100508
2022
-
[63]
Edited by C
Morisset C., 2014, in Asymmetrical Planetary Nebulae VI conference, Proceedings of the conference held 4-8 November, 2013. Edited by C. Morisset, G. Delgado-Inglada and S. Torres-Peimbert
2014
-
[64]
Morisset C., Delgado-Inglada G., Flores-Fajardo N., 2015, , 51, 103
2015
-
[65]
Morisset C., et al., 2016, , 594, A37
2016
-
[66]
Morisset C., Luridiana V., Garc \' a-Rojas J., G \'o mez-Llanos V., Bautista M., Mendoza C., 2020, Atoms, 8, 66
2020
-
[67]
C., Sutherland R
Nicholls D. C., Sutherland R. S., Dopita M. A., Kewley L. J., Groves B. A., 2017, , 466, 4403
2017
-
[68]
E., Ferland G
Osterbrock D. E., Ferland G. J., 2006, Astrophysics of gaseous nebulae and active galactic nuclei
2006
-
[69]
Pagel B. E. J., Edmunds M. G., Blackwell D. E., Chun M. S., Smith G., 1979, @doi [ ] 10.1093/mnras/189.1.95 , 189, 95
1979 doi
-
[70]
Palud P., et al., 2023, @doi [ ] 10.1051/0004-6361/202347074 , 678, A198
2023 doi
-
[71]
Pedregosa F., et al., 2011, Journal of Machine Learning Research, 12, 2825
2011
-
[72]
Peimbert M., 1967, , 150, 825
1967
-
[73]
Peimbert M., Costero R., 1969, Boletin de los Observatorios Tonantzintla y Tacubaya, 5, 3
1969
-
[74]
P \'e rez-Montero E., 2017, , 129, 043001
2017
-
[75]
K., Bizyaev D., 2023, arXiv e-prints, p
Postnikova V. K., Bizyaev D., 2023, arXiv e-prints, p. arXiv:2307.01544
2023 arXiv
-
[76]
Ramambason L., et al., 2022, , 667, A35
2022
-
[77]
Ramirez S., Icaza-Lizaola M., Fromenteau S., Vargas-Maga \ n a M., Aviles A., 2024, , 2024, 049
2024
-
[78]
Rautio R. P. V., Watkins A. E., Comer \'o n S., Salo H., D \' az-Garc \' a S., Janz J., 2022, , 659, A153
2022
-
[79]
Reza M., Zhang Y., Nord B., Poh J., Ciprijanovic A., Strigari L., 2022, in Machine Learning for Astrophysics. p. 20
2022
-
[80]
P., Drissen L., Martin T., 2018, , 477, 4152
Rousseau-Nepton L., Robert C., Martin R. P., Drissen L., Martin T., 2018, , 477, 4152
2018
-
[81]
L., Shapley A
Sanders R. L., Shapley A. E., Zhang K., Yan R., 2017, , 850, 136
2017
-
[82]
Santoro F., et al., 2022, , 658, A188
2022
-
[83]
L., Tremonti C., Belfiore F., Pace Z., Bershady M
Schaefer A. L., Tremonti C., Belfiore F., Pace Z., Bershady M. A., Andrews B. H., Drory N., 2020, , 890, L3
2020
-
[84]
I., 2019, , 622, L10
Schaerer D., Fragos T., Izotov Y. I., 2019, , 622, L10
2019
-
[85]
P., Mirocha J., Reines A
Senchyna P., Stark D. P., Mirocha J., Reines A. E., Charlot S., Jones T., Mulchaey J. S., 2020, , 494, 941
2020
-
[86]
V., Molyarova T., Semenov D
Smirnov-Pinchukov G. V., Molyarova T., Semenov D. A., Akimkin V. V., van Terwisga S., Francheschi R., Henning T., 2022, , 666, L8
2022
-
[87]
R., Eldridge J
Stanway E. R., Eldridge J. J., 2018, , 479, 75
2018
-
[88]
Stasi \'n ska G., 2005, , 434, 507
2005
- [89]
-
[90]
V., 2006, , 371, 972
Stasi \'n ska G., Cid Fernandes R., Mateus A., Sodr \'e L., Asari N. V., 2006, , 371, 972
2006
-
[91]
Stasi \'n ska G., Izotov Y., Morisset C., Guseva N., 2015, , 576, A83
2015
-
[92]
J., Sochi T., Badnell N
Storey P. J., Sochi T., Badnell N. R., 2014, , 441, 3028
2014
-
[93]
Tachiev G., Froese Fischer C., 2001, Canadian Journal of Physics, 79, 955
2001
-
[94]
S., 2011, , 195, 12
Tayal S. S., 2011, , 195, 12
2011
-
[95]
S., Zatsarinny O., 2010, , 188, 32
Tayal S. S., Zatsarinny O., 2010, , 188, 32
2010
-
[96]
The Astropy Collaboration et al., 2013, preprint
2013
-
[97]
R., et al., 2023, , 945, 35
Trump J. R., et al., 2023, , 945, 35
2023
-
[98]
Umeda H., Ouchi M., Nakajima K., Isobe Y., Aoyama S., Harikane Y., Ono Y., Matsumoto A., 2022, @doi [ ] 10.3847/1538-4357/ac602d , 930, 37
2022 doi
-
[99]
Vale Asari N., Stasi \'n ska G., Morisset C., Cid Fernandes R., 2016, , 460, 1739
2016
-
[100]
E., 1987, , 63, 295
Veilleux S., Osterbrock D. E., 1987, , 63, 295
1987
-
[101]
Virtanen P., et al., 2020, Nature Methods, 17, 261
2020
-
[102]
pp 56 -- 61
W es M c K inney 2010, in S t\'efan van der W alt J arrod M illman eds, P roceedings of the 9th P ython in S cience C onference. pp 56 -- 61
2010
-
[103]
F., Boada S., 2019, , 484, 4683
Wu J. F., Boada S., 2019, , 484, 4683
2019
-
[104]
R., et al., 2015, , 798, 29
Zeimann G. R., et al., 2015, , 798, 29
2015
-
[105]
pandas development team T., 2020, pandas-dev/pandas: Pandas, @doi 10.5281/zenodo.3509134 , https://doi.org/10.5281/zenodo.3509134
2020 doi
Reviewed August 10, 2026 · model on record in the stance chip above.
Discussion (0). Continue with ORCID to comment.