REVIEW 3 major objections 5 minor 77 references
High Lithium Abundance Connection with the Chromospheric Helium in Red Giants: Spectroscopic and Asteroseismic analyses
T0 review · 3 major / 5 minor · reviewed 2026-08-10 · deepseek-v4-flash
Pith's one-line read High lithium and strong helium appear only in red clump giants.
desk verdict New He I 10830, Li, and asteroseismic-phase data for 84 Kepler giants — a genuinely useful, refereable paper whose 'exclusively RC' claim is real in-sample but stronger than its literature-selected sample can prove. read the letter →
The pith
A machine-rendered reading of the paper's core claim, the machinery that carries it, and where it could break.
The reading
What carries the argument
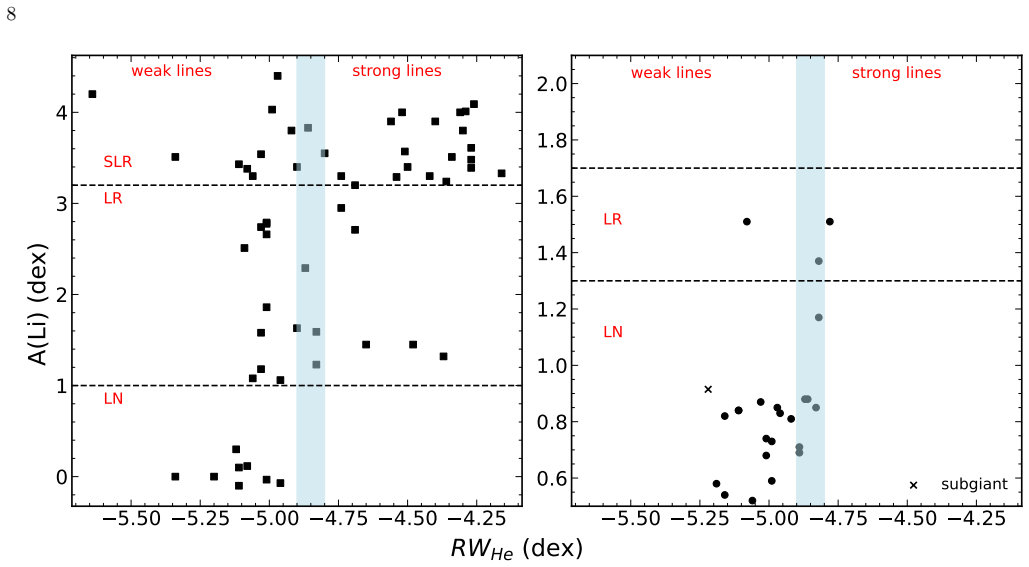
The load-bearing clock is the asteroseismic mixed-mode period spacing $\Delta P$ (and the asymptotic g-mode period spacing $\Delta\Pi_1$ for the best-quality light curves), which separates pre-flash red giant branch stars ($\Delta P < 150$ s) from post-flash red clump stars and orders the clump stars by age since the flash. The other central object is the reduced width of the chromospheric He I 10830 Å line, $RW_{\rm He} = \log_{10}(EW_{\rm He}/\lambda)$, with the threshold $RW_{\rm He} = -4.85$ separating weak from strong profiles; after subtracting contaminating photospheric lines, this measures chromospheric activity rather than photospheric helium abundance. The paper's correlation plot of $A(\rm Li)$ against $RW_{\rm He}$, split by evolutionary phase, is the evidence that carries the argument.
What would settle it
Perform a blind, volume-complete survey of Kepler-field giants in which every star (not only known lithium-rich ones) is observed in He I 10830 and asteroseismically classified; a single red giant branch star with $A(\rm Li) > 3.2$ dex and $RW_{\rm He} > -4.85$ would falsify the claimed exclusivity. Alternatively, a re-analysis showing that the RGB stars in this sample have systematically lower signal-to-noise in the 10830 Å region than the RC stars would invalidate the absence as a detection artifact.
Extended reading notes
Core claim
The central claim is that the helium flash is the common origin of both the rare high lithium abundances and the strong chromospheric He I 10830 Å absorption seen in a subset of red giants. In a sample of 84 giants with asteroseismically determined evolutionary states, every star with strong He I and high lithium is a red clump star in core helium burning; none of the red giant branch stars show the combination. The strength of the He I line falls steadily with decreasing lithium abundance among clump stars, and the distribution tracks clump age: younger clump stars (smaller period spacings) are mostly super-lithium-rich and helium-strong, while older clump stars are lithium-normal and helium-weak. The authors interpret this as temporal evolution after the helium flash: the flash and its sub-flashes enrich lithium in the photosphere and trigger a burst of chromospheric activity that fades over the clump lifetime.
Load-bearing premise
The result assumes that the 84 stars—drawn from published lithium surveys and a brightness cut $3 < J_{\rm mag} < 13$—fairly represent the true joint distribution of lithium and helium line strengths across both evolutionary phases, so the absence of strong helium among red giant branch stars is real stellar physics rather than a selection effect.
Editorial extensions
If this is right
- The long-standing puzzle of lithium-rich giants narrows: high photospheric lithium in low-mass giants is largely a post-helium-flash phenomenon, not a generic red giant branch event.
- Strong He I 10830 absorption can serve as a cheap, single-epoch indicator of a recent helium flash, identifying young red clump stars without asteroseismology.
- The lithium-rich phase among red clump stars is transient; as the clump ages, both lithium abundance and chromospheric helium strength decay, which explains why lithium-rich giants are so rare.
- RGB stars that are lithium-rich must have a different production mechanism than the flash (e.g., binary interaction), since they do not show the accompanying chromospheric helium enhancement.
- The correlation between He I and Ca II H&K activity among helium-strong clump stars supports a flash-triggered chromospheric activity episode rather than a change in helium abundance.
Reading between the lines
- If the exclusivity holds, a targeted search for He I 10830 in the small set of reportedly lithium-rich RGB stars (e.g., in open clusters) would directly test whether those stars are misclassified or truly a separate phenomenon; the paper's sample cannot fully exclude such cases.
- The age decay implied by the $\Delta\Pi_1$ trend could be quantified into a timescale by combining the observed lithium and helium decay with asteroseismic clump ages, giving a measurable 'flash clock' for individual stars.
- Because the paper relies on literature-compiled lithium abundances, a complete spectroscopic survey of the same Kepler giants without pre-selection on lithium would verify that the RGB/RC difference is not an artifact of which stars happened to have measured lithium.
- Chromospheric modeling that converts the helium equivalent widths into actual helium column densities, as the authors suggest, would distinguish flash-triggered activity from flash-triggered helium dredge-up, resolving the physical mechanism.
Editorial analysis
A structured set of objections, weighed in public.
Referee Report
Summary. The manuscript reports a study of 84 Kepler-field red giants with asteroseismic classification into RGB, RC (core He-burning), and one subgiant, combining Li abundances from the literature or new LAMOST measurements with high-resolution HPF spectra of the chromospheric He I 10830 Å line. The central claim is that high Li abundance and strong He I 10830 absorption appear only among RC giants, that He I strength declines with decreasing Li abundance within the RC, and that younger, super-Li-rich RC giants tend to be He-strong while older, Li-normal RC giants are He-weak. On this basis the authors propose that the He-flash and subsequent sub-flashes jointly produce Li enhancement and transient chromospheric activity, with both phenomena fading over post-flash timescales.
Significance. If the exclusivity and temporal-decline claims hold, the paper would provide a novel observational connection between the He-flash, Li enrichment, and chromospheric activity in low-mass giants, with direct implications for models of flash-induced mixing and mass-loss. The paper has concrete strengths: it uses established reduction and analysis pipelines (pySYD, ACTIN, MOOG, SPECTRE, VOSA), reports per-star uncertainties for the key quantities, provides a machine-readable table, and combines literature and new measurements in a transparent way. The asteroseismic classification with period spacings is a meaningful advance over earlier Li-rich giant samples without phase information. The main limitation is that the sample is assembled from published Li surveys rather than a blind, complete asteroseismic sample, so the central 'exclusive to RC' statement requires careful scrutiny against selection effects.
major comments (3)
- [§2 and Fig. 9] The central claim that high Li and strong He I 10830 are 'clearly absent' on the RGB while 'prominent among RC giants' rests on a sample that is not a complete or blind asteroseismic survey: Section 2 states the targets were gathered by searching for Kepler giants with published Li abundances (Singh et al. 2019, 2021; Yan et al. 2021; Takeda & Tajitsu 2017) plus 39 LAMOST stars. If the underlying Li surveys preferentially targeted RC candidates or Li-rich objects, or if RGB stars with high Li and strong He exist outside the selected literature (as the paper's own Section 1 notes for cluster RGB Li-rich stars), then the exclusivity result in Figure 9 could be a selection artifact rather than an evolutionary signature. The authors should either demonstrate that the RGB subsample of 24 stars is representative of the RGB population in the same Kepler field at similar SNR and selection completeness, or soften the 'clear absence' claim accordingly.
- [§5.4, §6, and §8] The counts underpinning the temporal-decline and group-proportion statements are internally inconsistent. Section 5.4 states the sample has 59 CHeB stars, but Section 6 begins 'Of all 58 CHeB stars' and later reports 31 SLR and 19 RC-LR, while Section 8 reports '18 RC LR' and 'Majority (20 out of 29) of SLR RC Giants'. These differences (59 vs 58 CHeB; 31 vs 29 SLR; 19 vs 18 RC-LR) are not explained and directly affect the claimed 'steady decline' and the majority-statements. The manuscript should reconcile these numbers and, ideally, present the counts in a single summary table so that the reader can verify the proportions.
- [§6, §8, and Fig. 9 caption] The He-strong/weak threshold is applied inconsistently. Section 6 defines RWHe = -4.85 as the boundary, but Section 8 refers to 'R_WHe > 4.80 dex as defined in Sneden et al. (2022)', which has the wrong sign and value. Figure 9 shows a vertical shaded band but does not specify its edges on the plot, making it difficult to know which stars are counted as 'on the uncertainty band' versus clearly strong or weak. Please state the threshold and its uncertainty explicitly (e.g., RWHe > -4.85 for strong, with a transition band), and ensure all text, captions, and table entries use the same convention.
minor comments (5)
- [§6] The definition of RWHe = log10(EW_He/λ) does not state the reference wavelength λ; please specify λ = 10830 Å so the numerical values are reproducible.
- [§8] The text refers to 'R_WHe > 4.80 dex' where the sign appears to be a typo; it should be '> -4.85' or '> -4.80' to match the threshold defined in Section 6.
- [§5.3] The sentence 'Lightkurve cannot accurately fit Gaussians in narrow ranges' is vague; consider replacing it with a concrete statement about the adopted frequency-window width and why pySYD was used for the final parameters.
- [Fig. 9 and §6] The group labels in Figure 9 (LN, LR, SLR) are defined for RC stars in the text but the same abbreviations are used in the right panel for RGB stars; please clarify in the caption that the RGB groups use the different thresholds given in Section 6.
- [§2] The brightness cut 3 < Jmag < 13 is introduced without a discussion of how it interacts with the completeness of the underlying Li surveys; a sentence explaining the SNR rationale and any resulting Malmquist-type bias would help the reader assess the sample's representativeness.
Circularity Check
No circular derivation: measured correlations, external thresholds; only minor non-load-bearing self-citations.
full rationale
The paper's central claims are empirical correlations between independently measured quantities: photospheric Li abundances (from literature or new LAMOST spectrum synthesis) and chromospheric He I 10830 equivalent widths (from new HPF spectra), with evolutionary phases assigned from asteroseismic ΔP using standard criteria (Vrard et al. 2016; Ting et al. 2018). No parameter is fitted to a subset of the data and then used to 'predict' the same quantity; Figure 9 is a contingency summary of measured values, not a derivation. The He-strong/weak threshold (RWHe = -4.85) and the Li-rich/SLR grouping are adopted from the authors' prior papers (Sneden et al. 2022; Singh et al. 2021), and the age ordering of RC stars leans on Singh et al. (2021), but these are applied to new independent observations and the correlation itself is not forced by the thresholds. The 'young vs old' interpretation is also supported by the paper's own Figure 11 (ΔP and ΔΠ1 vs A(Li)). The literature-based sample selection (Section 2) could bias the RGB/RC comparison, and some count inconsistencies appear (e.g., 58 vs 59 CHeB stars, 31 vs 29 SLR), but these are selection-bias and internal-consistency concerns, not circular reasoning. Overall, the derivation chain is self-contained against external data; at most there is minor self-citation that is not load-bearing.
Assumptions & free parameters
free parameters (2)
- RWHe strong/weak threshold =
-4.85 dex
- A(Li) group thresholds =
1.0, 3.2 dex for RC; 1.7 dex for RGB
assumptions (4)
- domain assumption DeltaP threshold of 150 s cleanly separates RGB from RC stars
- domain assumption He I 10830 is chromospheric and its measured EW after subtracting photospheric blends traces chromospheric He absorption
- domain assumption DeltaP and DeltaPi1 values monotonically trace time since the He-flash for RC giants
- domain assumption LTE analysis with ATLAS9/MOOG and LASP parameters yields A(Li) on a scale consistent with literature A(Li) values
Cite this review
Pith. "Pith review of High Lithium Abundance Connection with the Chromospheric Helium in Red Giants: Spectroscopic and Asteroseismic analyses." pith.science (2026). https://pith.science/paper/IHUADYJL
@misc{pith2026250108863,
  author       = {Pith},
  title        = {Pith review of: High Lithium Abundance Connection with the Chromospheric Helium in Red Giants: Spectroscopic and Asteroseismic analyses},
  year         = {2026},
  howpublished = {\url{https://pith.science/paper/IHUADYJL}},
  note         = {Machine review of arXiv:2501.08863}
}
read the original abstract
We present a study of correlations between high Li abundances and strong chromospheric He I 10830 \AA\ absorption line strengths in Kepler field giant stars. Our sample includes 84 giants with detectable solar-like oscillations in their lightcurves, and their Li abundances come from the literature or were measured here using LAMOST medium-resolution spectra. Evolutionary phases are determined through asteroseismic analysis, with mixed-mode period spacing (\Delta P) used to infer the time evolution of RC giants. Near-infrared observations of the He I \lambda 10830 line were obtained with the high-resolution Habitable-zone Planet Finder (HPF) spectrograph on the Hobby-Eberly Telescope (HET). We find high Li abundances and strong He I lines exclusively among red clump (RC) giants, with their absence in red giant branch stars suggesting a shared origin linked to the He-flash. Additionally, a steady decline in He I strength with decreasing Li abundance among RC giants indicates a correlation between these properties. Older, Li-normal RC giants are He-weak, while most younger super-Li-rich giants are He-strong, suggesting temporal evolution of both phenomena. We hypothesize that the core He-flash and subsequent sub-flashes may enhance Li abundances in RC giant photospheres and trigger heightened chromospheric activity, leading to stronger He I \lambda 10830 \AA\ lines in younger RCs. Over time, post-He-flash, chromospheric activity diminishes, resulting in weaker He I lines in older, Li-normal RCs.
Figures


Figures from the paper (6 more)




Reference graph
Works this paper leans on
-
[1]
M., Biazzo, K., Covino, E., Frasca, A., & Bedin, L
Alcal´ a, J. M., Biazzo, K., Covino, E., Frasca, A., & Bedin, L. R. 2011, A&A, 531, L12, doi: 10.1051/0004-6361/201117174
-
[2]
2018, A&A, 616, A8, doi: 10.1051/0004-6361/201732516
Andrae, R., Fouesneau, M., Creevey, O., et al. 2018, A&A, 616, A8, doi: 10.1051/0004-6361/201732516
-
[3]
Asplund, M., Grevesse, N., Sauval, A. J., & Scott, P. 2009, ARA&A, 47, 481, doi: 10.1146/annurev.astro.46.060407.145222
arXiv 2009
-
[4]
R., Mosser, B., Huber, D., et al
Bedding, T. R., Mosser, B., Huber, D., et al. 2011, Nature, 471, 608, doi: 10.1038/nature09935
-
[5]
J., Koch, D., Basri, G., et al
Borucki, W. J., Koch, D., Basri, G., et al. 2010, Science, 327, 977, doi: 10.1126/science.1185402
-
[6]
Brandt, T. D. 2021, ApJS, 254, 42, doi: 10.3847/1538-4365/abf93c
-
[7]
Brown, T. M., Latham, D. W., Everett, M. E., & Esquerdo, G. A. 2011, AJ, 142, 112, doi: 10.1088/0004-6256/142/4/112
-
[8]
Cameron, A. G. W., & Fowler, W. A. 1971, ApJ, 164, 111, doi: 10.1086/150821
doi:10.1086/150821 1971
Show all 77 references
-
[9]
R., Ho, A
Casey, A. R., Ho, A. Y. Q., Ness, M., et al. 2019, ApJ, 880, 125, doi: 10.3847/1538-4357/ab27bf
2019 doi
-
[10]
Castelli, F., & Kurucz, R. L. 2003, in Modelling of Stellar Atmospheres, ed. N. Piskunov, W. W. Weiss, & D. F
2003
- [11]
-
[12]
2001, Journal of Astronomical Data, 7, 8
Catala, C., & COROT Team. 2001, Journal of Astronomical Data, 7, 8
2001
-
[13]
2022, The Journal of Open Source Software, 7, 3331, doi: 10.21105/joss.03331
Chontos, A., Huber, D., Sayeed, M., & Yamsiri, P. 2022, The Journal of Open Source Software, 7, 3331, doi: 10.21105/joss.03331
2022 doi
-
[14]
E., & Kepler Team
Coughlin, J., Thompson, S. E., & Kepler Team. 2017, in American Astronomical Society Meeting Abstracts, Vol. 230, American Astronomical Society Meeting Abstracts #230, 102.04
2017
-
[15]
H., Fields, B
Cyburt, R. H., Fields, B. D., & Olive, K. A. 2008, JCAP, 2008, 012, doi: 10.1088/1475-7516/2008/11/012 Deepak, & Reddy, B. E. 2019, MNRAS, 484, 2000, doi: 10.1093/mnras/stz128
2008 doi
-
[16]
K., Strader, J., & Smith, G
Dupree, A. K., Strader, J., & Smith, G. H. 2011, ApJ, 728, 155, doi: 10.1088/0004-637X/728/2/155
2011 doi
-
[17]
J., & Sneden, C
Fitzpatrick, M. J., & Sneden, C. 1987, in Bulletin of the American Astronomical Society, Vol. 19, 1129 Garc ´ ıa P´ erez, A. E., Allende Prieto, C., Holtzman, J. A., et al. 2016, AJ, 151, 144, doi: 10.3847/0004-6256/151/6/144
1987 doi
-
[18]
2022, A&A, 668, A116, doi: 10.1051/0004-6361/202245083 Gomes da Silva, J., Figueira, P., Santos, N., & Faria, J
Gehan, C., Gaulme, P., & Yu, J. 2022, A&A, 668, A116, doi: 10.1051/0004-6361/202245083 Gomes da Silva, J., Figueira, P., Santos, N., & Faria, J. 2018, The Journal of Open Source Software, 3, 667, doi: 10.21105/joss.00667 Gomes da Silva, J., Santos, N. C., Adibekyan, V., et al....
2022 doi
-
[19]
2023, A&A, 674, A9, doi: 10.1051/0004-6361/202243969
Halbwachs, J.-L., Pourbaix, D., Arenou, F., et al. 2023, A&A, 674, A9, doi: 10.1051/0004-6361/202243969
2023 doi
-
[20]
C., Lockwood, G
Hall, J. C., Lockwood, G. W., & Skiff, B. A. 2007, AJ, 133, 862, doi: 10.1086/510356
2007 doi
-
[21]
Handberg, R., & Lund, M. N. 2014, MNRAS, 445, 2698, doi: 10.1093/mnras/stu1823
2014 doi
-
[22]
P., & Pandey, G
Hema, B. P., & Pandey, G. 2014, ApJL, 792, L28, doi: 10.1088/2041-8205/792/2/L28
2014 doi
-
[23]
A., & Pereira, C
Holanda, N., Drake, N. A., & Pereira, C. B. 2020, AJ, 159, 9, doi: 10.3847/1538-3881/ab5528
2020 doi
-
[24]
A., Hasselquist, S., Shetrone, M., et al
Holtzman, J. A., Hasselquist, S., Shetrone, M., et al. 2018, AJ, 156, 125, doi: 10.3847/1538-3881/aad4f9
2018 doi
-
[25]
A., et al
Hon, M., Stello, D., Garc ´ ıa, R. A., et al. 2019, MNRAS, 485, 5616, doi: 10.1093/mnras/stz622
2019 doi
- [26]
-
[27]
1968, ApJ, 154, 581, doi: 10.1086/149782
Iben, Icko, J. 1968, ApJ, 154, 581, doi: 10.1086/149782
1968 doi
-
[28]
2024, A&A, 687, A189, doi: 10.1051/0004-6361/202449476
Jian, M., Fu, X., Matsunaga, N., et al. 2024, A&A, 687, A189, doi: 10.1051/0004-6361/202449476
2024 doi
-
[29]
2023, A&A, 674, A5, doi: 10.1051/0004-6361/202244220
Katz, D., Sartoretti, P., Guerrier, A., et al. 2023, A&A, 674, A5, doi: 10.1051/0004-6361/202244220
2023 doi
-
[30]
N., Guhathakurta, P., Zhang, A
Kirby, E. N., Guhathakurta, P., Zhang, A. J., et al. 2016, ApJ, 819, 135, doi: 10.3847/0004-637X/819/2/135
2016 doi
-
[31]
2016, AJ, 151, 68, doi: 10.3847/0004-6256/151/3/68
Kirk, B., Conroy, K., Prˇ sa, A., et al. 2016, AJ, 151, 68, doi: 10.3847/0004-6256/151/3/68
2016 doi
-
[32]
B., Reddy, B
Kumar, Y. B., Reddy, B. E., Campbell, S. W., et al. 2020, Nature Astronomy, 4, 1059, doi: 10.1038/s41550-020-1139-7
2020 doi
-
[33]
B., Reddy, B
Kumar, Y. B., Reddy, B. E., & Lambert, D. L. 2011, ApJL, 730, L12, doi: 10.1088/2041-8205/730/1/L12 Lightkurve Collaboration, Cardoso, J. V. d. M., Hedges, C., et al. 2018, Lightkurve: Kepler and TESS time series analysis in Python, Astrophysics Source Code Library, record asc...
2011 doi
-
[34]
J., Tan, K
Liu, Y. J., Tan, K. F., Wang, L., et al. 2014, ApJ, 785, 94, doi: 10.1088/0004-637X/785/2/94
2014 doi
-
[35]
Lomb, N. R. 1976, Ap&SS, 39, 447, doi: 10.1007/BF00648343
1976 doi
-
[36]
2021, A&A, 655, A23, doi: 10.1051/0004-6361/202141275 16
Magrini, L., Smiljanic, R., Franciosini, E., et al. 2021, A&A, 655, A23, doi: 10.1051/0004-6361/202141275 16
2021 doi
-
[37]
2012, in Society of Photo-Optical Instrumentation Engineers (SPIE) Conference Series, Vol
Mahadevan, S., Ramsey, L., Bender, C., et al. 2012, in Society of Photo-Optical Instrumentation Engineers (SPIE) Conference Series, Vol. 8446, Ground-based and Airborne Instrumentation for Astronomy IV, 84461S, doi: 10.1117/12.926102
2012 doi
-
[38]
W., Terrien, R., et al
Mahadevan, S., Ramsey, L. W., Terrien, R., et al. 2014, in Society of Photo-Optical Instrumentation Engineers (SPIE) Conference Series, Vol. 9147, Ground-based and Airborne Instrumentation for Astronomy V, 91471G, doi: 10.1117/12.2056417
2014 doi
-
[39]
Mallick, A., Singh, R., & Reddy, B. E. 2023, ApJL, 944, L5, doi: 10.3847/2041-8213/acb5f6
2023 doi
-
[40]
L., Simpson, J
Martell, S. L., Simpson, J. D., Balasubramaniam, A. G., et al. 2021, MNRAS, 505, 5340, doi: 10.1093/mnras/stab1356
2021 doi
-
[41]
Mitler, H. E. 1972, Ap&SS, 17, 186, doi: 10.1007/BF00642551
1972 doi
-
[42]
2014, A&A, 572, L5, doi: 10.1051/0004-6361/201425039
Mosser, B., Benomar, O., Belkacem, K., et al. 2014, A&A, 572, L5, doi: 10.1051/0004-6361/201425039
2014 doi
-
[43]
W., Hartmann, L
Noyes, R. W., Hartmann, L. W., Baliunas, S. L., Duncan, D. K., & Vaughan, A. H. 1984, ApJ, 279, 763, doi: 10.1086/161945
1984 doi
-
[44]
Obrien, George T., J., & Lambert, D. L. 1986, ApJS, 62, 899, doi: 10.1086/191160
1986 doi
-
[45]
H., Charbonnel, C., & Deliyannis, C
Pinsonneault, M. H., Charbonnel, C., & Deliyannis, C. P. 2000, in IAU Symposium, Vol. 198, The Light Elements and their Evolution, ed. L. da Silva, R. de Medeiros, & M. Spite, 74
2000
-
[46]
M., Sneden, C., Roederer, I
Placco, V. M., Sneden, C., Roederer, I. U., et al. 2021, Research Notes of the American Astronomical Society, 5, 92, doi: 10.3847/2515-5172/abf651
2021 doi
-
[47]
W., Sneden, C., & Chadid, M
Preston, G. W., Sneden, C., & Chadid, M. 2022, AJ, 163, 109, doi: 10.3847/1538-3881/ac46ca
2022 doi
-
[48]
2001, A&A, 374, 646, doi: 10.1051/0004-6361:20010751
Romano, D., Matteucci, F., Ventura, P., & D’Antona, F. 2001, A&A, 374, 646, doi: 10.1051/0004-6361:20010751
2001 doi
-
[49]
R., Fulbright, J
Ruchti, G. R., Fulbright, J. P., Wyse, R. F. G., et al. 2011, ApJ, 743, 107, doi: 10.1088/0004-637X/743/2/107
2011 doi
-
[50]
Rutten, R. G. M. 1984, A&A, 130, 353
1984
-
[51]
J., & Boothroyd, A
Sackmann, I. J., & Boothroyd, A. I. 1992, ApJL, 392, L71, doi: 10.1086/186428
1992 doi
-
[52]
Scargle, J. D. 1982, ApJ, 263, 835, doi: 10.1086/160554
1982 doi
-
[53]
Bedding, T. R. 2016, ApJ, 822, 15, doi: 10.3847/0004-637X/822/1/15
2016 doi
-
[54]
E., Pandey, J
Singh, R., Mallick, A., Reddy, B. E., Pandey, J. C., & Zhao, G. 2024, ApJL, 971, L3, doi: 10.3847/2041-8213/ad62f6
2024 doi
-
[55]
E., Bharat Kumar, Y., & Antia, H
Singh, R., Reddy, B. E., Bharat Kumar, Y., & Antia, H. M. 2019, ApJL, 878, L21, doi: 10.3847/2041-8213/ab2599
2019 doi
-
[56]
2021, ApJL, 913, L4, doi: 10.3847/2041-8213/abfa24
Vrard, M. 2021, ApJL, 913, L4, doi: 10.3847/2041-8213/abfa24
2021 doi
-
[57]
H., Dupree, A
Smith, G. H., Dupree, A. K., & Strader, J. 2004, PASP, 116, 819, doi: 10.1086/423988
2004 doi
-
[58]
C., Stumpe, M
Smith, J. C., Stumpe, M. C., Van Cleve, J. E., et al. 2012, PASP, 124, 1000, doi: 10.1086/667697
2012 doi
-
[59]
V., Plez, B., Lambert, D
Smith, V. V., Plez, B., Lambert, D. L., & Lubowich, D. A. 1995, ApJ, 441, 735, doi: 10.1086/175395
1995 doi
-
[60]
2012, SPECTRE: Manipulation of single-order spectra, Astrophysics Source Code Library, record ascl:1202.010
Sneden, C., Uomoto, A., Cottrell, P., & Fitzpatrick, M. 2012, SPECTRE: Manipulation of single-order spectra, Astrophysics Source Code Library, record ascl:1202.010
2012
-
[61]
2021, AJ, 161, 128, doi: 10.3847/1538-3881/abd7ee —
Sneden, C., Af¸ sar, M., Bozkurt, Z., et al. 2021, AJ, 161, 128, doi: 10.3847/1538-3881/abd7ee —. 2022, ApJ, 940, 12, doi: 10.3847/1538-4357/ac922e
2021 doi
-
[62]
Sneden, C. A. 1973, PhD thesis, University of Texas, Austin
1973
-
[63]
Bedding, T. R. 2009, MNRAS, 400, L80, doi: 10.1111/j.1745-3933.2009.00767.x
2009
-
[64]
Susmitha, A., Mallick, A., & Reddy, B. E. 2024, ApJ, 966, 109, doi: 10.3847/1538-4357/ad35b9
2024 doi
-
[65]
2017, PASJ, 69, 74, doi: 10.1093/pasj/psx057
Takeda, Y., & Tajitsu, A. 2017, PASJ, 69, 74, doi: 10.1093/pasj/psx057
2017 doi
-
[66]
2018, ApJL, 858, L7, doi: 10.3847/2041-8213/aabf8e
Ting, Y.-S., Hawkins, K., & Rix, H.-W. 2018, ApJL, 858, L7, doi: 10.3847/2041-8213/aabf8e
2018 doi
-
[68]
1986b, in Society of Photo-Optical Instrumentation Engineers (SPIE) Conference Series, Vol
Tody, D. 1986b, in Society of Photo-Optical Instrumentation Engineers (SPIE) Conference Series, Vol. 627, Instrumentation in astronomy VI, ed. D. L. Crawford, 733, doi: 10.1117/12.968154
-
[69]
2023, A&A, 674, A157, doi: 10.1051/0004-6361/202244374 Van Cleve, J
Tsantaki, M., Delgado-Mena, E., Bossini, D., et al. 2023, A&A, 674, A157, doi: 10.1051/0004-6361/202244374 Van Cleve, J. E., & Caldwell, D. A. 2009, Kepler Instrument Handbook, Kepler Science Document KSCI− 19033 (Moffett
2023 doi
-
[70]
H., Preston, G
Vaughan, A. H., Preston, G. W., & Wilson, O. C. 1978, PASP, 90, 267, doi: 10.1086/130324 17
1978 doi
-
[71]
P., Antia, H
Verma, K., Faria, J. P., Antia, H. M., et al. 2014, ApJ, 790, 138, doi: 10.1088/0004-637X/790/2/138
2014 doi
-
[72]
2016, A&A, 588, A87, doi: 10.1051/0004-6361/201527259
Vrard, M., Mosser, B., & Samadi, R. 2016, A&A, 588, A87, doi: 10.1051/0004-6361/201527259
2016 doi
-
[73]
2003, PASP, 115, 1023, doi: 10.1086/377358
Walker, G., Matthews, J., Kuschnig, R., et al. 2003, PASP, 115, 1023, doi: 10.1086/377358
2003 doi
-
[74]
1982, ApJ, 255, 577, doi: 10.1086/159859
Wallerstein, G., & Sneden, C. 1982, ApJ, 255, 577, doi: 10.1086/159859
1982 doi
-
[75]
1996, ApOpt, 35, 5155, doi: 10.1364/AO.35.005155
Wang, S.-G., Su, D.-Q., Chu, Y.-Q., Cui, X., & Wang, Y.-N. 1996, ApOpt, 35, 5155, doi: 10.1364/AO.35.005155
1996 doi
-
[76]
S., Liu, X
Xiang, M. S., Liu, X. W., Yuan, H. B., et al. 2015, MNRAS, 448, 822, doi: 10.1093/mnras/stu2692
2015 doi
-
[77]
2021, Nature Astronomy, 5, 86, doi: 10.1038/s41550-020-01217-8
Yan, H.-L., Zhou, Y.-T., Zhang, X., et al. 2021, Nature Astronomy, 5, 86, doi: 10.1038/s41550-020-01217-8
2021 doi
-
[78]
S., Li, Y., & Bi, S
Zhang, X., Jeffery, C. S., Li, Y., & Bi, S. 2020, ApJ, 889, 33, doi: 10.3847/1538-4357/ab5e89
2020 doi
Reviewed August 10, 2026 · model on record in the stance chip above.
Discussion (0). Continue with ORCID to comment.