REVIEW 2 major objections 5 minor 121 references
The JCMT Gould Belt Survey: First results from the Corona Australis molecular cloud and evidence of variable dust emissivity indices in the Coronet region
T0 review · 2 major / 5 minor · reviewed 2026-08-10 · deepseek-v4-flash
Pith's one-line read Combining SCUBA-2 450 and 850 micron images with Herschel maps, this paper measures the dust emissivity index across the Coronet and finds a well-constrained low value of $\beta = 1.55 \pm 0.35$ in the starless clump SMM-6, a hint of…
desk verdict Solid Gould Belt survey paper; the SMM-6 beta result is a hint, not a measurement, because single-temperature fits can't exclude line-of-sight temperature mixing. read the letter →
The pith
A machine-rendered reading of the paper's core claim, the machinery that carries it, and where it could break.
The reading
What carries the argument
The load-bearing object is the single-temperature modified blackbody spectral energy distribution $F_\nu = M B_\nu(T_d)\kappa_\nu(\beta)/D^2$, with the dust opacity law $\kappa_\nu = 0.1(\nu/1\,\mathrm{THz})^\beta$ cm$^2$ g$^{-1}$, fit pixel by pixel to data from 160 to 850 $\mu$m. To make the datasets comparable, the Herschel maps are passed through the SCUBA-2 reduction pipeline so that the same spatial filtering and masking are applied to both, and all maps are then convolved to the 36-arcsecond resolution of the 500 $\mu$m band. The addition of the SCUBA-2 850 $\mu$m point is what makes $\beta$ constrainable, because it extends the Rayleigh-Jeans tail longward of 500 $\mu$m and, as the paper notes, improves the $\beta$ constraint by a factor of two relative to Herschel data alone. The SMM-6 result is secured by comparing fits with and without the 850 $\mu$m point and by Monte Carlo simulations of how an injected 850 $\mu$m excess shifts the recovered $\beta$.
What would settle it
Resolved 1.3 mm and 3 mm continuum imaging of SMM-6, fitted with a model that allows two temperature components along the line of sight: if the recovered $\beta$ returns to about 2 once temperature structure is included, the low-$\beta$ claim is an artifact of the single-temperature assumption.
Extended reading notes
Core claim
The paper's central claim is that the dust emissivity index $\beta$ is measurably and spatially variable across the Coronet cluster of Corona Australis, most cleanly in the starless clump SMM-6. Fitting a single-temperature modified blackbody to spatially filtered Herschel 160–500 $\mu$m data plus SCUBA-2 850 $\mu$m data gives $\beta = 1.55 \pm 0.35$ at $T = 15.3 \pm 2.3$ K, and the value is nearly identical when only Herschel data are used ($\beta = 1.53 \pm 0.79$), showing that the result is not driven by CO contamination of the 850 $\mu$m band. A $\beta$ below the canonical 2.0 in a cold, starless clump is the signature expected from large dust grains, because grain emission falls off more shallowly at long wavelengths once grains have grown. The authors stop short of claiming grain growth has occurred: using the coagulation timescale of Chakrabarti and McKee, they estimate that growing micron-sized grains in SMM-6 would take about $10^7$ years, more than 100 times the freefall time, so the clump would have to be unusually long-lived. Elsewhere in the Coronet, near R CrA and SMM-2 and at the IRS 2 protostar, $\beta$ drops to artificially low values driven by the $T$–$\beta$ degeneracy and CO contamination, and IRS 2 shows an unexplained long-wavelength flux excess.
Load-bearing premise
The result stands or falls on the assumption that line-of-sight temperature variation inside SMM-6 is minimal, so that a single-temperature modified blackbody fit recovers the true $\beta$.
Editorial extensions
If this is right
- A $\beta$ of about 1.55 in a starless clump means the canonical $\beta = 2$ assumption is not universally valid, so core masses derived from single-temperature submillimetre fits can be biased wherever dust properties differ.
- The Coronet offers a clean laboratory for dust evolution studies because SMM-6's low-$\beta$ region is spatially separated from the contamination-dominated zones around R CrA and SMM-2, and its value agrees with the Planck-based $\beta$ for the whole Coronet area.
- The IRS 2 protostar's unexplained long-wavelength excess, if due to cold dust rather than shock-driven fitting degeneracy, would mark it as a candidate for particularly early grain growth in an envelope.
- The method of filtering Herschel maps through the SCUBA-2 pipeline and adding the 850 $\mu$m point, which tightens $\beta$ constraints by a factor of two, transfers directly to other Gould Belt clouds observed by the same survey.
Reading between the lines
- If low $\beta$ in starless cores turns out to be common, dust mass estimates across whole clouds would need recalibration, since fixing $\beta = 2$ would systematically overestimate masses wherever large grains have already formed before collapse.
- A direct test of the SMM-6 result is within reach of current instruments: ALMA continuum observations at 1.3 mm and 3 mm would measure $\beta$ at wavelengths free of $^{12}$CO contamination and with enough resolution to expose any warm component hidden along the line of sight.
- The timescale tension the authors identify could be resolved if SMM-6 is magnetically supported or otherwise long-lived; measuring the clump's internal velocity dispersion and magnetic field strength would test whether its lifetime can exceed the freefall time.
Editorial analysis
A structured set of objections, weighed in public.
Referee Report
Summary. This paper presents SCUBA-2 450 and 850 micron observations of the Corona Australis molecular cloud from the JCMT Gould Belt Legacy Survey. The authors extract a catalogue of 39 starless, prestellar, and protostellar cores with getsources, classify them using Spitzer/WISE associations, and derive temperatures and masses using SCUBA-2 flux ratios and Herschel-derived temperature maps. They then perform pixel-by-pixel SED fitting from 160 to 850 microns across the Coronet region, fitting dust temperature, column density, and dust emissivity index with several combinations of data and constraints. The headline result is a relatively low value of beta in the starless clump SMM-6 (beta = 1.55 +/- 0.35 with SCUBA-2 data, or 1.53 +/- 0.79 from Herschel alone), which the authors suggest may indicate the presence of large dust grains, while explicitly cautioning in Section 7 that the grain-growth interpretation is not secure and that line-of-sight temperature variations cannot be ruled out.
Significance. If robust, the SMM-6 measurement would be one of the few well-resolved estimates of a low dust emissivity index in a starless core, with implications for grain growth prior to star formation and for the interpretation of submillimetre continuum surveys. The paper has real strengths: the catalog and derived core properties are a useful dataset; the SCUBA-2 and Herschel maps are carefully brought to a common spatial filtering; contamination by 12CO is assessed with a Monte Carlo model; and the fitted beta values are cross-checked against Planck imaging. However, the headline claim is not yet quantitatively secure. The quoted uncertainty places beta only about 1.3 sigma below the canonical value of 2.0, and the single-temperature modified blackbody model is acknowledged in Section 6.1.3 to be vulnerable to line-of-sight temperature mixing, which can bias beta low in exactly the kind of externally heated, starless clump that SMM-6 is.
major comments (2)
- [Abstract; §6.4] The central result that SMM-6 has a low dust emissivity index is derived by fitting a single-temperature modified blackbody to 160-850 micron data, and this is exactly the assumption most vulnerable to systematic bias. The authors state in Section 6.1.3 that line-of-sight temperature variations cannot be ruled out in CrA, and the Malinen et al. (2011) work they cite finds that such variations can bias beta low by up to 0.5 dex in starless cores. SMM-6 is a starless clump in the vicinity of the B star R CrA, so a warm component along the line of sight could broaden the SED and lower the fitted beta without any change in grain properties. The agreement between the Herschel-only value (beta = 1.53 +/- 0.79) and the Herschel+SCUBA-2 value (beta = 1.55 +/- 0.35) does not remove this concern, because both fits share the same single-temperature model. The Planck comparison in Section 6.5 has a beam of about 5 arcmin and reports a mean over the Coronet rather than a resolved SMM-6 value. I request an explicit test of the temperature-mixing bias, for example two-component modified blackbody fits toward SMM-6 or synthetic SEDs built from a plausible radial temperature gradient, or a revision that withdraws the altered-dust-properties interpretation and presents the measurement only as a tentative result.
- [Abstract; §6.4] The statistical evidence for a low beta in SMM-6 is modest. The quoted value beta = 1.55 +/- 0.35 is only about 1.3 sigma below the canonical beta = 2.0 used for the source temperatures and masses, and it is consistent within errors with the Planck mean over the Coronet (beta = 1.50 +/- 0.03; Section 6.5). The abstract's phrase 'beta varies across the Coronet' and the claim that the low value is 'suggestive of the presence of large dust grains' therefore overstate the current evidence. I recommend reporting a confidence interval or posterior for beta in SMM-6, and ideally a comparison of fits with beta fixed to 2.0 versus beta free, so that the reader can judge whether the data actually exclude a constant beta.
minor comments (5)
- [§6.4] The column densities quoted for SMM-6 are 2.5 x 10^-22 cm^-2 and 2.8 x 10^22 cm^-2; the first value is presumably a typo for 2.5 x 10^22 cm^-2, and the units should be checked throughout the paragraph.
- [§6.1.3] The phrase 'underestimated by up to 0.5 dex' is ambiguous: if 'dex' means a logarithmic factor, the expected bias is much larger than the offsets discussed in Sections 6.1.6 and 6.4, while if a linear offset is intended the word 'dex' should be removed.
- [Table 1] Peak flux densities are given in Jy/arcsec^2 and total flux densities in Jy, but the column headers repeat 'Flux Density' for both; adding explicit units to each column header would reduce ambiguity.
- [Section 7 versus Abstract] The abstract says the low beta is 'suggestive of the presence of large dust grains,' while Section 7 says the authors 'cannot confidently ascribe this to grain growth, since the timescale for grain coagulation is significantly longer than the freefall time'; the abstract should be aligned with the more cautious summary in Section 7.
- [§6.1.4 and §6.4] The RxB CO contamination map is described as having about 20 percent calibration uncertainty, but the quoted CO contamination fraction for SMM-6, 14 +/- 3 percent, does not include this systematic term; it should be added to the reported uncertainty budget.
Circularity Check
No significant circularity: the SMM-6 beta measurement is a fitted observable from Herschel+SCUBA-2 SEDs, cross-checked against independent Planck data, with the grain-growth interpretation explicitly qualified.
full rationale
The paper's central new result, beta = 1.55 ± 0.35 in SMM-6, is a free parameter obtained by fitting the modified blackbody SED (Eq. 7) to 160–850 μm data. This is a measurement, not a prediction derived from an input that already contains the answer: beta is allowed to vary pixel-by-pixel and is not set to the reported value by construction. The authors do not present the fit as a prediction; instead they systematically quantify T–beta degeneracy (Sec. 6.1.2), CO contamination (Sec. 6.1.4), and line-of-sight temperature variations (Sec. 6.1.3), and they explicitly weaken the grain-growth interpretation on timescale grounds (Sec. 7). The Planck comparison (Sec. 6.5) is an external, lower-resolution check, not a restatement of the same fit. Although the paper relies on prior GBLS/HGBS methodology with overlapping authorship (e.g., Sadavoy et al. 2013; Pattle et al. 2015; Bresnahan et al. 2018), those papers provide reduction and extraction procedures rather than the target beta result; the central claim therefore has independent empirical content. The acknowledged possibility that line-of-sight temperature gradients bias beta low is a correctness risk, not a circular derivation.
Assumptions & free parameters
free parameters (3)
- Dust emissivity index beta (fitted) =
1.55 +/- 0.35 in SMM-6; maps over Coronet
- Dust temperature T (fitted) =
15.3 +/- 2.3 K in SMM-6; maps over Coronet
- Mass and column density M (fitted) =
N(H2) ~ 2.8e22 cm^-2 in SMM-6 (fitted)
assumptions (7)
- domain assumption A single-temperature modified blackbody with kappa_nu = 0.1(nu/1THz)^beta describes dust emission from 160 to 850 um.
- domain assumption Line-of-sight temperature variation is minimal and the two wavelengths trace the same dust population.
- ad hoc to paper The RxB 12CO J=3-2 map provides a usable estimate of SCUBA-2 850 um CO contamination.
- domain assumption Passing Herschel maps through the SCUBA-2 pipeline makes them directly comparable to SCUBA-2 data.
- domain assumption The distance to CrA is 130 pc.
- domain assumption Beta is fixed to 2.0 when deriving SCUBA-2 and Herschel temperatures.
- domain assumption Dust mass opacity follows kappa_nu = 0.1(nu/1THz)^beta cm^2/g (Beckwith et al. 1990).
Cite this review
Pith. "Pith review of The JCMT Gould Belt Survey: First results from the Corona Australis molecular cloud and evidence of variable dust emissivity indices in the Coronet region." pith.science (2026). https://pith.science/paper/UXSFRC24
@misc{pith2026250111564,
  author       = {Pith},
  title        = {Pith review of: The JCMT Gould Belt Survey: First results from the Corona Australis molecular cloud and evidence of variable dust emissivity indices in the Coronet region},
  year         = {2026},
  howpublished = {\url{https://pith.science/paper/UXSFRC24}},
  note         = {Machine review of arXiv:2501.11564}
}
abstract
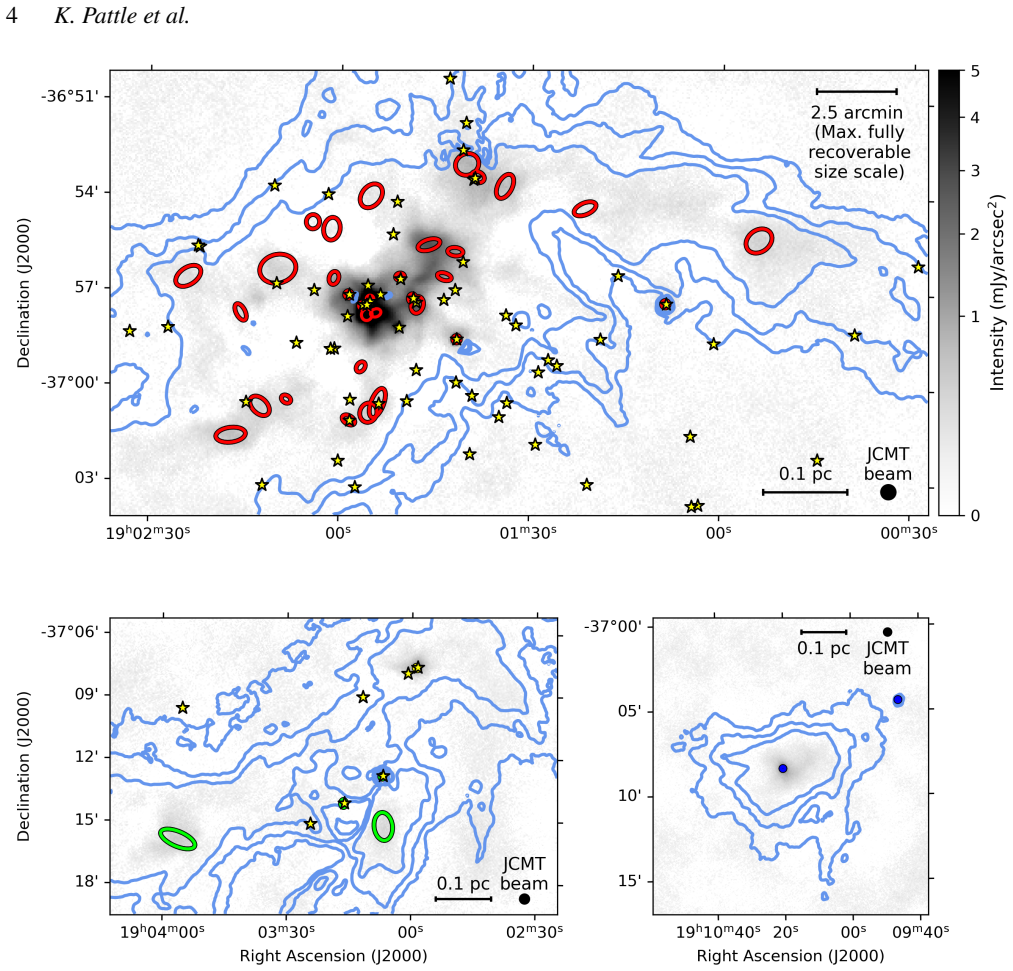
We present 450$\mu$m and 850$\mu$m James Clerk Maxwell Telescope (JCMT) observations of the Corona Australis (CrA) molecular cloud taken as part of the JCMT Gould Belt Legacy Survey (GBLS). We present a catalogue of 39 starless and protostellar sources, for which we determine source temperatures and masses using SCUBA-2 450$\mu$m/850$\mu$m flux density ratios for sources with reliable 450$\mu$m detections, and compare these to values determined using temperatures measured by the Herschel Gould Belt Survey (HGBS). In keeping with previous studies, we find that SCUBA-2 preferentially detects high-volume-density starless cores, which are most likely to be prestellar (gravitationally bound). We do not observe any anti-correlation between temperature and volume density in the starless cores in our sample. Finally, we combine our SCUBA-2 and Herschel data to perform SED fitting from 160-850$\mu$m across the central Coronet region, thereby measuring dust temperature $T$, dust emissivity index $\beta$ and column density $N({\rm H}_2)$ across the Coronet. We find that $\beta$ varies across the Coronet, particularly measuring $\beta = 1.55 \pm 0.35$ in the colder starless SMM-6 clump to the north of the B star R CrA. This relatively low value of $\beta$ is suggestive of the presence of large dust grains in SMM-6, even when considering the effects of $T-\beta$ fitting degeneracy and $^{12}$CO contamination of SCUBA-2 850$\mu$m data on the measured $\beta$ values.
Figures


Figures from the paper (11 more)




Reference graph
Works this paper leans on
-
[1]
ALMA Partnership et al., 2015, , 808, L3
2015
-
[2]
D., et al., 2010, , 518, L99
Anderson L. D., et al., 2010, , 518, L99
2010
-
[3]
Andr \'e P., et al., 2010, @doi [ ] 10.1051/0004-6361/201014666 , 518, L102
-
[4]
Aniano G., Draine B. T., Gordon K. D., Sandstrom K., 2011, @doi [ ] 10.1086/662219 , 123, 1218
doi:10.1086/662219 2011
-
[5]
Appenzeller I., Jankovics I., Jetter R., 1986, A&AS, 64, 65
1986
-
[6]
P., Tollerud, E
Astropy Collaboration, Robitaille, T. P., Tollerud, E. J., et al.\ 2013, , 558, A33
2013
-
[7]
M., Sip o cz, B
Astropy Collaboration, Price-Whelan, A. M., Sip o cz, B. M., et al.\ 2018, , 156, 123
2018
-
[8]
M., Lim, P
Astropy Collaboration, Price-Whelan, A. M., Lim, P. L. et al.\ 2022, , 935, 167
2022
Show all 121 references
- [9]
-
[10]
Beckwith S. V. W., Sargent A. I., Chini R. S., Guesten R., 1990, , 99, 924
1990
-
[11]
Proc SPIE, 9153, p
Bintley D., et al., 2014, in Millimeter, Submillimeter, and Far-Infrared Detectors and Instrumentation for Astronomy VII. Proc SPIE, 9153, p. 915303, @doi 10.1117/12.2055231
2014 doi
-
[12]
B., 1956, , 116, 351
Bonnor W. B., 1956, , 116, 351
1956
-
[13]
doi:10.1051/0004-6361/201731117
Bracco A., Palmeirim P., Andr \'e P., Adam R., Ade P., Bacmann A., Beelen A., et al., 2017, A&A, 604, A52. doi:10.1051/0004-6361/201731117
2017 doi
-
[14]
et al.\ 2020, , 644, A5
Bracco , A., Bresnahan , D., Palmeirim , P. et al.\ 2020, , 644, A5
2020
-
[15]
M., et al., 2018, arXiv:1801.07805
Bresnahan D., Ward-Thompson D., Kirk J. M., et al., 2018, arXiv:1801.07805
2018 arXiv
-
[16]
V., Hills, R
Buckle, J. V., Hills, R. E., Smith, H., et al.\ 2009, , 399, 1026
2009
-
[17]
W., Mathieu R
Casey B. W., Mathieu R. D., Vaz L. P. R., Andersen J., Suntzeff N. B., 1998, @doi [ ] 10.1086/300270 , 115, 1617
1998 doi
-
[18]
E., Caselli P., Bizzocchi L., Gutermuth R
Chac \'o n-Tanarro A., Pineda J. E., Caselli P., Bizzocchi L., Gutermuth R. A., Mason B. S., G \'o mez-Ruiz A. I., et al., 2019, A&A, 623, A118. doi:10.1051/0004-6361/201833385
2019 doi
-
[19]
F., 2005, ApJ, 631, 792
Chakrabarti S., McKee C. F., 2005, ApJ, 631, 792. doi:10.1086/432659
2005 doi
-
[20]
L., Berry D
Chapin E. L., Berry D. S., Gibb A. G., Jenness T., Scott D., Tilanus R. P. J., Economou F., Holland W. S., 2013, @doi [ ] 10.1093/mnras/stt052 , 430, 2545
2013 doi
-
[21]
C.-Y., Di Francesco J., Johnstone D., et al., 2016, , 826, 95
Chen M. C.-Y., Di Francesco J., Johnstone D., et al., 2016, , 826, 95
2016
-
[22]
Chini R., et al., 2003, , 409, 235
2003
-
[23]
Coud \'e , S., Bastien , P., Kirk , H., et al., 2016, , 457, 2139
2016
-
[24]
J., Berry, D
Currie, M. J., Berry, D. S., Jenness, T., et al.\ 2014, Astronomical Data Analysis Software and Systems XXIII, ASP Conference Series, 485, 391
2014
-
[25]
M., et al., 2003, 2MASS All Sky Catalog of point sources
Cutri R. M., et al., 2003, 2MASS All Sky Catalog of point sources
2003
-
[26]
T., et al., 2013, @doi [ ] 10.1093/mnras/stt090 , 430, 2534
Dempsey J. T., et al., 2013, @doi [ ] 10.1093/mnras/stt090 , 430, 2534
2013 doi
-
[27]
J., Leroux H., Depecker C., et al., 2017, A&A, 600, A123
Demyk K., Meny C., Lu X.-H., Papatheodorou G., Toplis M. J., Leroux H., Depecker C., et al., 2017, A&A, 600, A123. doi:10.1051/0004-6361/201629711
2017 doi
-
[28]
doi:10.1051/0004-6361/201730944
Demyk K., Meny C., Leroux H., Depecker C., Brubach J.-B., Roy P., Nayral C., et al., 2017, A&A, 606, A50. doi:10.1051/0004-6361/201730944
2017 doi
-
[29]
P., Petitprez D., et al., 2022, A&A, 666, A192
Demyk K., Gromov V., Meny C., Ysard N., Paradis D., Jones A. P., Petitprez D., et al., 2022, A&A, 666, A192. doi:10.1051/0004-6361/202243815
2022 doi
-
[30]
D \'e sert F.-X., et al., 2008, , 481, 411
2008
-
[31]
Dobashi K., Uehara H., Kandori R., Sakurai T., Kaiden M., Umemoto T., Sato F., 2005, , 57, S1
2005
-
[32]
Drabek E., et al., 2012, , 426, 23
2012
-
[33]
T., & Lee, H
Draine, B. T., & Lee, H. M.\ 1984, , 285, 89
1984
-
[34]
T., & Li, A.\ 2007, , 657, 810
Draine, B. T., & Li, A.\ 2007, , 657, 810
2007
-
[35]
Ebert R., 1955, , 37, 217
1955
-
[36]
G., Falgarone E., 1996, @doi [ ] 10.1086/178009 , 471, 816
Elmegreen B. G., Falgarone E., 1996, @doi [ ] 10.1086/178009 , 471, 816
1996 doi
-
[37]
Esplin , T. L. & Luhman , K. L., 2022, , 163, 64
2022
-
[38]
J., Dunham M
Evans N. J., Dunham M. M., J rgensen J. K., Enoch M. L., Mer \' n B., van Dishoeck E. F., Alcal \'a J. M., et al., 2009, ApJS, 181, 321. doi:10.1088/0067-0049/181/2/321
2009 doi
-
[39]
Forbrich, J., & Preibisch, T.\ 2007, , 475, 959
2007
-
[40]
F., Petrov P
Gahm G. F., Petrov P. P., Tambovsteva L. V., Grinin V. P., Stempels H. C., Walter F. M., 2018, A&A, 614, A117. doi:10.1051/0004-6361/201832891
2018 doi
-
[41]
J., 1992, , 262, 258
de Geus E. J., 1992, , 262, 258
1992
- [42]
-
[43]
O., Corbally C
Gray R. O., Corbally C. J., Garrison R. F., McFadden M. T., Bubar E. J., McGahee C. E., O'Donoghue A. A., Knox E. R., 2006, @doi [ ] 10.1086/504637 , 132, 161
2006 doi
-
[44]
J., et al., 2010, @doi [ ] 10.1051/0004-6361/201014519 , 518, L3
Griffin M. J., et al., 2010, @doi [ ] 10.1051/0004-6361/201014519 , 518, L3
2010 doi
-
[45]
K., Mattila K., Mauersberger R., Booth R
Harju J., Haikala L. K., Mattila K., Mauersberger R., Booth R. S., Nordh H. L., 1993, , 278, 569
1993
-
[46]
Hatchell J., et al., 2013, , 429, L10
2013
- [47]
-
[48]
H., 1960, @doi [ ] 10.1086/190050 , 4, 337
Herbig G. H., 1960, @doi [ ] 10.1086/190050 , 4, 337
1960 doi
-
[49]
H., 1983, , 24, 267
Hildebrand R. H., 1983, , 24, 267
1983
-
[50]
S., et al., 1999, , 303, 659
Holland W. S., et al., 1999, , 303, 659
1999
-
[51]
S., et al., 2013, @doi [ ] 10.1093/mnras/sts612 , 430, 2513
Holland W. S., et al., 2013, @doi [ ] 10.1093/mnras/sts612 , 430, 2513
2013 doi
-
[52]
et al., 2015, , 580, A49
Inutsuka , S.-i., Inoue, T., Iwasaki , K. et al., 2015, , 580, A49
2015
-
[53]
P., K \"o hler M., Ysard N., Bocchio M., Verstraete L., 2017, A&A, 602, A46
Jones A. P., K \"o hler M., Ysard N., Bocchio M., Verstraete L., 2017, A&A, 602, A46. doi:10.1051/0004-6361/201630225
2017 doi
-
[54]
H., 1945, @doi [ ] 10.1086/144749 , 102, 168
Joy A. H., 1945, @doi [ ] 10.1086/144749 , 102, 168
1945 doi
-
[55]
J., Meny C., et al., 2015, A&A, 584, A94
Juvela M., Demyk K., Doi Y., Hughes A., Lef \`e vre C., Marshall D. J., Meny C., et al., 2015, A&A, 584, A94. doi:10.1051/0004-6361/201425269
2015 doi
-
[56]
Kirk , H., Hatchell , J., Johnstone , D., et al., 2018, , 238, 8
2018
-
[57]
M., et al., 2013, @doi [ ] 10.1093/mnras/stt561 , 432, 1424
Kirk J. M., et al., 2013, @doi [ ] 10.1093/mnras/stt561 , 432, 1424
2013 doi
- [58]
-
[60]
o hler R., Neuh \
K \"o hler R., Neuh \"a user R., Kr \"a mer S., Leinert C., Ott T., Eckart A., 2008, , 488, 997
2008
-
[61]
K \"o nyves V., et al., 2010, @doi [ ] 10.1051/0004-6361/201014689 , 518, L106
2010 doi
-
[62]
K \"o nyves V., et al., 2015, @doi [ ] 10.1051/0004-6361/201525861 , 584, A91
2015 doi
-
[63]
E., J rgensen J
Lindberg J. E., J rgensen J. K., 2012, , 548, A24
2012
-
[64]
Mairs, S., Johnstone, D., Kirk, H., et al.\ 2015, , 454, 2557
2015
-
[65]
S., Broekhoven-Fiene H., Currie M
Mairs S., Johnstone D., Kirk H., Buckle J., Berry D. S., Broekhoven-Fiene H., Currie M. J., et al., 2016, MNRAS, 461, 4022. doi:10.1093/mnras/stw1550
2016 doi
-
[66]
T., Bell G
Mairs S., Dempsey J. T., Bell G. S., Parsons H., Currie M. J., Friberg P., Jiang X.-J., et al., 2021, AJ, 162, 191. doi:10.3847/1538-3881/ac18bf
2021 doi
-
[67]
C., Lunttila T., Padoan P., 2011, A&A, 530, A101
Malinen J., Juvela M., Collins D. C., Lunttila T., Padoan P., 2011, A&A, 530, A101. doi:10.1051/0004-6361/201015767
2011 doi
- [68]
-
[69]
A., et al., 2016, @doi [ ] 10.1093/mnras/stw301 , 459, 342
Marsh K. A., et al., 2016, @doi [ ] 10.1093/mnras/stw301 , 459, 342
2016 doi
-
[70]
G., Roy, A., Bontemps, S., et al.\ 2012, , 751, 28
Martin, P. G., Roy, A., Bontemps, S., et al.\ 2012, , 751, 28
2012
-
[71]
V., Magnus McGehee P., Kun M., 2015, IAU General Assembly, 22, 2256704
Marton G., Zahorecz S., Toth L. V., Magnus McGehee P., Kun M., 2015, IAU General Assembly, 22, 2256704
2015
-
[72]
Maschberger T., Kroupa P., 2009, , 395, 931
2009
-
[73]
M., NED Team 2007, in Shaw R
Mazzarella J. M., NED Team 2007, in Shaw R. A., Hill F., Bell D. J., eds, Astronomical Society of the Pacific Conference Series Vol. 376, Astronomical Data Analysis Software and Systems XVI. p. 153
2007
-
[74]
Men'shchikov A., Andr \'e P., Didelon P., Motte F., Hennemann M., Schneider N., 2012, @doi [ ] 10.1051/0004-6361/201218797 , 542, A81
2012 doi
-
[75]
Miville-Desch \^e nes M.-A., Lagache G., 2005, @doi [ ] 10.1086/427938 , 157, 302
2005 doi
-
[76]
M., Liu S., 2011, @doi [ ] 10.1051/0004-6361/201014752 , 530, A133
Molinari S., Schisano E., Faustini F., Pestalozzi M., di Giorgio A. M., Liu S., 2011, @doi [ ] 10.1051/0004-6361/201014752 , 530, A133
2011 doi
-
[77]
Motte F., Andr \'e P., Ward-Thompson D., Bontemps S., 2001, @doi [ ] 10.1051/0004-6361:20010543 , 372, L41
2001 doi
-
[78]
Neuh \"a user R., et al., 2000, @doi [ ] 10.1051/aas:2000272 , 146, 323
2000 doi
-
[79]
J., Ward-Thompson D., Andr \'e P., 2005, @doi [ ] 10.1111/j.1365-2966.2005.08711.x , 357, 975
Nutter D. J., Ward-Thompson D., Andr \'e P., 2005, @doi [ ] 10.1111/j.1365-2966.2005.08711.x , 357, 975
2005
-
[80]
Ossenkopf V., Henning T., 1994, , 291, 943
1994
-
[81]
N., Accomazzi A., Mink D
Ott S., 2011, in Evans I. N., Accomazzi A., Mink D. J., Rots A. H., eds, Astronomical Society of the Pacific Conference Series Vol. 442, Astronomical Data Analysis Software and Systems XX. p. 347
2011
-
[82]
T., Thomas, H
Parsons, H., Dempsey, J. T., Thomas, H. S., et al.\ 2018, , 234, 22
2018
-
[83]
Pattle K., et al., 2015, , 450, 1094
2015
-
[84]
Pattle K., et al., 2017, , 464, 4255
2017
-
[85]
E., et al., 2011, @doi [ ] 10.1088/0067-0049/194/2/43 , 194, 43
Peterson D. E., et al., 2011, @doi [ ] 10.1088/0067-0049/194/2/43 , 194, 43
2011 doi
-
[86]
L., et al., 2010, @doi [ ] 10.1051/0004-6361/201014759 , 518, L1
Pilbratt G. L., et al., 2010, @doi [ ] 10.1051/0004-6361/201014759 , 518, L1
2010 doi
-
[87]
E., Arzoumanian , D., Andr\'e , P
Pineda , J. E., Arzoumanian , D., Andr\'e , P. et al., 2023, in Inutsuka , S., Aikawa , Y., Muto , T., Tomida , K. & Tamura , M., eds., Astronomical Society of the Pacific Conference Series Vol. 534, p. 233
2023
-
[88]
Planck Collaboration, Abergel A., Ade P. A. R., Aghanim N., Arnaud M., Ashdown M., Aumont J., et al., 2011, A&A, 536, A25. doi:10.1051/0004-6361/201116483
2011 doi
-
[89]
Planck Collaboration, Abergel, A., Ade, P. A. R., et al.\ 2014, , 571, A11
2014
-
[90]
Poglitsch A., et al., 2010, @doi [ ] 10.1051/0004-6361/201014535 , 518, L2
2010 doi
-
[91]
Posch , L., Miret-Roig , N., Alves , J. et al. , 2023, , 679, L10
2023
-
[92]
H., 1916, , 76, 645
Reynolds J. H., 1916, , 76, 645
1916
-
[93]
Rumble, D., Hatchell, J., Pattle, K., et al.\ 2016, , 460, 4150
2016
-
[94]
I., et al., 2010, , 710, 1247
Sadavoy S. I., et al., 2010, , 710, 1247
2010
-
[95]
I., et al., 2013, , 767, 126
Sadavoy S. I., et al., 2013, , 767, 126
2013
-
[96]
I., Stutz A
Sadavoy S. I., Stutz A. M., Schnee S., Mason B. S., Di Francesco J., Friesen R. K., 2016, , 588, A30
2016
-
[97]
J., et al., 2015, , 449, 1782
Salji C. J., et al., 2015, , 449, 1782
2015
-
[98]
Sandell , G., Reipurth , B., Vacca , W. D. et al., 2021, , 920, 7
2021
-
[99]
Schnee S., Mason B., Di Francesco J., Friesen R., Li D., Sadavoy S., Stanke T., 2014, , 444, 2303
2014
-
[100]
A., Ercolano B., 2009, @doi [ ] 10.1088/0004-637X/696/2/2234 , 696, 2234
Shetty R., Kauffmann J., Schnee S., Goodman A. A., Ercolano B., 2009, @doi [ ] 10.1088/0004-637X/696/2/2234 , 696, 2234
2009 doi
-
[101]
A.\ 2009, , 696, 676
Shetty, R., Kauffmann, J., Schnee, S., & Goodman, A. A.\ 2009, , 696, 676
2009
-
[102]
J., 2013, @doi [ ] 10.1051/0004-6361/201220170 , 551, A34
Sicilia-Aguilar A., Henning T., Linz H., Andr \'e P., Stutz A., Eiroa C., White G. J., 2013, @doi [ ] 10.1051/0004-6361/201220170 , 551, A34
2013 doi
-
[103]
V., Testi L., Gong M., Caselli P., 2022, ApJ, 940, 188
Silsbee K., Akimkin V., Ivlev A. V., Testi L., Gong M., Caselli P., 2022, ApJ, 940, 188. doi:10.3847/1538-4357/ac978b
2022 doi
-
[104]
J., Johnstone, D., Nutter, D., Ward-Thompson, D., & Whitworth, A
Simpson, R. J., Johnstone, D., Nutter, D., Ward-Thompson, D., & Whitworth, A. P.\ 2011, , 417, 216
2011
-
[105]
Staguhn J., et al., 2008, Journal of Low Temperature Physics, 151, 709
2008
-
[106]
D., Wilson G
Tang Y., Wang Q. D., Wilson G. W., 2021, MNRAS, 505, 2377. doi:10.1093/mnras/staa3230
2021 doi
-
[107]
Taylor K. N. R., Storey J. W. V., 1984, , 209, 5P
1984
-
[108]
doi:10.2458/azu\_uapress\_9780816531240-ch015
Testi L., Birnstiel T., Ricci L., Andrews S., Blum J., Carpenter J., Dominik C., et al., 2014, prpl.conf, 339. doi:10.2458/azu\_uapress\_9780816531240-ch015
2014 doi
-
[109]
T., Wright C
Ubach C., Maddison S. T., Wright C. M., Wilner D. J., Lommen D. J. P., Koribalski B., 2012, @doi [ ] 10.1111/j.1365-2966.2012.21603.x , 425, 3137
2012
-
[110]
F., Scarrott S
Ward-Thompson D., Warren-Smith R. F., Scarrott S. M., Wolstencroft R. D., 1985, , 215, 537
1985
-
[111]
M., 2002, , 329, 257
Ward-Thompson D., Andr \'e P., Kirk J. M., 2002, , 329, 257
2002
-
[112]
Ward-Thompson D., et al., 2007, @doi [ ] 10.1086/521277 , 119, 855
2007 doi
-
[113]
Ward-Thompson D., et al., 2016, , 463, 1008
2016
-
[114]
A., Harvey P
Wilking B. A., Harvey P. M., Joy M., Hyland A. R., Jones T. J., 1985, @doi [ ] 10.1086/163223 , 293, 165
1985 doi
-
[115]
A., Taylor K
Wilking B. A., Taylor K. N. R., Storey J. W. V., 1986, @doi [ ] 10.1086/114140 , 92, 103
1986 doi
-
[116]
A., Greene T
Wilking B. A., Greene T. P., Lada C. J., Meyer M. R., Young E. T., 1992, @doi [ ] 10.1086/171808 , 397, 520
1992 doi
-
[117]
doi:10.1051/0004-6361/201118420
Ysard N., Juvela M., Demyk K., Guillet V., Abergel A., Bernard J.-P., Malinen J., et al., 2012, A&A, 542, A21. doi:10.1051/0004-6361/201118420
2012 doi
-
[118]
P., Demyk K., Bout \'e raon T., Koehler M., 2018, A&A, 617, A124
Ysard N., Jones A. P., Demyk K., Bout \'e raon T., Koehler M., 2018, A&A, 617, A124. doi:10.1051/0004-6361/201833386
2018 doi
-
[119]
P., Verstraete L., 2019, A&A, 631, A88
Ysard N., Koehler M., Jimenez-Serra I., Jones A. P., Verstraete L., 2019, A&A, 631, A88. doi:10.1051/0004-6361/201936089
2019 doi
-
[120]
P., Guillet V., Demyk K., Decleir M., Verstraete L., Choubani I., et al., 2024, A&A, 684, A34
Ysard N., Jones A. P., Guillet V., Demyk K., Decleir M., Verstraete L., Choubani I., et al., 2024, A&A, 684, A34. doi:10.1051/0004-6361/202348391
2024 doi
-
[121]
S., Schlafly , E
Zucker , C., Speagle , J. S., Schlafly , E. F. et al., 2019, , 879, 125
2019
-
[122]
write newline
" write newline "" before.all 'output.state := FUNCTION fin.entry write newline FUNCTION new.block output.state before.all = 'skip after.block 'output.state := if FUNCTION new.sentence output.state after.block = 'skip output.state before.all = 'skip after.sentence 'output.stat...
Reviewed August 10, 2026 · model on record in the stance chip above.
Discussion (0). Continue with ORCID to comment.