REVIEW 6 major objections 7 minor 1 cited by
A Synthetic Population of Ultra-Luminous X-ray Sources: Optical-X-ray Correlation
T0 review · 6 major / 7 minor · reviewed 2026-08-10 · deepseek-v4-flash
Pith's one-line read The paper simulates a population of ultra-luminous X-ray sources and reproduces the observed anti-correlation between their X-ray and UV brightness, with a slope that depends on metallicity and compact-object type.
desk verdict Useful, honest population-synthesis paper, but the main 'prediction' — the alpha_ox-L_UV anti-correlation — is hardwired into the SCAD model, so the real news is in the metallicity and donor-type trends, which are plausible and worth taking seriously. read the letter →
The pith
A machine-rendered reading of the paper's core claim, the machinery that carries it, and where it could break.
The reading
What carries the argument
The argument is carried by the SCAD (supercritical accretion disk) spectral model of Vinokurov et al. (2013), in which the disk is thick and drives a wind funnel inside the spherization radius with $T(r) \propto r^{-1/2}$ and stays thin outside it; the model leaves two free parameters, the thermalization fraction $f_{\rm out}$ and the funnel angle $\theta_f$. Its load-bearing property is the separation of bands: the 2 keV X-ray luminosity is fixed by the inner disk for a given compact-object mass and is independent of $\dot m$, while the UV luminosity from the funnel and wind scales with $\dot m$, and that separation generates the $\alpha_{\rm ox}$–$L_{\rm UV}$ anti-correlation. Around this core, the binary population comes from the COSMIC synthesis code (Kroupa IMF, Sana et al. initial distributions, rapid-supernova remnant masses), and beaming is implemented with the King (2009) factor $b = 73/\dot m^2$ for $\dot m > 8.7$, which funnels emission into narrower cones at high accretion rates and flattens the population-level slopes.
What would settle it
Measure $\alpha_{\rm ox}$ and the 2500 Å luminosity for ULX samples binned by host-galaxy metallicity across $0.005$ to $1.5\,Z_\odot$. The model predicts black-hole ULX slopes that run from about $-0.24$ at low metallicity to about $-0.21$ at high metallicity, neutron-star ULX slopes fixed near $-0.33$, and much flatter slopes for strongly beamed systems; a metallicity-binned sample whose black-hole slope shows no trend, or in which non-pulsating ULXs are systematically flatter than $-0.2$, would rule out the SCAD-based picture.
Extended reading notes
Core claim
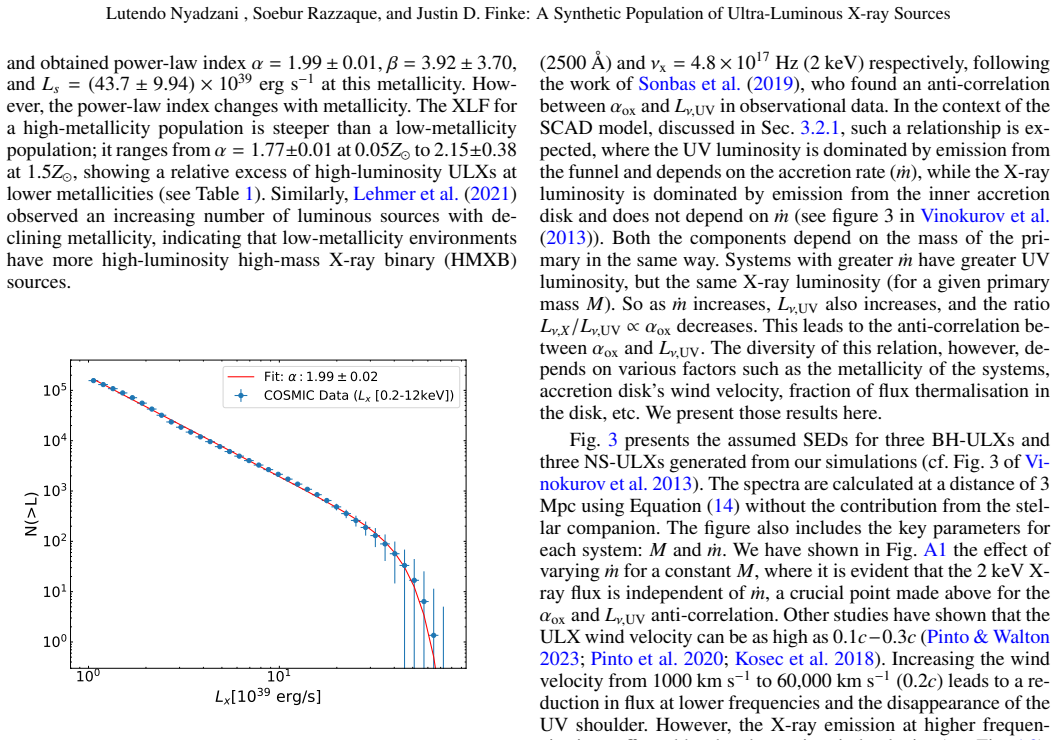
The central claim is that the SCAD model — a supercritical accretion disk that thickens and drives a wind funnel, with temperature profile $T(r) \propto r^{-1/2}$ inside the spherization radius — combined with a binary population synthesized with the COSMIC code, produces a significant anti-correlation between $\alpha_{\rm ox}$ and the 2500 Å UV luminosity that is consistent with the observed relation. The reason is structural: the 2 keV X-ray flux is emitted by the inner disk and does not depend on the accretion-rate ratio $\dot m$, whereas the UV flux from the funnel region increases with $\dot m$, so higher-accretion systems move to higher $L_{\rm UV}$ at unchanged $L_{\rm X}$ and $\alpha_{\rm ox}$ falls. The paper reports BH-ULX slopes that vary with metallicity (from about $-0.24$ at $0.005\,Z_\odot$ to about $-0.21$ at $1.5\,Z_\odot$ in the reference configuration), NS-ULX slopes pinned near $-0.33$ at all metallicities, a decline in the number of ULXs with increasing metallicity with index $0.16 \pm 0.01$, a disk-dominated UV fraction that rises from 77% to 93% with metallicity, and a beaming-induced flattening of both the X-ray luminosity function and the $\alpha_{\rm ox}$ slope.
Load-bearing premise
The load-bearing premise is that every simulated ULX can be described by one shared thermalization fraction $f_{\rm out} = 0.03$ and a fixed funnel angle $\theta_f = 45^\circ$; the paper's own parameter tests show that raising $f_{\rm out}$ to $0.2$ shifts the $\alpha_{\rm ox}$ relation toward the observed values and that beaming flattens the slopes substantially, so if real systems spread widely in these parameters, the claimed match and the quoted slopes would change.
Editorial extensions
If this is right
- The observed $\alpha_{\rm ox}$–$L_{\rm UV}$ anti-correlation does not require intermediate-mass black holes; super-Eddington accretion onto stellar-mass black holes and neutron stars produces it naturally.
- The slope of the relation is a diagnostic of the accretor: neutron-star ULXs stay near $-0.33$ at all metallicities, while black-hole ULXs shift with metallicity, so a metallicity-binned sample can be separated into black-hole and neutron-star contributions.
- The number of ULXs declines with increasing metallicity, with a combined power-law index of $0.16 \pm 0.01$ and a steeper black-hole decline of $0.21 \pm 0.02$, so metal-poor galaxies should host more ULXs per unit star formation.
- UV emission in the synthetic population is predominantly disk-dominated, with the disk-dominated fraction rising from 77% at the lowest metallicity to 93% at the highest, and the companion-dominated minority tracing a steeper, more metallicity-sensitive relation.
- Beaming flattens the X-ray luminosity function (slope about 1.50 versus 1.99 at 40% solar metallicity) and the $\alpha_{\rm ox}$ slope, so strongly beamed sub-populations should appear nearly independent of metallicity.
Reading between the lines
- If the predicted slope–metallicity ladder is real, future X-ray-selected ULX samples with UV counterparts can use it as a distance-free population diagnostic: a bimodal slope would reveal mixed black-hole/neutron-star content, and the presence or absence of the metallicity trend would discriminate beamed from unbeamed source populations.
- The conspicuously stable neutron-star slope near $-0.33$ may be a fingerprint of the SCAD temperature profile itself rather than of neutron-star physics; testing whether the same slope emerges from a thin-disk-only wind model would clarify what the index actually measures.
- The paper's fixed $f_{\rm out} = 0.03$ carries a selection-side prediction: because a low thermalization fraction pushes the 2500 Å band off the flat part of the SED, deeper UV surveys should uncover a population of lower-$L_{\rm UV}$ ULXs that current samples under-represent.
- A natural extension is to fold survey detection thresholds into the viewing-angle-corrected observable population, since the paper notes its selection-probability calculation stops short of detector selection effects and its computed selection probability is flat over most of the luminosity range where ULXs live.
Editorial analysis
A structured set of objections, weighed in public.
Referee Report
Summary. The paper uses the COSMIC binary population synthesis code together with the supercritical accretion disk (SCAD) model of Vinokurov et al. (2013) to construct synthetic ULX populations for metallicities from 0.005 to 1.5 Z_sun. For each simulated BH-ULX and NS-ULX, the authors compute the 2500 A UV luminosity and the 2 keV X-ray luminosity, form the spectral index alpha_ox, and fit the alpha_ox-L_UV relation. They report a significant anti-correlation, a metallicity-dependent slope for BH-ULXs, a roughly constant slope near -0.33 for NS-ULXs, a declining number of ULXs with metallicity, and a metallicity-dependent XLF. They also explore the effect of beaming, finding flatter alpha_ox slopes and flatter XLFs when the funnel angle is tied to the accretion rate through the King (2009) beaming factor. The central claim is that the simulated alpha_ox-L_UV anti-correlation is consistent with the observed Sonbas et al. (2019) relation.
Significance. If the quantitative comparison with Sonbas et al. (2019) were robust, the paper would show that a stellar-mass BH/NS supercritical-accretion framework can reproduce the observed optical-X-ray correlation and would make concrete predictions for its metallicity, donor-type, and beaming dependence. The population synthesis is substantial (2e6 binaries, broad metallicity grid), and the paper is transparent about several model limitations, including the neglect of NS magnetic fields and donor irradiation. However, the central anti-correlation is built into the SCAD model's functional form, and the slope comparison is sensitive to the choice of fout and to the L_UV range used in the fit. The paper therefore demonstrates a model consistency rather than an emergent prediction, and the claimed agreement with observations is not yet established at the quantitative level.
major comments (6)
- [§4.2.2, abstract] The anti-correlation between alpha_ox and L_UV is an input to the SCAD model, not an emergent prediction of the population synthesis. Section 4.2.2 states that "In the context of the SCAD model, such a relationship is expected... Systems with greater mdot have greater UV luminosity, but the same X-ray luminosity... This leads to the anti-correlation." Because the adopted model equations guarantee the sign of the relation, the abstract's claim that the paper "predicts a significant anti-correlation... consistent with observations" overstates the case. The paper should reframe this as a consistency check and identify the slope of the relation, not its existence, as the testable output.
- [§4.2.2, Figs. 4 and 5] The slope comparison with Sonbas et al. (2019) is not quantitatively valid as presented because the simulated slopes are linear fits over the full simulated L_UV distribution, whereas the observed sample occupies a narrower L_UV range. The paper itself notes that the simulated population includes systems with higher UV luminosity not present in the observational data and that most simulated NS-ULXs sit at lower L_UV than the observed points. For a relation that is curved or mass-dependent in normalization, the global slope over the full simulated range can differ substantially from the local slope over the observed window. The paper does not report restricted-window fits, so the claimed consistency with the observed slope (-0.311 +/- 0.061) is not established even for the fiducial fout=0.03, theta_f=45 deg case.
- [§4.3, Fig. A5 and Table 2] The slope is sensitive to the adopted thermalization fraction fout. The fiducial value fout=0.03 yields combined slopes around -0.21 to -0.25, while the paper states that fout=0.2 brings the slope closer to the Sonbas et al. (2019) value and makes the observed systems compatible with both NS- and BH-ULXs. The choice fout=0.03 is an average from five ULXs in Vinokurov et al. (2013), but the paper does not propagate the range of fout values or the resulting systematic uncertainty into the reported slopes. Quoting only the least-squares standard errors (typically +/-0.001) understates the parameter dependence that the paper itself demonstrates. A systematic error budget for fout (and theta_f) is needed before the claimed agreement with observations can be assessed.
- [§4.2.2, Table 2] The statement that "For BH-ULXs, the slope becomes less negative as metallicity increases" is contradicted by the paper's own Table 2. The BH-ULX slopes are -0.242 (0.5% Z_sun), -0.234 (2.5%), -0.225 (10%), -0.201 (20%), -0.210 (30%), -0.217 (40%), -0.221 (50%), -0.213 (100%), and -0.209 (150%). The relation is non-monotonic, with the slope becoming more negative between 20% and 50% Z_sun. This claim appears in the abstract and in the summary as well and needs to be corrected or qualified, since the metallicity dependence of the slope is one of the paper's headline results.
- [§4.3.1, Eq. (22)] The identification of the SCAD model's funnel angle theta_f with the King (2009) beaming angle via theta_f = cos^(-1)(1-b) is not justified. In the SCAD model, theta_f enters the temperature profile in Eq. (11) as a geometric parameter of the wind funnel, while in King (2009) b is a solid-angle beaming factor for super-Eddington accretion. Equating the two without derivation risks double-counting or misestimating the geometric collimation, and this identification directly affects the beamed XLF slopes in Table 4 and the beamed alpha_ox slopes in Table 5. The authors should either derive this correspondence, test its sensitivity, or clearly state that the beaming results depend on this assumed identification.
- [Tables 2 and 3, Figs. 4 and 5] The reported uncertainties on the alpha_ox slopes are fit standard errors only, but the scatter in Figures 4 and 5 is large, with alpha_ox spanning roughly two to three units at fixed L_UV. The +/-0.001 uncertainties on the simulated slopes therefore do not reflect the intrinsic dispersion of the relation, and the comparison with the observed slope, whose uncertainty is +/-0.061, is statistically incompletely characterized. The paper should report the intrinsic scatter, the goodness of fit (e.g., R^2 or residual scatter), and ideally perform a robust regression or bootstrap to assess whether the reported slope differences between BH- and NS-ULXs and between metallicities are significant given the dispersion.
minor comments (7)
- [Fig. 7, Fig. 11] The top panels in Figures 7 and 11 are labeled "0.25Z_sun" in the captions and in the text, but the corresponding panels in Figure 4 and Appendix A5 use 0.025Z_sun; the metallicity values should be made consistent.
- [§4.1] The paper calls the theta_f=45 deg configuration "non-beamed," but a 45 deg funnel opening angle corresponds to a solid-angle fraction of roughly 1-cos(45 deg) ~ 0.29, so there is already substantial geometric collimation. The terminology should be clarified to avoid implying that this is an isotropic reference case.
- [Eq. (9)] The beaming factor formula b = 73/mdot^2 should specify that mdot is in Eddington units and should state the derivation or reference for the threshold mdot > 8.7, so that the reader can connect it to the definitions in Eq. (1).
- [§3.2.1] The text says the model leaves "only fout and theta_f as free parameters," but the wind velocity vw is also a free parameter and is later varied in Appendix A (Fig. A2 and Fig. A4). The sentence should list vw as a third free parameter or explain why it is treated as fixed.
- [§4.2.2, Table 2] The NS-ULX slopes in Table 2 are not strictly constant: they range from -0.317 to -0.338 across metallicity. The abstract and Section 4.2.2 say the slope is "relatively consistent" and "around -0.33," which is acceptable, but the text should acknowledge the small systematic variation rather than implying exact constancy.
- [Table 4 caption] There is a typo in the Table 4 caption: "fit parameters whit beaming included" should read "with beaming included."
- [References] Pinto & Walton (2023) is cited as an arXiv e-print; if a refereed version now exists, it should be cited instead.
Circularity Check
No significant circularity: the αox–LUV anti-correlation is an explicit consequence of the adopted SCAD model, and the reported slopes are emergent population fits compared with an external observed benchmark.
full rationale
The paper's central relation, the αox–Lν,UV anti-correlation, is derived transparently from the SCAD disk model: Section 4.2.2 states that UV luminosity depends on accretion rate while X-ray luminosity does not, so the anti-correlation is an expected consequence of the adopted model equations rather than a hidden fit. The slopes in Table 2 are fits to the simulated population, not to the Sonbas et al. (2019) data, and the comparison with that observed slope is an external benchmark. The free parameter fout = 0.03 is adopted from the average of the external Vinokurov et al. (2013) SED fits, not from the Sonbas sample, and the paper explicitly explores the effect of varying fout rather than tuning it to the αox relation. The only self-citations (Finke & Böttcher 2007; Finke & Razzaque 2017) appear in the introduction as contextual references and are not load-bearing for any derived result. The reviewer's concern that the simulated and observed slopes are fit over different Lν,UV ranges is a legitimate statistical and correctness issue, but it is not a circularity, because no observed slope or data point is used as an input to the model. The derivation is therefore self-contained with respect to the external comparison data.
Assumptions & free parameters
free parameters (3)
- fout =
0.03 (varied 0.002 to 0.2)
- theta_f =
45 degrees (non-beamed case)
- wind velocity vw =
1000 km/s (0.2c explored)
assumptions (6)
- domain assumption Super-Eddington accretion onto stellar-mass BHs and NSs can reach rates up to 1000 times Eddington.
- domain assumption The SCAD model describes the SED of supercritical accretion disks, with X-ray flux independent of mdot and UV flux growing with mdot.
- domain assumption The SCAD model applies to NS-ULXs even though it was developed for BH-ULXs.
- domain assumption The initial binary distributions (Kroupa IMF, Sana 2013 orbital period, eccentricity, and mass ratio) and COSMIC prescriptions represent ULX progenitors.
- ad hoc to paper A single thermalization fraction fout=0.03 and fixed funnel angle theta_f=45 degrees apply to all systems in the non-beamed analysis.
- domain assumption King (2009) beaming factor b=73/mdot^2 describes the geometric collimation of supercritical accretion.
Cite this review
Pith. "Pith review of A Synthetic Population of Ultra-Luminous X-ray Sources: Optical-X-ray Correlation." pith.science (2026). https://pith.science/paper/TKX5E5GU
@misc{pith2026250112712,
  author       = {Pith},
  title        = {Pith review of: A Synthetic Population of Ultra-Luminous X-ray Sources: Optical-X-ray Correlation},
  year         = {2026},
  howpublished = {\url{https://pith.science/paper/TKX5E5GU}},
  note         = {Machine review of arXiv:2501.12712}
}
abstract
This paper presents an analysis of the predicted optical-to-X-ray spectral index ($\alpha_{\rm ox}$) within the context of ultra-luminous X-ray sources (ULXs) associated with stellar mass black holes and neutron stars. We use the population synthesis code COSMIC to simulate the evolution of binary systems and investigate the relationship between UV and X-ray emission during the ULX phase, namely the $\alpha_{\rm ox}$ relation. The study investigates the impact of metallicity on $\alpha_{\rm ox}$ values. Notably, it predicts a significant anti-correlation between $\alpha_{\rm ox}$ and UV luminosity ($L_{\rm UV}$), consistent with observations, with the slope of this relationship varying with metallicity for BH-ULXs. The NS-ULX population shows a relatively consistent slope around $-0.33$ across metallicities, with minor variations. The number of ULXs decreases with increasing metallicity, consistent with observational data, and the X-ray luminosity function shows a slight variation in its slope with metallicity, exhibiting a relative excess of high-luminosity ULXs at lower metallicities. Inclusion of beaming effect in the analysis shows a significant impact on the XLF and $\alpha_{\rm ox}$, particularly at high accretion rates, where the emission is focused into narrower cones. Furthermore, the study finds that UV emission in ULXs is predominantly disk-dominated, which is the likely origin of the $\alpha_{\rm ox}$ relation, with the percentage of disk-dominated ULXs increasing as metallicity rises.
Figures


Figures from the paper (8 more)


Forward citations
Cited by 1 Pith paper
-
Comprehensive X-ray Study of Giant Radio Galaxies with XMM-Newton and Chandra
A systematic X-ray spectral analysis of 27 giant radio galaxies finds ~44% absorbed nuclei, Fe Kα lines, and hard photon indices, with tentative links to black hole mass.
Reference graph
Works this paper leans on
- [1]
-
[2]
Bachetti, M., Heida, M., Maccarone, T., et al. 2022, ApJ, 937, 125
work page 2022
-
[3]
Begelman, M. C. 2001, ApJ, 551, 897
work page 2001
-
[4]
A., et al
Belczynski, K., Kalogera, V ., Rasio, F. A., et al. 2008, ApJS, 174, 223
2008
-
[5]
Belczynski, K., Taam, R. E., Kalogera, V ., Rasio, F. A., & Bulik, T. 2007, ApJ, 662, 504
work page 2007
-
[6]
2020, ApJ, 898, 71
Breivik, K., Coughlin, S., Zevin, M., et al. 2020, ApJ, 898, 71
2020
- [7]
-
[8]
Colbert, E. J. M. & Mushotzky, R. F. 1999, ApJ, 519, 89
work page 1999
Show all 60 references
-
[9]
1989, ARA&A, 27, 87
Fabbiano, G. 1989, ARA&A, 27, 87
1989
-
[10]
Finke, J. D. & Böttcher, M. 2007, ApJ, 667, 395
2007
-
[11]
Finke, J. D. & Razzaque, S. 2017, MNRAS, 472, 3683
2017
-
[12]
J., Bavera, S
Fragos, T., Andrews, J. J., Bavera, S. S., et al. 2023, ApJS, 264, 45
2023
-
[13]
L., Belczynski, K., Wiktorowicz, G., et al
Fryer, C. L., Belczynski, K., Wiktorowicz, G., et al. 2012, ApJ, 749, 91 Fürst, F., Walton, D. J., Harrison, F. A., et al. 2016, ApJ, 831, L14
2012
-
[14]
Gallegos-Garcia, M., Berry, C. P. L., Marchant, P., & Kalogera, V . 2021, ApJ, 922, 110
2021
-
[15]
A., & Kirk, J
Georganopoulos, M., Aharonian, F. A., & Kirk, J. G. 2002, A&A, 388, L25 Gierli´nski, M., Done, C., & Page, K. 2008, MNRAS, 388, 753 Gierli´nski, M., Done, C., & Page, K. 2009, MNRAS, 392, 1106
2002
-
[16]
C., Copperwheat, C., Heinke, C
Gladstone, J. C., Copperwheat, C., Heinke, C. O., et al. 2013, ApJS, 206, 14
2013
-
[17]
L., Woosley, S
Heger, A., Fryer, C. L., Woosley, S. E., Langer, N., & Hartmann, D. H. 2003, ApJ, 591, 288
2003
-
[18]
M., Davies, B., et al
Heida, M., Lau, R. M., Davies, B., et al. 2019, ApJ, 883, L34
2019
-
[19]
Heida, M., Torres, M. A. P., Jonker, P. G., et al. 2015, MNRAS, 453, 3510
2015
-
[20]
T., & Isobe, N
Inoue, Y ., Tanaka, Y . T., & Isobe, N. 2016, MNRAS, 461, 4329
2016
-
[21]
Kaaret, P., Feng, H., & Roberts, T. P. 2017, ARA&A, 55, 303
2017
-
[22]
2023, New Astronomy Reviews, 96, 101672
King, A., Lasota, J.-P., & Middleton, M. 2023, New Astronomy Reviews, 96, 101672
2023
-
[23]
King, A. R. 2009, MNRAS, 393, L41
2009
-
[24]
R., Davies, M
King, A. R., Davies, M. B., Ward, M. J., Fabbiano, G., & Elvis, M. 2001, ApJ, 552, L109
2001
-
[25]
J., et al
Kosec, P., Pinto, C., Walton, D. J., et al. 2018, MNRAS, 479, 3978
2018
-
[26]
A., & Gilmore, G
Kroupa, P., Tout, C. A., & Gilmore, G. 1993, MNRAS, 262, 545
1993
-
[27]
P., Alexander, T., Dubus, G., et al
Lasota, J. P., Alexander, T., Dubus, G., et al. 2011, ApJ, 735, 89
2011
-
[28]
2016, A&A, 587, A13
Lasota, J.-P., Vieira, R., Sadowski, A., Narayan, R., & Abramowicz, M. 2016, A&A, 587, A13
2016
-
[29]
D., Eufrasio, R
Lehmer, B. D., Eufrasio, R. T., Basu-Zych, A., et al. 2021, ApJ, 907, 17
2021
-
[30]
N., & Seitzer, P
Liu, J.-F., Bregman, J. N., & Seitzer, P. 2004, ApJ, 602, 249
2004
-
[31]
2011, Astronomische Nachrichten, 332, 414
Mapelli, M., Ripamonti, E., Zampieri, L., & Colpi, M. 2011, Astronomische Nachrichten, 332, 414
2011
-
[32]
Marchant, P., Pappas, K. M. W., Gallegos-Garcia, M., et al. 2021, A&A, 650, A107
2021
-
[33]
C., Tchekhovskoy, A., Sadowski, A., & Narayan, R
McKinney, J. C., Tchekhovskoy, A., Sadowski, A., & Narayan, R. 2014, MN- RAS, 441, 3177
2014
-
[34]
2013, MNRAS, 436, 3128
Mezcua, M., Roberts, T., Sutton, A., & Lobanov, A. 2013, MNRAS, 436, 3128
2013
-
[35]
2019, MNRAS, 486, 2
Middleton, M., Brightman, M., Pintore, F., et al. 2019, MNRAS, 486, 2
2019
-
[36]
J., Heil, L., Pintore, F., Walton, D
Middleton, M. J., Heil, L., Pintore, F., Walton, D. J., & Roberts, T. P. 2015, MNRAS, 447, 3243
2015
-
[37]
J., Miller-Jones, J
Middleton, M. J., Miller-Jones, J. C., Markoff, S., et al. 2013, Nature, 493, 187
2013
-
[38]
1984, PASJ, 36, 741
Mitsuda, K., Inoue, H., Koyama, K., et al. 1984, PASJ, 36, 741
1984
-
[39]
Mondal, S., Belczy´nski, K., Wiktorowicz, G., Lasota, J.-P., & King, A. R. 2020, MNRAS, 491, 2747
2020
-
[40]
2014, Nature, 514, 198
Motch, C., Pakull, M., Soria, R., Grisé, F., & Pietrzy´nski, G. 2014, Nature, 514, 198
2014
-
[41]
& Webster, B
Murdin, P. & Webster, B. L. 1971, Nature, 233, 110
1971
-
[42]
2021, MNRAS, 501, 2424
Poutanen, J. 2021, MNRAS, 501, 2424
2021
-
[43]
Patton, R. A. & Sukhbold, T. 2020, MNRAS, 499, 2803
2020
-
[44]
2011, ApJS, 192, 3
Paxton, B., Bildsten, L., Dotter, A., et al. 2011, ApJS, 192, 3
2011
-
[45]
2020, MNRAS, 492, 4646
Pinto, C., Walton, D., Kara, E., et al. 2020, MNRAS, 492, 4646
2020
- [46]
-
[47]
G., & Abolmasov, P
Poutanen, J., Lipunova, G., Fabrika, S., Butkevich, A. G., & Abolmasov, P. 2007, MNRAS, 377, 1187
2007
-
[48]
2008, MNRAS, 387, 73 S˛ adowski, A
Roberts, T., Levan, A., & Goad, M. 2008, MNRAS, 387, 73 S˛ adowski, A. & Narayan, R. 2015, MNRAS, 453, 3213
2008
-
[49]
2023, MNRAS, 522, 1377
Salvaggio, C., Wolter, A., Belfiore, A., & Colpi, M. 2023, MNRAS, 522, 1377
2023
-
[50]
2013, A&A, 550, A107
Sana, H., de Koter, A., De Mink, S., et al. 2013, A&A, 550, A107
2013
-
[51]
Shakura, N. I. & Sunyaev, R. A. 1973, A&A, 24, 337
1973
-
[52]
S., & Gö˘gü¸ s, E
Sonbas, E., Dhuga, K. S., & Gö˘gü¸ s, E. 2019, ApJ, 873, L12
2019
-
[53]
1979, ApJ, 234, L9
Tananbaum, H., Avni, Y ., Branduardi, G., et al. 1979, ApJ, 234, L9
1979
-
[54]
2012, ApJ, 758, 85
Tao, L., Feng, H., Kaaret, P., Grisé, F., & Jin, J. 2012, ApJ, 758, 85
2012
-
[55]
Vagnozzi, S., Freese, K., & Zurbuchen, T. H. 2017, ApJ, 839, 55 Van Den Eijnden, J., Degenaar, N., Schulz, N., et al. 2019, MNRAS, 487, 4355
2017
-
[56]
2020, MNRAS, 494, 5350
Vasilopoulos, G., Ray, P., Gendreau, K., et al. 2020, MNRAS, 494, 5350
2020
-
[57]
2013, Astrophysical Bulletin, 68, 139
Vinokurov, A., Fabrika, S., & Atapin, K. 2013, Astrophysical Bulletin, 68, 139
2013
-
[58]
2022, MNRAS, 509, 1587
Walton, D., Mackenzie, A., Gully, H., et al. 2022, MNRAS, 509, 1587
2022
-
[59]
2011, MNRAS, 416, 1844
Walton, D., Roberts, T., Mateos, S., & Heard, V . 2011, MNRAS, 416, 1844
2011
-
[60]
2017, ApJ, 846, 17 Article number, page 12 of 16 Lutendo Nyadzani , Soebur Razzaque, and Justin D
Wiktorowicz, G., Sobolewska, M., Lasota, J.-P., & Belczynski, K. 2017, ApJ, 846, 17 Article number, page 12 of 16 Lutendo Nyadzani , Soebur Razzaque, and Justin D. Finke: A Synthetic Population of Ultra-Luminous X-ray Sources Appendix A Fig. A1 shows the SED for a 15 M⊙ BH and...
2019
Reviewed August 10, 2026 · model on record in the stance chip above.
Discussion (0). Continue with ORCID to comment.