REVIEW 4 major objections 4 minor 81 references
JWST Observations of Starbursts: Relations between PAH features and CO clouds in the starburst galaxy M 82
T0 review · 4 major / 4 minor · reviewed 2026-08-10 · deepseek-v4-flash
Pith's one-line read M 82's starburst makes CO a poorer tracer of molecular gas in small clouds.
desk verdict New JWST data give the first cloud-scale CO–PAH comparison in M 82, but the claimed shallower slopes are plausibly a sensitivity artifact, so the headline comparison to PHANGS is not yet established. read the letter →
The pith
A machine-rendered reading of the paper's core claim, the machinery that carries it, and where it could break.
The reading
What carries the argument
The load-bearing object is the per-cloud scaling relation between integrated CO(1-0) intensity and the intensity of the 7.7 and 11.3 micron PAH bands, measured on 306 cloud footprints extracted from the CO moment-0 map. PAHs are large carbon molecules that emit characteristic mid-infrared bands after absorbing ultraviolet photons, so they trace gas heated by young stars. The analysis sums each map inside the cloud footprints, fits log-log power laws, and compares the fitted slopes to control spirals, using a first-order continuum subtraction, MIRI filter-band corrections, and a fixed CO(2-1)-to-CO(1-0) line ratio to place the comparison on the same footing.
What would settle it
Re-derive the CO-PAH slopes after adding the faint clouds that fall below the current CO detection threshold, using a deeper, higher-resolution CO(1-0) map or a higher-J CO map matched to the MIRI resolution. If the recovered slopes rise to $\approx 0.9$–$1.0$, the claimed intrinsic shallowness in M 82 is an artifact of missing faint CO clouds; if they stay near $0.7$–$0.8$, the physical suppression interpretation is supported.
Extended reading notes
Core claim
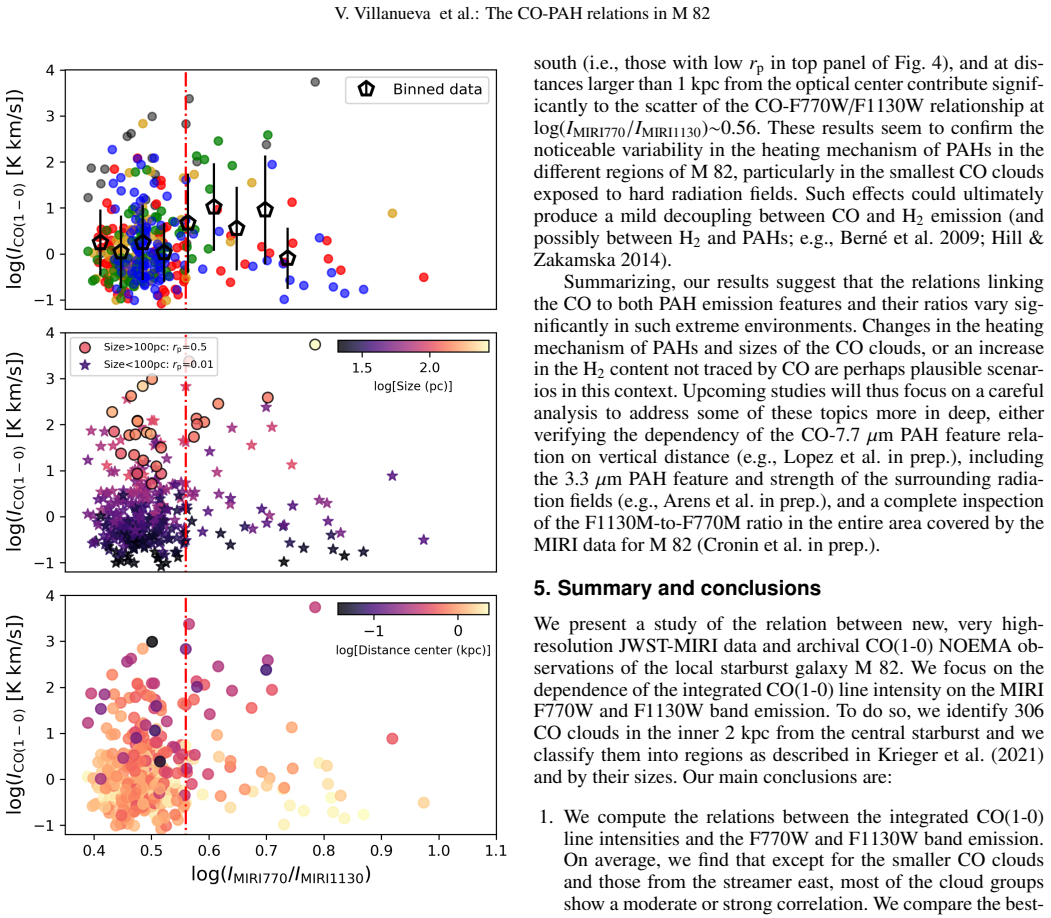
The central claim is that in the nearby starburst galaxy M 82, the relations between CO(1-0) line emission and the mid-infrared PAH features at 7.7 and 11.3 microns are genuinely shallower than the same relations in local main-sequence spiral galaxies. Using 306 molecular cloud footprints identified in the inner 2 kpc of an archival CO moment-0 map and matched-resolution JWST MIRI images, the authors fit power laws with slopes $m=0.74\pm0.19$ for F770W and $m=0.81\pm0.25$ for F1130W, against $m=0.93\pm0.05$ and $m=1.00\pm0.08$ for spirals after converting CO(2-1) to CO(1-0) with a fixed line ratio $R_{21}=1$. They also find moderate correlations between CO intensity and the F770W/F1130W ratio in most regions, with the scatter increasing sharply above $\log(I_{770}/I_{1130})\approx0.56$, concentrated in small clouds at large projected distances. The authors conclude that the hard starburst radiation field suppresses CO emission in the smallest clouds, so CO does not trace the full molecular-gas budget and PAH emission becomes relatively brighter.
Load-bearing premise
The claim depends on the assumption that the CO map's limited sensitivity and cloud selection do not remove faint clouds; if they do, the fitted slopes are artificially shallow and the comparison to normal spirals does not measure a real physical difference.
Editorial extensions
If this is right
- CO-based molecular gas masses in M 82's outflow and streamer regions are likely lower limits, with the missing fraction greatest for clouds smaller than about 100 pc.
- The 7.7 and 11.3 micron PAH bands become relatively brighter per unit CO as the starburst radiation field hardens, so PAH intensity can serve as a complementary gas tracer in extreme environments.
- The CO-PAH scaling relations in starbursts are not universal; they depend on cloud size and location, so calibrations from normal spiral disks should not be applied to starburst outflows.
- The sharp increase in scatter of the CO-F770W/F1130W relation above a band ratio of about 0.56 marks a transition to a regime where PAH ionization state and CO emission decouple.
Reading between the lines
- Editorial inference: If CO is suppressed rather than absent, high-excitation CO lines or direct H2 rotational lines should recover some of the missing gas, and a multi-J CO study of the same 306 clouds would test this directly.
- Editorial inference: The same size-dependent bias would apply to high-redshift starbursts, where CO is often the only cold-gas tracer, so PAH-to-CO ratios could serve as a diagnostic of CO-dark gas.
- Editorial inference: The near-zero CO-F770W correlation in the streamer-east region suggests the local radiation geometry, not just the global starburst intensity, sets the CO-to-PAH ratio.
Editorial analysis
A structured set of objections, weighed in public.
Referee Report
Summary. The paper presents new JWST/MIRI F770W and F1130W images of M 82 and combines them with the archival NOEMA CO(1-0) moment-0 map to measure, for 306 CO-selected clouds, the power-law relations between CO(1-0) integrated intensity and the 7.7 and 11.3 micron PAH band intensities. The authors report global slopes m = 0.74 +/- 0.19 (F770W) and m = 0.81 +/- 0.25 (F1130W), compare these with the PHANGS/C24 slopes of 0.93 +/- 0.05 and 1.00 +/- 0.08, and interpret the lower values as evidence that CO does not trace the full molecular gas budget in smaller clouds exposed to hard radiation. They also examine the CO versus F770W/F1130W ratio and find moderate correlations for some regional and size-selected subsets. The paper explicitly acknowledges that the CO data sensitivity and cloud-selection threshold could bias the slopes toward shallower values.
Significance. If the claimed slope difference were robust, it would be an interesting constraint on the CO-to-H2 calibration in starburst outflows and on PAH emission in extreme environments. The new MIRI data are valuable, and the paper is commendably transparent about its sensitivity limitations and about the R21 = 1.0 assumption used to compare with PHANGS. However, the central quantitative claim is currently not established: the reported slope differences are within about one combined standard deviation, and the CO-selected sample is truncated from below in exactly the quantity used as the dependent variable, a bias that the authors themselves identify but do not quantify. The result is therefore best treated as a promising but unproven hint rather than a measured physical difference.
major comments (4)
- [Section 4.1, Eqs. (2)-(3)] The central claim that the M 82 slopes are lower than in PHANGS/C24 is not supported by the quoted uncertainties. For F770W, the difference is 0.93 - 0.74 = 0.19 with a combined uncertainty of sqrt(0.19^2 + 0.05^2) = 0.20, i.e., less than one standard deviation. For F1130W, 1.00 - 0.81 = 0.19 with a combined uncertainty of about 0.26, also less than one standard deviation. The text states these slopes are 'significantly below' the C24 values, but no significance test is presented. The authors should either provide a proper test of the slope difference or soften the claim to a marginal difference.
- [Sections 2.2, 4.1, 5; Appendix B] The CO intensities are truncated from below: the moment-0 map was blanked below SNR = 5 and QUICKCLUMP was run at a 3-sigma threshold, so low-CO clouds are missing from the sample. An OLS fit of log I_CO against log I_MIRI on such a censored sample is expected to produce a shallower slope, and the authors acknowledge in Section 5 that this 'could drive biases in the derivations of the power-law parameters, e.g. producing artificially shallower slopes.' Because this is the exact quantity on which the comparison to PHANGS rests, the caveat needs to be made quantitative: for example, by adding a censored-regression fit, by including upper limits from the noise map, or by simulating the effect of the CO threshold on the recovered slope. Without such an analysis, the offset from the PHANGS slopes is not yet established.
- [Appendix A and Section 3.1] The continuum subtraction is a first-order correction in which the continuum-to-total fraction is modeled by a four-parameter sigmoid fitted to MRS/IRS spectra and then extrapolated to all clouds. The continuum contributes 35-50% of the F770W band and about 35% of the F1130W band, so errors in this correction could alter the derived slopes and normalizations. The agreement with CAFE at a few locations is encouraging, but no uncertainty on the sigmoid parameters is propagated through Equation (1), and no test of the sensitivity of the final slopes to alternative continuum prescriptions is given. The authors should show that the main conclusions are robust to the continuum-correction choice.
- [Table 1] The note in Table 1 that 'all rp have p-values << 0.01' is not correct for several entries. For example, the streamer-east CO-F770W correlation has rp = 0.14 with only 46 clouds, which is consistent with the null hypothesis (p of order 0.3), and the outflow-south CO-F770W/F1130W correlation has rp = -0.22 with 104 clouds, which is not significant at p < 0.01. The blanket statement overstates the significance of the correlations and should be replaced by individually computed p-values.
minor comments (4)
- [Abstract vs. Section 3.2] The abstract states cloud sizes range from about 21 to 270 pc, while Section 3.2 and Figure 2 give a minimum size around 31 pc. Please make the numbers consistent.
- [Section 3.3] The R21 = 1.0 assumption is clearly stated, but the paper should note explicitly that if R21 varies with PAH brightness or with position in M 82, the comparison slope could be affected; the current statement only addresses the normalization.
- [Section 4.1] The fitting procedure is described as 'binned in the x-axis,' but the number of bins, the binning rule, and whether the fit uses bin means or individual points are not specified. Please provide these details so the reader can assess the fit.
- [Section 3.2] The choice to identify clouds in the 2D moment-0 map rather than the 3D datacube is explained, but the resulting line-of-sight blending bias is mentioned only in passing. A sentence quantifying the expected effect on the derived slopes would be helpful.
Circularity Check
No significant circularity: the CO-PAH slopes are empirical fits compared against external PHANGS/C24 measurements, with no fitted parameter renamed as a prediction.
full rationale
The paper's central claim is an empirical scaling-relation measurement, not a derivation-from-first-principles result. The slopes m = 0.74 ± 0.19 and m = 0.81 ± 0.25 are obtained by ordinary least squares fits of log I_CO(1-0) versus log I_MIRI (Eqs. 2 and 3) and then compared to slopes from the external PHANGS/C24 sample (Chown et al. 2024). The CO clouds are selected from the archival NOEMA CO(1-0) moment zero map (Krieger et al. 2021), and the PAH intensities are measured in the same footprints; the slope is not defined in terms of any input parameter that would make the comparison an identity. The R21 = 1.0 conversion is taken from Weiß et al. (2005) and Walter et al. (2002), which are independent of the fitted values. The MIRI band and continuum corrections use Donnelly et al. (2025), an external calibration, and the same-group citations (Krieger et al. 2021; Bolatto et al. 2024) are data and observation references, not unverified theorems or ansatz adoptions. The paper explicitly warns in Sections 4.1 and 5 that the CO sensitivity and blanking could bias the slopes, producing artificially shallower values; this is a statistical selection caveat affecting the astrophysical interpretation, not a circularity. No load-bearing argument reduces to its own inputs, so the analysis is self-contained as an empirical comparison.
Assumptions & free parameters
free parameters (3)
- Continuum fraction sigmoid parameters for F770W =
alpha=0.16, beta=0.06, gamma=90.1, rho=0.59
- Continuum fraction sigmoid parameters for F1130W =
alpha=0.19, beta=0.1, gamma=147, rho=0.55
- QUICKCLUMP detection thresholds =
not fully stated (3-sigma, 6-pixel minimum diameter)
assumptions (5)
- domain assumption R21 = L_CO(2-1)/L_CO(1-0) = 1.0 is representative for M82 clouds (Weiß et al. 2005).
- domain assumption The jwst_background model correctly predicts the missing on-sky background for F770W and F1130W.
- domain assumption Continuum fractions measured from a few MRS spaxels and two IRS regions can be extrapolated to all clouds via a function of the F770W/F1130W ratio.
- domain assumption CO clouds identified in the 2D NOEMA moment 0 map correspond to the emitting structures seen in the projected MIRI maps.
- domain assumption PAH 7.7 and 11.3 micron emission traces PAH abundance and is a proxy for molecular gas/star formation, as established in cited literature.
Cite this review
Pith. "Pith review of JWST Observations of Starbursts: Relations between PAH features and CO clouds in the starburst galaxy M 82." pith.science (2026). https://pith.science/paper/BDZTKEB5
@misc{pith2026250114893,
  author       = {Pith},
  title        = {Pith review of: JWST Observations of Starbursts: Relations between PAH features and CO clouds in the starburst galaxy M 82},
  year         = {2026},
  howpublished = {\url{https://pith.science/paper/BDZTKEB5}},
  note         = {Machine review of arXiv:2501.14893}
}
abstract
We present a study of new 7.7-11.3 $\mu$m data obtained with the James Webb Space Telescope Mid-InfraRed Instrument in the starburst galaxy M 82. In particular, we focus on the dependency of the integrated CO(1-0) line intensity on the MIRI-F770W and MIRI-F1130W filter intensities to investigate the correlation between CO content and the 7.7 and 11.3 $\mu$m features from polycyclic aromatic hydrocarbons (PAH) in M 82's outflows. To perform our analysis, we identify CO clouds using archival $^{12}$CO($J$=1-0) NOEMA moment 0 map within 2 kpc from the center of M 82, with sizes ranging between $\sim$21 and 270 pc; then, we compute the CO-to-PAH relations for the 306 validated CO clouds. On average, the power-law slopes for the two relations in M 82 are lower than what is seen in local main-sequence spirals. In addition, there is a moderate correlation between $I_{\rm CO(1-0)}$-$I_{\rm 7.7\mu m} /I_{\rm 11.3\mu m}$ for most of the CO cloud groups analyzed in this work. Our results suggest that the extreme conditions in M 82 translate into CO not tracing the full budget of molecular gas in smaller clouds, perhaps as a consequence of photoionization and/or emission suppression of CO molecules due to hard radiation fields from the central starburst.
Figures


Figures from the paper (1 more)
Reference graph
Works this paper leans on
-
[1]
, " * write output.state after.block = add.period write newline
ENTRY address archiveprefix author booktitle chapter edition editor howpublished institution eprint journal key month note number organization pages publisher school series title type volume year label extra.label sort.label short.list INTEGERS output.state before.all mid.sentence after.sentence after.block FUNCTION init.state.consts #0 'before.all := #1 ...
-
[2]
write newline
" write newline "" before.all 'output.state := FUNCTION n.dashify 't := "" t empty not t #1 #1 substring "-" = t #1 #2 substring "--" = not "--" * t #2 global.max substring 't := t #1 #1 substring "-" = "-" * t #2 global.max substring 't := while if t #1 #1 substring * t #2 global.max substring 't := if while FUNCTION word.in bbl.in " " * FUNCTION format....
-
[3]
Alonso-Herrero , A., Pereira-Santaella , M., Rigopoulou , D., et al. 2020, , 639, A43
work page 2020
-
[4]
M., Sip o cz , B
Astropy Collaboration , Price-Whelan , A. M., Sip o cz , B. M., et al. 2018, , 156, 123
2018
-
[5]
Beir \ a o , P., Brandl , B. R., Appleton , P. N., et al. 2008, , 676, 304
work page 2008
- [6]
-
[7]
S., Suess , K
Bezanson , R., Spilker , J. S., Suess , K. A., et al. 2022, , 925, 153
2022
- [8]
Show all 81 references
-
[9]
A., Law , D
Bundy , K., Bershady , M. A., Law , D. R., et al. 2015, , 798, 7
2015
-
[10]
2013, in Secular Evolution of Galaxies, ed
Calzetti , D. 2013, in Secular Evolution of Galaxies, ed. J. Falc \'o n-Barroso & J. H. Knapen , 419
2013
-
[11]
2024, , 690, A348
Chastenet , J., De Looze , I., Rela \ n o , M., et al. 2024, , 690, A348
2024
-
[12]
2023, , 944, L11
Chastenet , J., Sutter , J., Sandstrom , K., et al. 2023, , 944, L11
2023
-
[13]
K., Sandstrom , K., et al
Chown , R., Leroy , A. K., Sandstrom , K., et al. 2024, arXiv e-prints, arXiv:2410.05397
2024 arXiv
-
[14]
2021, , 500, 1261
Chown , R., Li , C., Parker , L., et al. 2021, , 500, 1261
2021
-
[15]
2019, , 482, 1618
Cortzen , I., Garrett , J., Magdis , G., et al. 2019, , 482, 1618
2019
-
[16]
2024, , 689, A263
Davies , R., Shimizu , T., Pereira-Santaella , M., et al. 2024, , 689, A263
2024
-
[17]
S., Chatzigiannakis , D., Bigiel , F., et al
den Brok , J. S., Chatzigiannakis , D., Bigiel , F., et al. 2021, , 504, 3221
2021
-
[18]
P., Lai , T
Donnelly , G. P., Lai , T. S. Y., Armus , L., et al. 2025, arXiv e-prints, arXiv:2501.19397
2025 arXiv
-
[19]
Draine , B. T. 2011, , 732, 100
2011
-
[20]
Draine , B. T. & Li , A. 2007, , 657, 810
2007
-
[21]
T., Li , A., Hensley , B
Draine , B. T., Li , A., Hensley , B. S., et al. 2021, , 917, 3
2021
-
[22]
V., Kreckel , K., Sandstrom , K
Egorov , O. V., Kreckel , K., Sandstrom , K. M., et al. 2023, , 944, L16
2023
-
[23]
2022, , 935, 64
Egusa , F., Gao , Y., Morokuma-Matsui , K., Liu , G., & Maeda , F. 2022, , 935, 64
2022
-
[24]
B., Bolatto , A
Fisher , D. B., Bolatto , A. D., Chisholm , J., et al. 2024, arXiv e-prints, arXiv:2405.03686
2024 arXiv
-
[25]
M., Sauvage , M., Charmandaris , V., et al
F \"o rster Schreiber , N. M., Sauvage , M., Charmandaris , V., et al. 2003, , 399, 833
2003
-
[26]
L., Hughes , S
Freedman , W. L., Hughes , S. M., Madore , B. F., et al. 1994, , 427, 628
1994
-
[27]
2019, , 887, 172
Gao , Y., Xiao , T., Li , C., et al. 2019, , 887, 172
2019
-
[28]
D., Bohlin , R., Sloan , G
Gordon , K. D., Bohlin , R., Sloan , G. C., et al. 2022, , 163, 267
2022
-
[29]
R., Millman, K
Harris, C. R., Millman, K. J., van der Walt, S. J., et al. 2020, Nature, 585, 357
2020
-
[30]
Hill , M. J. & Zakamska , N. L. 2014, , 439, 2701
2014
-
[31]
R., Roellig , T
Houck , J. R., Roellig , T. L., van Cleve , J., et al. 2004, , 154, 18
2004
-
[32]
Hunter, J. D. 2007, Computing in Science & Engineering, 9, 90
2007
-
[33]
Indebetouw , R., Wong , T., Chen , C. H. R., et al. 2020, , 888, 56
2020
-
[34]
P., Marrone , D
Keenan , R. P., Marrone , D. P., & Keating , G. K. 2024, arXiv e-prints, arXiv:2409.03963
2024 arXiv
-
[35]
1998, , 498, 541
Kennicutt , Robert C., J. 1998, , 498, 541
1998
-
[36]
Kennicutt , R. C. & Evans , N. J. 2012, , 50, 531
2012
-
[37]
D., et al
Krieger , N., Walter , F., Bolatto , A. D., et al. 2021, , 915, L3
2021
-
[38]
K., Bolatto , A
Leroy , A. K., Bolatto , A. D., Sandstrom , K., et al. 2023, , 944, L10
2023
-
[39]
K., Hughes , A., Liu , D., et al
Leroy , A. K., Hughes , A., Liu , D., et al. 2021 a , , 255, 19
2021
-
[40]
K., Rosolowsky , E., Usero , A., et al
Leroy , A. K., Rosolowsky , E., Usero , A., et al. 2022, , 927, 149
2022
-
[41]
K., Schinnerer , E., Hughes , A., et al
Leroy , A. K., Schinnerer , E., Hughes , A., et al. 2021 b , , 257, 43
2021
-
[42]
K., Walter , F., Martini , P., et al
Leroy , A. K., Walter , F., Martini , P., et al. 2015, , 814, 83
2015
-
[43]
C., Bolatto , A
Levy , R. C., Bolatto , A. D., Leroy , A. K., et al. 2021, , 912, 4
2021
-
[44]
C., Bolatto , A
Levy , R. C., Bolatto , A. D., Mayya , D., et al. 2024, , 973, L55
2024
-
[45]
C., Bolatto , A
Levy , R. C., Bolatto , A. D., Tarantino , E., et al. 2023, , 958, 109
2023
-
[46]
A., Herter , T
Marshall , J. A., Herter , T. L., Armus , L., et al. 2007, , 670, 129
2007
-
[47]
K., Mangum , J
Martini , P., Leroy , A. K., Mangum , J. G., et al. 2018, , 856, 61
2018
-
[48]
D., Romano , R., Rodr \' guez-Merino , L
Mayya , Y. D., Romano , R., Rodr \' guez-Merino , L. H., et al. 2008, , 679, 404
2008
-
[49]
M., & Graham , J
McCrady , N., Gilbert , A. M., & Graham , J. R. 2003, , 596, 240
2003
-
[50]
D., Castles , J., Greve , A., & Downes , D
McKeith , C. D., Castles , J., Greve , A., & Downes , D. 1993, , 272, 98
1993
-
[51]
D., Dav \'e , R., Kere s , D., et al
Oppenheimer , B. D., Dav \'e , R., Kere s , D., et al. 2010, , 406, 2325
2010
-
[52]
J., Symeonidis , M., Vieira , J
Page , M. J., Symeonidis , M., Vieira , J. D., et al. 2012, , 485, 213
2012
-
[53]
P., Bisbas , T
Papadopoulos , P. P., Bisbas , T. G., & Zhang , Z.-Y. 2018, , 478, 1716
2018
-
[54]
2011, Journal of Machine Learning Research, 12, 2825
Pedregosa, F., Varoquaux, G., Gramfort, A., et al. 2011, Journal of Machine Learning Research, 12, 2825
2011
-
[55]
2013, , 772, 92
Pope , A., Wagg , J., Frayer , D., et al. 2013, , 772, 92
2013
-
[56]
& Hensler , G
Recchi , S. & Hensler , G. 2013, , 551, A41
2013
-
[57]
W., Thornley , M
Regan , M. W., Thornley , M. D., Vogel , S. N., et al. 2006, , 652, 1112
2006
-
[58]
W., Pineda , J
Rosolowsky , E. W., Pineda , J. E., Kauffmann , J., & Goodman , A. A. 2008, , 679, 1338
2008
-
[59]
1959, , 129, 243
Schmidt , M. 1959, , 129, 243
1959
-
[60]
T., Davies , R
Shimizu , T. T., Davies , R. I., Lutz , D., et al. 2019, , 490, 5860
2019
-
[61]
V., Papovich , C., Rieke , G
Shipley , H. V., Papovich , C., Rieke , G. H., Brown , M. J. I., & Moustakas , J. 2016, , 818, 60
2016
-
[62]
2024, , 690, A89
Shivaei , I., Alberts , S., Florian , M., et al. 2024, , 690, A89
2024
-
[63]
& Boogaard , L
Shivaei , I. & Boogaard , L. A. 2024, , 691, L2
2024
-
[64]
2017, Quickclump: Identify clumps within a 3D FITS datacube , Astrophysics Source Code Library, record ascl:1704.006
Sidorin , V. 2017, Quickclump: Identify clumps within a 3D FITS datacube , Astrophysics Source Code Library, record ascl:1704.006
2017
-
[65]
Smith , J. D. T., Draine , B. T., Dale , D. A., et al. 2007, , 656, 770
2007
-
[66]
J., Westmoquette , M
Smith , L. J., Westmoquette , M. S., Gallagher , J. S., et al. 2006, , 370, 513
2006
-
[67]
S., Phadke , K
Spilker , J. S., Phadke , K. A., Aravena , M., et al. 2023, , 618, 708
2023
-
[68]
A., Bezanson , R., Spilker , J
Suess , K. A., Bezanson , R., Spilker , J. S., et al. 2017, , 846, L14
2017
-
[69]
2024, , 971, 178
Sutter , J., Sandstrom , K., Chastenet , J., et al. 2024, , 971, 178
2024
-
[70]
M., Papadopoulos , P
Swinbank , A. M., Papadopoulos , P. P., Cox , P., et al. 2011, , 742, 11
2011
-
[71]
M., Sun , J., et al
Teng , Y.-H., Sandstrom , K. M., Sun , J., et al. 2022, , 925, 72
2022
-
[72]
Tielens , A. G. G. M. 2008, , 46, 289
2008
-
[73]
E., et al
Virtanen, P., Gommers, R., Oliphant, T. E., et al. 2020, Nature Methods, 17, 261
2020
-
[74]
2002, , 580, L21
Walter , F., Weiss , A., & Scoville , N. 2002, , 580, L21
2002
-
[75]
Waskom, M. L. 2021, Journal of Open Source Software, 6, 3021
2021
-
[76]
Wei , A., Walter , F., & Scoville , N. Z. 2005, , 438, 533
2005
-
[77]
P., de Geus , E
Williams , J. P., de Geus , E. J., & Blitz , L. 1994, , 428, 693
1994
-
[78]
2012, , 539, A116
W \"u nsch , R., J \'a chym , P., Sidorin , V., et al. 2012, , 539, A116
2012
-
[79]
2021, , 73, 257
Yajima , Y., Sorai , K., Miyamoto , Y., et al. 2021, , 73, 257
2021
-
[80]
S., Ho , P
Yun , M. S., Ho , P. T. P., & Lo , K. Y. 1994, , 372, 530
1994
-
[81]
K., Bolatto , A
Zschaechner , L. K., Bolatto , A. D., Walter , F., et al. 2018, , 867, 111
2018
Reviewed August 10, 2026 · model on record in the stance chip above.
Discussion (0). Continue with ORCID to comment.