REVIEW 3 major objections 5 minor 90 references
Exploring Spatial Hybrid User Interface for Visual Sensemaking
T0 review · 3 major / 5 minor · reviewed 2026-08-09 · deepseek-v4-flash
Pith's one-line read A spatial hybrid interface that embeds a movable simulated PC inside virtual reality is preferred over VR-only and performs just as well as either environment alone.
desk verdict A well-run hybrid-interface study with a genuine design extension, but the no-negative-impact-on-performance claim overreaches its null results and the authors' own limitations section admits the sample was too small. read the letter →
The pith
A machine-rendered reading of the paper's core claim, the machinery that carries it, and where it could break.
The reading
What carries the argument
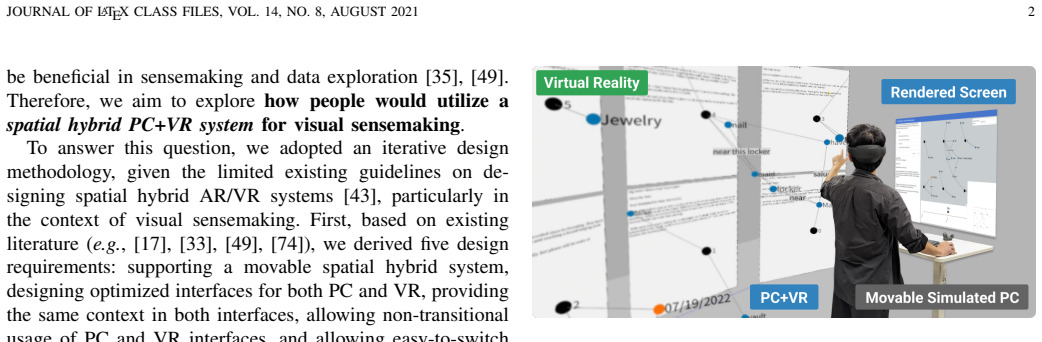
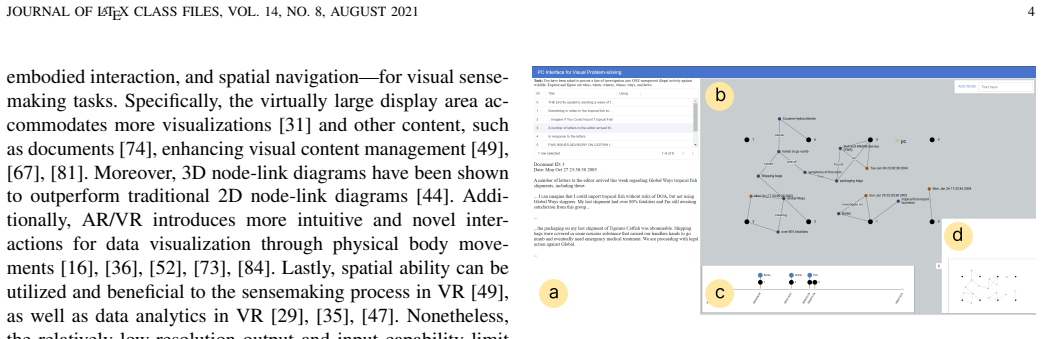
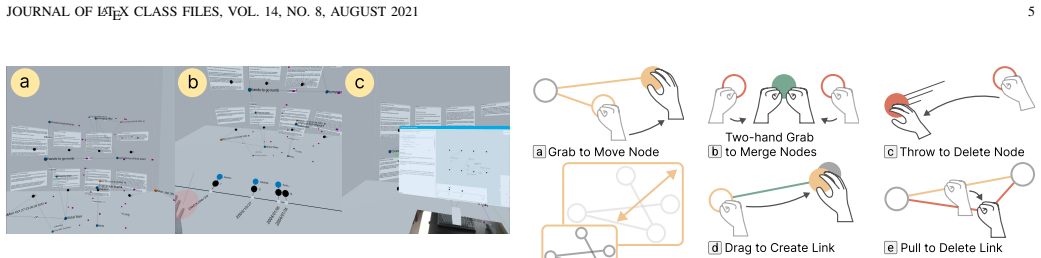
The central mechanism is the simulated PC in VR, placed on an Augmented Virtuality segment of the reality–virtuality continuum: a screen-cast laptop display is rendered as a 32-inch 1440p virtual monitor whose position and rotation track a wheeled desk via a VIVE tracker, with a see-through rectangular area so the physical keyboard and mouse remain visible and usable. Synchronized state and cross-device linking and brushing keep the PC and VR views showing the same document, node, and link selections, and hand gestures (pinch, grab, fist, flat) replace VR controllers to make switching between mouse and keyboard and mid-air input a matter of releasing one device and moving the hand. The design requirements (movable hybrid, optimized per-device interfaces, shared context, low transition cost, easy input switching) drive the implementation, and the user study provides the evidence that this particular arrangement does not impose a performance penalty.
What would settle it
Replace the simulated PC with a physical monitor of identical size mounted on the same tracked desk and rerun the same three-condition study; if PC+VR then outperforms PC-only on time or changes preference rankings, the original no-penalty result was an artifact of simulation fidelity rather than a property of the hybrid concept.
Extended reading notes
Core claim
The paper claims that combining a PC and a VR headset into a single spatial hybrid environment—rendering a simulated PC screen inside VR on a physically movable tracked desk—lets users switch between precise desktop interactions and immersive spatial navigation without the usual cost of switching devices. In a controlled study with 18 participants doing a document-based sensemaking task, the hybrid system was ranked higher than VR-only for overall preference (12/18) and for interaction (11/18), while task time, accuracy, and total interaction counts showed no significant difference across PC-only, VR-only, and PC+VR. The hybrid also reduced perceived physical demand relative to VR-only. The authors interpret this as evidence that the two environments can complement each other: VR supplies overview and spatial memory, the PC supplies precision and familiar input.
Load-bearing premise
The study assumes that the simulated PC—a screen-cast image rendered inside the headset with a see-through area for the physical keyboard and mouse—feels and performs like a real PC monitor; if its resolution, latency, or occlusion distorts the desktop experience, the comparison between PC+VR and the other conditions is no longer clean.
Editorial extensions
If this is right
- Wheeled desks plus tracked virtual monitors can let people move a desktop workspace through a VR environment, so spatial navigation and precise input are no longer mutually exclusive.
- Device-switching overhead in cross-reality visual analytics can be reduced by rendering one environment inside the other rather than requiring HMD removal.
- Analysis tools that pair an overview in immersive space with detail work on a simulated PC may let users externalize fewer graph nodes and links than on a PC alone.
- Lower physical demand compared to VR-only suggests hybrid configurations may sustain longer analysis sessions than pure VR.
- The four temporal strategies observed (mostly PC, mostly VR, VR-then-PC, frequent switching) imply that a single hybrid setup can accommodate different work styles.
Reading between the lines
- If the equivalence between simulated and physical PC holds, the simulated-PC approach could generalize beyond sensemaking to any precision-heavy desktop task inside VR rooms, not just data analysis.
- The study's null time and accuracy results are compatible with a trade-off: users may be exchanging interaction efficiency for fewer navigational steps, and a larger dataset or longer tasks might reveal where the crossover lies.
- A direct test would compare the simulated PC against a real physical monitor on the same tracked desk; if that changes preference or performance, the results are specific to the simulation's fidelity rather than to the hybrid concept.
- Tracking eye gaze (which the authors suggest) could reveal whether peeking at the other interface drives the frequent-switching strategy, and could inform adaptive transition costs.
Editorial analysis
A structured set of objections, weighed in public.
Referee Report
Summary. The paper presents a spatial hybrid user interface (PC+VR) for visual sensemaking, implemented as a simulated PC screen rendered in VR on a physically movable wheeled desk, with synchronized state and hand-gesture interaction in VR. The authors derive five design requirements, iteratively develop a prototype through a pilot study, and then run a within-subjects controlled study (N=18) comparing PC+VR against PC-only and VR-only on a document-analysis node-link diagram task. They report that PC+VR was preferred over VR-only overall and for interaction, reduced physical demand relative to VR-only, and showed no statistically significant differences in task time or accuracy. They also characterize temporal and spatial usage strategies from interaction and movement logs. The central claim is that the hybrid system combines benefits of PC and VR without a negative performance impact from switching overhead.
Significance. If the central claims are taken at face value, the paper makes a useful empirical contribution to the growing literature on hybrid and cross-reality interfaces for visual analytics: it shows that a movable simulated PC inside VR is feasible and preferred over VR-only, and it documents a rich set of usage strategies. Strengths include the within-subjects design with balanced Latin-square counterbalancing, use of appropriate non-parametric tests for ordinal data, logging of interaction and movement data, and release of the implementation as open-source code. The main significance hurdle is that the headline 'no negative impact on performance' is supported only by null results from a small sample, and the authors' own limitation statement acknowledges this. The preference and physical-demand findings are better supported, and the strategy analysis is a valuable qualitative contribution, but the performance-equivalence claim needs either stronger statistical support or a more cautious framing.
major comments (3)
- [Abstract; Section VI (Results); Section VII (Limitations)] The claim that the hybrid system 'did not negatively impact performance' rests on null results for time (F(2,34)=1.53, p=0.230) and accuracy (χ²(2)=0.426, p=0.808) from N=18 participants. The authors themselves state in the Limitations that 'We did not observe any significant results in performance in these studies, most likely due to the unfamiliarity of our conditions and limited sample size.' A null hypothesis significance test with this sample size has low power to detect small-to-moderate effects, and no equivalence bounds, TOST procedures, or Bayes factors are reported. Thus the absence of a significant difference does not establish the absence of a negative impact. This is a load-bearing component of the abstract and conclusions. Please reframe the claim as 'no significant difference was detected' or provide an equivalence test with pre-specified bounds to support the stronger claim.
- [Section IV-C (Simulated PC in PC+VR); Section V-C (Improvements)] The simulated PC in the PC+VR condition is not a faithful reproduction of the physical PC condition: the virtual screen has a lower angular resolution (0.045 vs 0.015 visual angle per pixel) and adds latency from WebRTC screen casting, despite the WebXR layer improvements. This confounds the comparison between PC+VR and PC-only, because any performance deficit from the simulated PC's fidelity is attributed to the hybrid concept rather than to the display/streaming implementation. The paper argues this biases against PC+VR, but that does not rescue the null result; it means the null could reflect a balance between hybrid benefits and display degradation. Please report the measured end-to-end latency and, if possible, include a manipulation check or a sub-analysis of tasks performed on the simulated PC to assess whether fidelity affected performance.
- [Section VI (Spatial strategies); Figure 14] The four spatial strategy categories are defined by thresholds (≥290m or <290m for user movement, ≥5.5m or <5.5m for table movement) that are presented without justification or sensitivity analysis. It is unclear whether these thresholds were derived from the data distribution, from a priori expectations, or from the pilot study. If the thresholds are arbitrary, the resulting taxonomy (Stationary User and PC, Stationary PC, Self-Rotation, Carrying) may not be robust. Please explain how the thresholds were selected and show that the qualitative conclusions are insensitive to reasonable variations in the thresholds. The same concern applies to the temporal strategy thresholds (e.g., >75% time, frequent vs non-frequent switching) used in Figure 13.
minor comments (5)
- [Section V-E; Section VII] The exploratory hypotheses list Hacc, Htim, Hexp, Hint, and Hpre, but the Discussion refers to 'Hcon' ('We found no evidence for Hcon') without defining it. Please either add a hypothesis for concentration or remove the label.
- [Section VI; Figure 13] In Figure 13, the caption and legend refer to orange and grey dots for document and graph events, but the colors are not defined in the main text, and the 'How to read' description is terse. Please clarify the color mapping and the temporal axis in the figure caption.
- [Abstract; Section I] The phrase 'outperform user preference for VR-only' in the abstract is grammatically and logically awkward. It should be rephrased, for example, 'was preferred over VR-only' or 'received higher preference ratings than VR-only'.
- [Throughout] There are several typos and grammatical slips: 'a more lighter and smaller table' (Section V-C), 'V oodoo Dolls' (Section V-C), 'Hubenschimid' (Section III-C) instead of 'Hubenschmid' in the reference list, and 'Schneiderman' (Section VII) instead of 'Shneiderman' in reference [69]. Please proofread.
- [Section IV-D; Section VI] The paper states that system code is available at GitHub, which is a positive reproducibility feature. However, the interaction logs and trajectory data used for the strategy analysis are not mentioned as being released. Please consider making the anonymized logs available or at least describing their format and the criteria for event classification.
Circularity Check
No circular derivation: central PC+VR preference result rests on new behavioral measurements; self-citations to [74] are contextual, not load-bearing.
full rationale
This paper is an empirical user study rather than a derivation chain: it builds a PC+VR prototype and compares it with PC-only and VR-only using task time, accuracy, NASA-TLX, and preference ranks collected from 18 participants. The central claims (PC+VR preferred over VR-only, no significant performance difference) are supported by statistical tests on those independent measurements (e.g., overall preference chi-square(2)=6.33, p=0.0421; pairwise PC+VR vs VR-only 12/18, p=0.0333), not by any equation or fitted parameter. The paper does adapt the task and VR interface from the authors' prior work [74] (Section IV-A: 'We adapt the designs from previous work [54], [74] for the PC interface'; Section IV-B: 'we adapt the VR user interface designs from a prior work [74]'; Section V-A: 'We used the three subplots ... from previous work [74]'), but those citations supply context and a starting point; they do not define the outcome. The 'no negative impact on performance' conclusion is an inference from null p-values (time F(2,34)=1.53, p=0.230; accuracy chi-square(2)=0.426, p=0.808), and the authors themselves write in Limitations that 'We did not observe any significant results in performance in these studies, most likely due to the unfamiliarity of our conditions and limited sample size.' That is a statistical inference weakness (absence of evidence treated as evidence of equivalence), not circularity: no quantity in the result is equal by construction to an input, and no fitted parameter is renamed as a prediction. The simulated-PC fidelity concern (Section IV-C and V-C) is a validity limitation, not a circular step. Therefore the derivation is self-contained with respect to circularity, and the only self-citations are minor and non-load-bearing.
Assumptions & free parameters
free parameters (2)
- Temporal strategy threshold =
75% time in one environment
- Spatial movement thresholds =
290m user movement; 5.5m table movement
assumptions (3)
- standard math Standard statistical assumptions of repeated-measures ANOVA and Friedman tests
- domain assumption The Blue Iguanodon task and eight-document subset are representative of visual sensemaking
- ad hoc to paper Design requirements R1-R5 are valid premises for hybrid interface effectiveness
Cite this review
Pith. "Pith review of Exploring Spatial Hybrid User Interface for Visual Sensemaking." pith.science (2026). https://pith.science/paper/XSXAPWCD
@misc{pith2026250200853,
  author       = {Pith},
  title        = {Pith review of: Exploring Spatial Hybrid User Interface for Visual Sensemaking},
  year         = {2026},
  howpublished = {\url{https://pith.science/paper/XSXAPWCD}},
  note         = {Machine review of arXiv:2502.00853}
}
read the original abstract
We built a spatial hybrid system that combines a personal computer (PC) and virtual reality (VR) for visual sensemaking, addressing limitations in both environments. Although VR offers immense potential for interactive data visualization (e.g., large display space and spatial navigation), it can also present challenges such as imprecise interactions and user fatigue. At the same time, a PC offers precise and familiar interactions but has limited display space and interaction modality. Therefore, we iteratively designed a spatial hybrid system (PC+VR) to complement these two environments by enabling seamless switching between PC and VR environments. To evaluate the system's effectiveness and user experience, we compared it to using a single computing environment (i.e., PC-only and VR-only). Our study results (N=18) showed that spatial PC+VR could combine the benefits of both devices to outperform user preference for VR-only without a negative impact on performance from device switching overhead. Finally, we discussed future design implications.
Figures

Figures from the paper (10 more)


Reference graph
Works this paper leans on
-
[1]
C. Andrews, A. Endert, and C. North. Space to Think: Large High- Resolution Displays for Sensemaking. In Proc. CHI, pp. 55–64. ACM, New York, 2010. doi: 10.1145/1753326.1753336
arXiv 2010
- [2]
- [3]
-
[4]
B. Bach, R. Sicat, J. Beyer, M. Cordeil, and H. Pfister. The Hologram in My Hand: How Effective is Interactive Exploration of 3D Visualizations in Immersive Tangible Augmented Reality? IEEE Transactions on Visualization and Computer Graphics , 24(1):457–467, 2018. doi: 10. 1109/TVCG.2017.2745941
-
[5]
A. D. Balakrishnan, S. R. Fussell, and S. Kiesler. Do Visualizations Improve Synchronous Remote Collaboration? In Proc. CHI, pp. 1227–
-
[6]
R. Ball, C. North, and D. A. Bowman. Move to Improve: Promoting Physical Navigation to Increase User Performance with Large Displays. In Proc. CHI , pp. 191–200. ACM, NY , 2007. doi: 10.1145/1240624. 1240656
doi:10.1145/1240624 2007
-
[7]
D. Belcher, M. Billinghurst, S. Hayes, and R. Stiles. Using Augmented Reality for Visualizing Complex Graphs in Three Dimensions. In Proc. ISMAR, pp. 84–93. IEEE, Los Alamitos, 2003. doi: 10.1109/ISMAR. 2003.1240691
arXiv 2003
-
[8]
I. Belkacem, C. Tominski, N. M ´edoc, S. Knudsen, R. Dachselt, and M. Ghoniem. Interactive Visualization on Large High-Resolution Displays: A Survey. Computer Graphics Forum , 43(6):e15001:1– e15001:35, 2024. doi: 10.1111/cgf.15001
Show all 90 references
-
[9]
Immersed
R. Bijoy. “Immersed”. Immersed. Accessed: Mar 1, 2023. [Online.] Available: https://www.immersed.com/
2023
-
[10]
J. V . Bradley. Complete Counterbalancing of Immediate Sequential Effects in a Latin Square Design. Journal of the American Statisti- cal Association , 53(282):525–528, 1958. doi: 10.1080/01621459.1958. 10501456
1958
-
[11]
R. Brath. 3D InfoVis Is Here to Stay: Deal with It. In Proc. VIS International Workshop on 3DVis, pp. 25–31, 2014. doi: 10.1109/3DVis .2014.7160096
2014
-
[12]
S. K. Card, J. D. Mackinlay, and B. Shneiderman. Readings in information visualization: using vision to think . Morgan Kaufmann Publishers Inc., 1999
1999
-
[13]
J. Chen, H. Cai, A. P. Auchus, and D. H. Laidlaw. Effects of Stereo and Screen Size on the Legibility of Three-Dimensional Streamtube Visu- alization. IEEE Transactions on Visualization and Computer Graphics , 18(12):2130–2139, 2012. doi: 10.1109/TVCG.2012.216
2012 doi
-
[14]
Y . F. Cheng, T. Luong, A. R. Fender, P. Streli, and C. Holz. ComforTable User Interfaces: Surfaces Reduce Input Error, Time, and Exertion for Tabletop and Mid-air User Interfaces. In Proc. ISMAR , pp. 150–159,
-
[16]
Cordeil, A
M. Cordeil, A. Cunningham, T. Dwyer, B. H. Thomas, and K. Marriott. ImAxes: Immersive Axes as Embodied Affordances for Interactive Multivariate Data Visualisation. In Proc. UIST, pp. 71–83. ACM, NY ,
-
[17]
Davidson, L
K. Davidson, L. Lisle, K. Whitley, D. A. Bowman, and C. North. Exploring the Evolution of Sensemaking Strategies in Immersive Space to Think. IEEE Transactions on Visualization and Computer Graphics , 29(12):5294–5307, 2023. doi: 10.1109/TVCG.2022.3207357
2023
-
[18]
El Beheiry, S
M. El Beheiry, S. Doutreligne, C. Caporal, C. Ostertag, M. Dahan, and J.-B. Masson. Virtual Reality: Beyond Visualization. Journal of Molecular Biology, 431(7):1315–1321, 2019. doi: 10.1016/j.jmb.2019. 01.033
2019 doi
-
[19]
Endert, P
A. Endert, P. Fiaux, and C. North. Semantic Interaction for Sense- making: Inferring Analytical Reasoning for Model Steering. IEEE Transactions on Visualization and Computer Graphics , 18(12):2879– 2888, 2012. doi: 10.1109/TVCG.2012.260
2012 doi
-
[20]
B. Ens, B. Bach, M. Cordeil, U. Engelke, M. Serrano, W. Willett, A. Prouzeau, C. Anthes, W. B ¨uschel, C. Dunne, T. Dwyer, J. Grubert, J. H. Haga, N. Kirshenbaum, D. Kobayashi, T. Lin, M. Olaosebikan, F. Pointecker, D. Saffo, N. Saquib, D. Schmalstieg, D. A. Szafir, M. Whitloc...
2021 doi
-
[22]
Feiner and A
S. Feiner and A. Shamash. Hybrid User Interfaces: Breeding Virtually Bigger Interfaces for Physically Smaller Computers. In Proc. UIST, pp. 9–17. ACM, NY , 1991. doi: 10.1145/120782.120783
1991
-
[23]
J. A. W. Filho, W. Stuerzlinger, and L. Nedel. Evaluating an Immersive Space-Time Cube Geovisualization for Intuitive Trajectory Data Explo- ration. IEEE Transactions on Visualization and Computer Graphics , 26(1):514–524, 2020. doi: 10.1109/TVCG.2019.2934415
2020
-
[24]
Fonnet and Y
A. Fonnet and Y . Pri ´e. Survey of Immersive Analytics. IEEE Transac- tions on Visualization and Computer Graphics , 27(3):2101–2122, 2021. doi: 10.1109/TVCG.2019.2929033
2021
-
[25]
Fr ¨ohler, C
B. Fr ¨ohler, C. Anthes, F. Pointecker, J. Friedl, D. Schwajda, A. Riegler, S. Tripathi, C. Holzmann, M. Brunner, H. Jodlbauer, H.-C. Jetter, and C. Heinzl. A Survey on Cross-Virtuality Analytics. Computer Graphics Forum, 41(1):465–494, 2022. doi: 10.1111/cgf.14447
2022 doi
-
[26]
Grinstein, C
G. Grinstein, C. Plaisant, S. Laskowski, T. O’Connell, J. Scholtz, and M. Whiting. V AST 2007 Contest - Blue Iguanodon. In Proc. VAST, pp. 231–232. IEEE, Los Alamitos, 2007. doi: 10.1109/V AST.2007.4389032
2007
-
[27]
S. G. Hart. Nasa-Task Load Index (NASA-TLX); 20 Years Later. Proc. Hum. Factors Ergon. Soc. Annu. Meet. , 50(9):904–908, 2006. doi: 10. 1177/154193120605000909
2006
-
[28]
Hartson and P
R. Hartson and P. Pyla. The UX Book: Process and Guidelines for Ensuring a Quality User Experience . Morgan Kaufmann Publishers Inc., San Francisco, CA, USA, 1st ed., 2012
2012
-
[29]
Hayatpur, H
D. Hayatpur, H. Xia, and D. Wigdor. DataHop: Spatial Data Exploration in Virtual Reality. In Proc. UIST, pp. 818–828. ACM, NY , 2020. doi: 10.1145/3379337.3415878
2020
-
[30]
T. D. Hendrix, J. H. Cross, S. Maghsoodloo, and M. L. McKinney. Do Visualizations Improve Program Comprehensibility? Experiments with Control Structure Diagrams for Java. In Proc. SIGCSE, pp. 382–386. ACM, NY , 2000. doi: 10.1145/330908.331890
-
[31]
Horak, S
T. Horak, S. K. Badam, N. Elmqvist, and R. Dachselt. When David Meets Goliath: Combining Smartwatches with a Large Vertical Display for Visual Data Exploration. In Proc. CHI, pp. 1–13. ACM, NY , 2018. doi: 10.1145/3173574.3173593
2018
-
[32]
Hubenschmid, J
S. Hubenschmid, J. Wieland, D. I. Fink, A. Batch, J. Zagermann, N. Elmqvist, and H. Reiterer. ReLive: Bridging In-Situ and Ex-Situ Visual Analytics for Analyzing Mixed Reality User Studies. In Proc. CHI, pp. 24:1–24:20. ACM, NY , 2022. doi: 10.1145/3491102.3517550
2022
-
[33]
Hubenschmid, J
S. Hubenschmid, J. Zagermann, D. Fink, J. Wieland, T. Feuchtner, and H. Reiterer. Towards Asynchronous Hybrid User Interfaces for Cross- Reality Interaction. In Proc. ISS Workshop, 2021
2021
-
[34]
Hurter, N
C. Hurter, N. H. Riche, S. M. Drucker, M. Cordeil, R. Alligier, and R. Vuillemot. FiberClay: Sculpting Three Dimensional Trajectories to Reveal Structural Insights. IEEE Transactions on Visualization and Computer Graphics , 25(1):704–714, 2019. doi: 10.1109/TVCG.2018. 2865191
2019 doi
-
[35]
S. In, E. Krokos, K. Whitley, C. North, and Y . Yang. Evaluating Navigation and Comparison Performance of Computational Notebooks on Desktop and in Virtual Reality. In Proc. CHI , pp. 606:1–606:15. ACM, NY , 2024. doi: 10.1145/3613904.3642932
2024
-
[36]
S. In, T. Lin, C. North, H. Pfister, and Y . Yang. This is the Table I Want! Interactive Data Transformation on Desktop and in Virtual Reality. IEEE Transactions on Visualization and Computer Graphics , 30(8):5635–5650, 2024. doi: 10.1109/TVCG.2023.3299602
2024
-
[37]
Jansen, J
P. Jansen, J. Britten, A. H ¨ausele, T. Segschneider, M. Colley, and E. Rukzio. AutoVis: Enabling Mixed-Immersive Analysis of Automotive User Interface Interaction Studies. In Proc. CHI , pp. 378:1–379:23. ACM, NY , 2023. doi: 10.1145/3544548.3580760
2023
-
[39]
Klein, M
K. Klein, M. Sedlmair, and F. Schreiber. Immersive Analytics: An Overview. Information Technology, 64(4–5):155–168, 2022. doi: 10. 1515/itit-2022-0037
2022
-
[41]
Kraus, J
M. Kraus, J. Fuchs, B. Sommer, K. Klein, U. Engelke, D. Keim, and F. Schreiber. Immersive Analytics with Abstract 3D Visualizations: A Survey. Computer Graphics Forum, 41(1):201–229, 2022. doi: 10.1111/ cgf.14430
2022
-
[42]
Kraus, N
M. Kraus, N. Weiler, D. Oelke, J. Kehrer, D. A. Keim, and J. Fuchs. The Impact of Immersion on Cluster Identification Tasks. IEEE Transactions on Visualization and Computer Graphics , 26(1):525–535, 2020. doi: 10 .1109/TVCG.2019.2934395 JOURNAL OF LATEX CLASS FILES, VOL. 14, N...
2020
-
[43]
Krauß, A
V . Krauß, A. Boden, L. Oppermann, and R. Reiners. Current Practices, Challenges, and Design Implications for Collaborative AR/VR Applica- tion Development. In Proc. CHI, pp. 454:1–454:15. ACM, NY , 2021. doi: 10.1145/3411764.3445335
2021
-
[44]
O.-H. Kwon, C. Muelder, K. Lee, and K.-L. Ma. A Study of Layout, Rendering, and Interaction Methods for Immersive Graph Visualiza- tion. IEEE Transactions on Visualization and Computer Graphics , 22(7):1802–1815, 2016. doi: 10.1109/TVCG.2016.2520921
2016
-
[45]
B. Lee, R. Dachselt, P. Isenberg, and E. K. Choe. Mobile Data Visual- ization. CRC Press, NY , 1st ed., 2021. doi: 10.1201/9781003090823
2021 doi
-
[46]
J. H. Lee, D. Ma, H. Cho, and S.-H. Bae. Post-Post-it: A Spatial Ideation System in VR for Overcoming Limitations of Physical Post-it Notes. In Proc. CHI EA, pp. 300:1–300:7. ACM, NY , 2021. doi: 10.1145/3411763 .3451786
2021 doi
-
[47]
A. Li, J. Liu, M. Cordeil, J. Topliss, T. Piumsomboon, and B. Ens. GestureExplorer: Immersive Visualisation and Exploration of Gesture Data. In Proc. CHI, pp. 380:1–380:16. ACM, NY , 2023. doi: 10.1145/ 3544548.3580678
2023
-
[48]
Y . Lin, W. Kam-Kwai, Y . Wang, R. Zhang, B. Dong, H. Qu, and Q. Zheng. Taxthemis: Interactive mining and exploration of suspicious tax evasion groups. IEEE Transactions on Visualization and Computer Graphics, 27(2):849–859, 2021. doi: 10.1109/TVCG.2020.3030370
2021
-
[49]
Lisle, X
L. Lisle, X. Chen, J. Edward Gitre, C. North, and D. A. Bowman. Evaluating the Benefits of the Immersive Space to Think. In Proc. VRW, pp. 331–337. IEEE, Los Alamitos, 2020. doi: 10.1109/VRW50115.2020 .00073
2020
-
[51]
Lisle, K
L. Lisle, K. Davidson, E. J. K. Gitre, C. North, and D. A. Bowman. Different Realities: A Comparison of Augmented and Virtual Reality for the Sensemaking Process. Frontiers in Virtual Reality, 4, 2023. doi: 10.3389/frvir.2023.1177855
2023
-
[52]
J. Liu, B. Ens, A. Prouzeau, J. Smiley, I. K. Nixon, S. Goodwin, and T. Dwyer. DataDancing: An Exploration of the Design Space For Visualisation View Management for 3D Surfaces and Spaces. In Proc. CHI, pp. 379:1–379:17. ACM, NY , 2023. doi: 10.1145/3544548. 3580827
2023 doi
-
[53]
J. Liu, A. Prouzeau, B. Ens, and T. Dwyer. Effects of Display Layout on Spatial Memory for Immersive Environments. Proc. ACM Hum.-Comput. Interact., 6(ISS):576:1–576:21, Nov. 2022. doi: 10.1145/ 3567729
2022
-
[54]
Mahyar and M
N. Mahyar and M. Tory. Supporting Communication and Coordination in Collaborative Sensemaking. IEEE Transactions on Visualization and Computer Graphics , 20(12):1633–1642, 2014. doi: 10.1109/TVCG .2014.2346573
2014
-
[55]
Marriott, F
K. Marriott, F. Schreiber, T. Dwyer, K. Klein, N. H. Riche, T. Itoh, W. Stuerzlinger, and B. H. Thomas. Immersive analytics , vol. 11190. Springer, Cham, 1st ed., 2018. doi: 10.1007/978-3-030-01388-2
2018 doi
-
[56]
McGill, D
M. McGill, D. Boland, R. Murray-Smith, and S. Brewster. A Dose of Reality: Overcoming Usability Challenges in VR Head-Mounted Displays. In Proc. CHI , pp. 2143–2152. ACM, NY , 2015. doi: 10. 1145/2702123.2702382
2015
-
[57]
R. P. McMahan, D. A. Bowman, D. J. Zielinski, and R. B. Brady. Evaluating Display Fidelity and Interaction Fidelity in a Virtual Reality Game. IEEE Transactions on Visualization and Computer Graphics , 18(4):626–633, 2012. doi: 10.1109/TVCG.2012.43
2012 doi
-
[58]
Milgram, H
P. Milgram, H. Takemura, A. Utsumi, and F. Kishino. Augmented Reality: a Class of Displays on the Reality-Virtuality Continuum. In Telemanipulator and Telepresence Technologies , vol. 2351, pp. 282–
-
[59]
T. Munzner. Visualization Analysis and Design . CRC press, NY , 1st ed., 2014. doi: 10.1201/b17511
2014 doi
-
[60]
T. P. Novak, D. L. Hoffman, and Y .-F. Yung. Measuring the Customer Experience in Online Environments: A Structural Modeling Approach. Marketing Science, 19(1):22–42, Feb. 2000
2000
-
[61]
Pavanatto, C
L. Pavanatto, C. North, D. A. Bowman, C. Badea, and R. Stoakley. Do We Still Need Physical Monitors? An Evaluation of the Usability of AR Virtual Monitors for Productivity Work. In Proc. VR, pp. 759–767. IEEE, Los Alamitos, 2021. doi: 10.1109/VR50410.2021.00103
2021
-
[62]
Perer, I
A. Perer, I. Guy, E. Uziel, I. Ronen, and M. Jacovi. Visual Social Network Analytics for Relationship Discovery in the Enterprise. In Proc. VAST, pp. 71–79. IEEE, Los Alamitos, 2011. doi: 10.1109/V AST .2011.6102443
2011
-
[63]
J. S. Pierce, B. C. Stearns, and R. Pausch. V oodoo Dolls: Seamless Interaction at Multiple Scales in Virtual Environments. In Proc. I3D, pp. 141–145. ACM, NY , 1999. doi: 10.1145/300523.300540
1999
-
[64]
Pirolli and S
P. Pirolli and S. Card. The Sensemaking Process and Leverage Points for Analyst Technology as Identified through Cognitive Task Analysis. In Proceedings of International Conference on Intelligence Analysis, vol. 5, pp. 2–4, 2005
2005
-
[65]
Riegler, C
A. Riegler, C. Anthes, H.-C. Jetter, C. Heinzl, C. Holzmann, H. Jodl- bauer, M. Brunner, S. Auer, J. Friedl-Knirsch, B. Fr ¨ohler, C. Leitner, F. Pointecker, D. Schwajda, and S. Tripathi. Cross-Virtuality Visualiza- tion, Interaction and Collaboration. In Cross-Reality (XR) In...
2020
-
[66]
Saffo, A
D. Saffo, A. Batch, C. Dunne, and N. Elmqvist. Through Their Eyes and In Their Shoes: Providing Group Awareness During Collaboration Across Virtual Reality and Desktop Platforms. In Proc. CHI, pp. 383:1– 383:15. ACM, NY , 2023. doi: 10.1145/3544548.3581093
2023
-
[67]
K. A. Satriadi, B. Ens, M. Cordeil, T. Czauderna, and B. Jenny. Maps Around Me: 3D Multiview Layouts in Immersive Spaces. Proc. HCI, 4(ISS):201:1–201:20, Nov. 2020. doi: 10.1145/3427329
2020 doi
-
[68]
M. R. Seraji, P. Piray, V . Zahednejad, and W. Stuerzlinger. Analyzing User Behaviour Patterns in a Cross-Virtuality Immersive Analytics System. IEEE Transactions on Visualization and Computer Graphics , 30(5):2613–2623, 2024. doi: 10.1109/TVCG.2024.3372129
2024
-
[69]
Shneiderman
B. Shneiderman. The Eyes Have It: A Task by Data Type Taxonomy for Information Visualizations. In Proc. VL, pp. 336–343. IEEE, Los Alamitos, 1996. doi: 10.1109/VL.1996.545307
1996
-
[70]
Skarbez, N
R. Skarbez, N. F. Polys, J. T. Ogle, C. North, and D. A. Bowman. Immersive Analytics: Theory and Research Agenda. Frontiers in Robotics and AI , 6, 2019. doi: 10.3389/frobt.2019.00082
2019
-
[71]
Speicher, A
M. Speicher, A. M. Feit, P. Ziegler, and A. Kr ¨uger. Selection-based Text Entry in Virtual Reality. In Proc. CHI, pp. 1–13. ACM, NY , 2018. doi: 10.1145/3173574.3174221
2018
-
[72]
S. Suh, B. Min, S. Palani, and H. Xia. Sensecape: Enabling Multilevel Exploration and Sensemaking with Large Language Models. In Proc. UIST, pp. 1:1–1:18. ACM, NY , 2023. doi: 10.1145/3586183.3606756
2023
-
[73]
W. Tong, Z. Chen, M. Xia, L. Y .-H. Lo, L. Yuan, B. Bach, and H. Qu. Exploring Interactions with Printed Data Visualizations in Augmented Reality. IEEE Transactions on Visualization and Computer Graphics , 29(1):418–428, 2023. doi: 10.1109/TVCG.2022.3209386
2023
-
[74]
W. Tong, M. Xia, K. K. Wong, D. A. Bowman, T.-C. Pong, H. Qu, and Y . Yang. Towards an Understanding of Distributed Asymmetric Collaborative Visualization on Problem-solving. In Proc. VR, pp. 387–
-
[75]
J. A. Wagner Filho, M. F. Rey, C. M. D. S. Freitas, and L. Nedel. Immersive Visualization of Abstract Information: An Evaluation on Dimensionally-Reduced Data Scatterplots. In Proc. VR, pp. 483–490. IEEE, Los Alamitos, 2018. doi: 10.1109/VR.2018.8447558
2018
-
[76]
X. Wang, L. Besanc ¸on, D. Rousseau, M. Sereno, M. Ammi, and T. Isen- berg. Towards an Understanding of Augmented Reality Extensions for Existing 3D Data Analysis Tools. In Proc. CHI, pp. 1–13. ACM, NY ,
-
[77]
X. Wang, L. Besanc ¸on, M. Ammi, and T. Isenberg. Understanding Differences Between Combinations of 2D and 3D Input and Output Devices for 3D Data Visualization. International Journal of Human- Computer Studies, 163:102820, 2022. doi: 10.1016/j.ijhcs.2022.102820
2022
-
[78]
Ware and P
C. Ware and P. Mitchell. Reevaluating Stereo and Motion Cues for Visualizing Graphs in Three Dimensions. In Proc. APGV, pp. 51–58. ACM, NY , 2005. doi: 10.1145/1080402.1080411
2005
-
[79]
M. A. Whiting, C. North, A. Endert, J. Scholtz, J. Haack, C. Varley, and J. Thomas. V AST Contest Dataset Use in Education. In Proc. VAST, pp. 115–122. IEEE, Los Alamitos, 2009. doi: 10.1109/V AST.2009.5333245
2009
-
[80]
Whitlock, S
M. Whitlock, S. Smart, and D. A. Szafir. Graphical Perception for Immersive Analytics. In Proc. VR, pp. 616–625. IEEE, Los Alamitos,
-
[81]
F. Yang, J. Qian, J. Novotny, D. Badre, C. D. Jackson, and D. H. Laidlaw. A Virtual Reality Memory Palace Variant Aids Knowledge Retrieval from Scholarly Articles. IEEE Transactions on Visualization and Computer Graphics , 27(12):4359–4373, 2021. doi: 10.1109/TVCG .2020.3009003
2021
-
[82]
Y . Yang, M. Cordeil, J. Beyer, T. Dwyer, K. Marriott, and H. Pfister. Embodied Navigation in Immersive Abstract Data Visualization: Is Overview+Detail or Zooming Better for 3D Scatterplots? IEEE Transac- tions on Visualization and Computer Graphics , 27(2):1214–1224, 2021. do...
2021
-
[83]
Y . Yang, T. Dwyer, B. Jenny, K. Marriott, M. Cordeil, and H. Chen. Origin-Destination Flow Maps in Immersive Environments. IEEE JOURNAL OF LATEX CLASS FILES, VOL. 14, NO. 8, AUGUST 2021 16 Transactions on Visualization and Computer Graphics , 25(1):693–703,
2021
-
[84]
Y . Yang, T. Dwyer, K. Marriott, B. Jenny, and S. Goodwin. Tilt Map: Interactive Transitions Between Choropleth Map, Prism Map and Bar Chart in Immersive Environments. IEEE Transactions on Visualization and Computer Graphics , 27(12):4507–4519, 2021. doi: 10.1109/TVCG .2020.3004137
2021
-
[85]
Y . Yang, T. Dwyer, Z. Swiecki, B. Lee, M. Wybrow, M. Cordeil, T. Wulandari, B. H. Thomas, and M. Billinghurst. Putting Our Minds Together: Iterative Exploration for Collaborative Mind Mapping. In Proc. AHs , pp. 255–258. ACM, NY , 2024. doi: 10.1145/3652920. 3653043
2024 doi
-
[86]
Y . Yang, B. Jenny, T. Dwyer, K. Marriott, H. Chen, and M. Cordeil. Maps and Globes in Virtual Reality. Computer Graphics Forum , 37(3):427–438, 2018. doi: 10.1111/cgf.13431
2018 doi
-
[87]
doi: 10.1109/VR46266.2020.00084
2020
-
[95]
X. Zhou, A. U. Batmaz, A. S. Williams, D. Schreiber, and F. R. Ortega. I Did Not Notice: A Comparison of Immersive Analytics with Augmented and Virtual Reality. In Proc. CHI EA, pp. 193:1–193:7. ACM, NY , 2024. doi: 10.1145/3613905.3651085 Wai Tong is an assistant professor in...
2024
-
[292]
doi: 10.1117/12.197321
International Society for Optics and Photonics, SPIE, 1995. doi: 10.1117/12.197321
1995 doi
-
[397]
doi: 10.1109/VR55154.2023.00054
IEEE, Los Alamitos, 2023. doi: 10.1109/VR55154.2023.00054
2023
-
[1236]
doi: 10.1145/1357054.1357246
ACM, NY , 2008. doi: 10.1145/1357054.1357246
2008
-
[2017]
doi: 10.1145/3126594.3126613
-
[2019]
doi: 10.1109/TVCG.2018.2865192
2018
-
[2020]
doi: 10.1145/3313831.3376657
-
[2022]
doi: 10.1109/ISMAR55827.2022.00029
2022
Reviewed August 9, 2026 · model on record in the stance chip above.
Discussion (0). Continue with ORCID to comment.