REVIEW 3 major objections 4 minor 88 references
DIISC -- VI (COS-DIISC): UV Metal Absorption Relative to the H I disk of Galaxies
T0 review · 3 major / 4 minor · reviewed 2026-08-09 · deepseek-v4-flash
Pith's one-line read The paper claims that low- and mid-ionization metals in galaxy halos are organized by the H I disk radius, not the virial radius, based on UV absorption toward 30 background quasars.
desk verdict A useful new sample of H I-selected CGM absorbers, but the headline R_HI-vs-R_vir claim is not yet established by the statistics presented. read the letter →
The pith
A machine-rendered reading of the paper's core claim, the machinery that carries it, and where it could break.
The reading
What carries the argument
The load-bearing object is the normalized impact parameter $\rho / R_{\mathrm{HI}}$, where $R_{\mathrm{HI}}$ is the radius at which the H I column density reaches $1\ M_\odot\,\mathrm{pc}^{-2}$, derived from the adopted H I mass-to-radius relation using ALFALFA and HIPASS H I masses. Because the sample was selected to place background QSOs within roughly $3.5\,R_{\mathrm{HI}}$, the survey can separate radial trends in the disk frame from those in the halo frame. The argument is carried by comparing rest-frame equivalent widths, component counts, and covering fractions as functions of $\rho / R_{\mathrm{HI}}$, $\rho / R_{\mathrm{vir}}$, and $\rho / R_{\mathrm{pet},r}$, complemented by photoionization (CLOUDY) and collisional ionization models used to interpret component densities and cloud lengths.
What would settle it
Map the H I in the 31 galaxies directly at 21 cm and recompute each $R_{\mathrm{HI}}$ at the $1\ M_\odot\,\mathrm{pc}^{-2}$ isophote. If the $\rho / R_{\mathrm{HI}}$ trends in equivalent width, component count, and covering fraction become noisy or disappear while the $\rho / R_{\mathrm{vir}}$ trends survive, the central claim would fail. A complementary check is to compare sight lines with the same $\rho / R_{\mathrm{HI}}$ but very different $\rho / R_{\mathrm{vir}}$: the claim predicts their absorption strengths should match.
Extended reading notes
Core claim
Across 30 QSO sight lines probing 31 galaxies at $z \approx 0.002{-}0.05$ within $4.5\,R_{\mathrm{HI}}$, Si III $\lambda1206$ is detected in 18 of 31 sight lines, C II $\lambda1334$ in 17, and Si II $\lambda1260$ in 15, with all Si III nondetections beyond roughly $2.5\,R_{\mathrm{HI}}$. The paper's central claim is that the radial decline of rest-frame equivalent width, component count, and covering fraction for these ions is more strongly correlated with $\rho / R_{\mathrm{HI}}$ than with $\rho / R_{\mathrm{vir}}$. Sight lines closer to the H I disk show more components and larger $W_r$, and the authors conclude that distance from the H I disk, not virial-radius-normalized distance, is the better predictor of cool metal absorption in the inner CGM.
Load-bearing premise
Every radial comparison is normalized by $R_{\mathrm{HI}}$, but $R_{\mathrm{HI}}$ is not directly measured for most galaxies; it is inferred from H I mass through a mass-to-radius relation, so if those inferred disk sizes are systematically off, the conclusion that $\rho / R_{\mathrm{HI}}$ is the better tracer is weakened.
Editorial extensions
If this is right
- Within the inner CGM, sight lines with $\rho \lesssim 2.5\,R_{\mathrm{HI}}$ should contain Si III, C II, and Si II absorption in the majority of cases, while nondetections should dominate beyond that radius.
- Absorber strength, measured by rest-frame equivalent width, and the number of resolved components both rise toward the H I disk, so galaxies with larger H I disks should show stronger metal absorption at a fixed physical impact parameter.
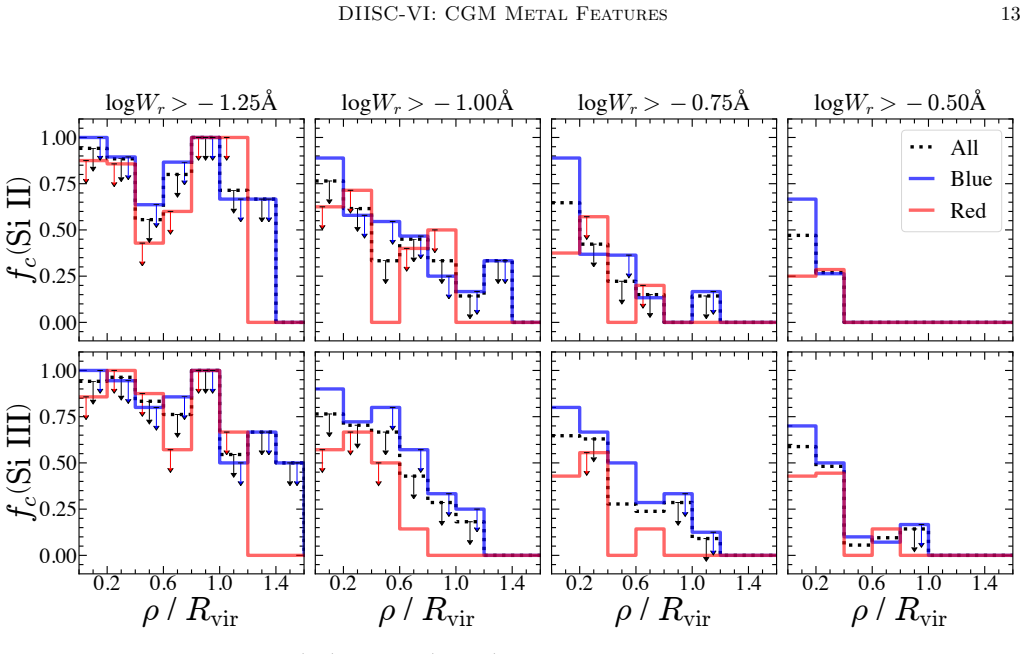
- Covering fractions of Si II and Si III decline outward, and the decline steepens when only stronger absorbers are counted; star-forming galaxies have higher covering fractions than passive galaxies.
- Most detected components are consistent with photoionization equilibrium, with cold and cool clouds typically smaller than 1-2 kpc and warm clouds mostly smaller than 10 kpc.
- In the combined sample of the three surveys used here, few metals are detected beyond about $0.7\,R_{\mathrm{vir}}$, and upper limits populate the full $\rho / R_{\mathrm{vir}}$ range, unlike the sharp decline seen in $\rho / R_{\mathrm{HI}}$.
Reading between the lines
- If the $R_{\mathrm{HI}}$ scaling holds, simulations of galaxy formation should compare their circumgalactic metal content against $\rho / R_{\mathrm{HI}}$ rather than $\rho / R_{\mathrm{vir}}$, which would be a stiffer test of feedback and gas accretion models.
- Because the DIISC sample was itself selected on $R_{\mathrm{HI}}$, the sharper $R_{\mathrm{HI}}$ trends could be partly a selection artifact; only an unbiased sample selected on other galaxy properties can cleanly separate the two normalizations.
- The claim is made for ions with ionization potentials up to 33.5 eV; whether higher-ionization phases such as O VI trace $R_{\mathrm{HI}}$ remains open, and the paper's own stacking shows O I, Si IV, and N V have much lower covering fractions than C II and Si III.
- A sharp testable prediction is that two galaxies with similar $R_{\mathrm{HI}}$ but very different halo masses should show comparable Si II, C II, and Si III absorption at the same $\rho / R_{\mathrm{HI}}$, even though their $\rho / R_{\mathrm{vir}}$ values differ.
Editorial analysis
A structured set of objections, weighed in public.
Referee Report
Summary. The paper presents COS G130M spectra of 31 nearby galaxies from the DIISC survey and measures UV metal absorption (O I, Si II, Si III, Si IV, C II, N V) in the inner CGM at impact parameters within ~4.5 R_HI. The authors report detection statistics, Voigt-profile components, Doppler widths, velocity dispersions, equivalent widths, covering fractions, and a first-pass CLOUDY photoionization analysis. The central claim is that the radial distribution of low- and intermediate-ionization metals is better traced by rho / R_HI than by rho / R_vir, based on visual comparison of equivalent-width versus radius diagrams and one statistically significant Kendall tau for C II. The paper is careful to list limitations of the ionization modeling and positions the PIE/CIE analysis as an initial constraint.
Significance. If the central claim is correct, it would reframe how CGM metal surveys should normalize impact parameters in the inner CGM: the H I disk scale of the galaxy, rather than the virial radius, would be the relevant metric for low- and intermediate-ionization absorbers. The paper's strengths are its clearly defined sample, detailed Voigt-profile measurements, explicit treatment of upper limits, and transparent caveats about the CLOUDY modeling. The radial measurements themselves are direct and not circular with the model fitting. However, the headline claim currently rests on a visual reading of two figures and a single marginally significant correlation statistic, so the quantitative basis is not yet commensurate with the strength of the conclusion.
major comments (3)
- [Section 3.2, Figures 7 and 8, Summary point 2] The central claim that metals are better traced by rho / R_HI than by rho / R_vir is based on a visual contrast: in Figure 7, Si III and other nondetections appear only beyond about 2.5 R_HI, while in Figure 8 upper limits appear across the entire rho / R_vir range. This comparison is not a controlled test of the two normalizations because Figure 7 uses only COS-DIISC data whereas Figure 8 combines COS-DIISC, COS-GASS, and COS-Halos. In addition, the DIISC survey selected sight lines within about 3.5 R_HI (Section 2.1), so the apparent absence of nondetections at small rho / R_HI is partly a consequence of the survey design. No formal model comparison, detection-rate test, or selection-function correction is presented. Please quantify the claim, for example by comparing detection/non-detection fractions as a function of each normalized radius within the same sample, or by fitting W_r versus radius with an explicit treatment of upper limits and the R_HI-based target selection.
- [Section 2.1 and Table 1] R_HI, the normalizing scale on which the main conclusion rests, is not directly measured for most galaxies. It is derived from the H I mass-to-radius relation of Swaters et al. (2002), as stated in the Table 1 note. If these radii carry systematic errors, the apparent sharp boundary near 2.5 R_HI could be an artifact of the adopted relation. The paper would be substantially strengthened by a sensitivity analysis: using directly measured H I radii for the subset of galaxies where they are available, propagating the scatter of the Swaters relation through the Kendall tau and detection-fraction tests, or demonstrating that the conclusion is robust to plausible R_HI perturbations.
- [Section 3.1 and Figure 4] The only statistically significant radial trend favoring R_HI over R_vir is the C II sigma_LOS correlation: tau = -0.48 with p = 0.031 for rho / R_HI versus tau = -0.33 with p = 0.153 for rho / R_vir. Because several ions and two normalizations are examined, this p-value should be corrected for multiple comparisons or supported by an additional independent statistic. Furthermore, sigma_LOS excludes sight lines with a single component, which may bias the correlation if single-component sight lines are preferentially located at larger or smaller radii. This one correlation, together with the visual argument in Figures 7 and 8, is not by itself sufficient to establish the paper's headline conclusion.
minor comments (4)
- [Throughout] There are several typos and minor grammatical errors: 'prevelent' should be 'prevalent' (Section 1), 'dominate' should be 'dominant' (Summary point 4), 'determines' should be 'determined' (Section 3.4), 'investigate' should be 'investigated' (Summary), and 'ALF ALF A' appears with an extra space in Section 2.1.
- [Figure 7] The bottom panels show rho / R_pet,r but the caption does not describe the meaning of the downward arrows or the symbol types, and the text does not quantify the difference between the top and bottom rows. At minimum, define the upper-limit notation in the caption and state the number of detections and nondetections in each panel.
- [Section 3.2] The sentence 'These distributions are not consistent from the radial density distribution of a Navarro-Frenk-White dark matter halo' should read 'not consistent with'. The NFW comparison itself is qualitative; please state whether any quantitative goodness-of-fit was computed.
- [Section 3.4] The cloud-length estimate is obtained from N(H)/n(H) using the model total hydrogen column, so the derived lengths depend directly on the assumed N(H I) and metallicity grid. The paper explicitly calls these upper limits, but it would help to state in the text that the lengths are model-dependent quantities, not direct measurements.
Circularity Check
No significant circularity; the radial claim rests on direct measurements, with only minor non-load-bearing self-citations.
full rationale
The paper's central claim, that metals are better traced by rho/R_HI than rho/R_vir, is based on direct measurements of rest-frame equivalent widths and detection/nondetection patterns as functions of impact parameter normalized by two independently defined galaxy radii (Section 3.2, Figures 7 and 8). No parameter is fitted to this trend; R_HI is an external galaxy property derived from ALFALFA/HIPASS H I masses via the Swaters et al. (2002) relation, not from the CGM absorption data. The CLOUDY photoionization analysis fits a grid of density, metallicity, and H I column to reproduce observed ionic columns, but the resulting cloud lengths are explicitly presented as a first-pass model interpretation, not as a prediction of the radial claim, and the paper disclaims their robustness (Section 3.4). Self-citations (Borthakur et al. 2024 for Ly alpha and H I columns; Padave et al. 2023 for sSFR; Koplitz et al. 2023 for sigma_LOS interpretation) supply inputs or context but are not the load-bearing evidence for the headline conclusion. Potential concerns such as the sample selection truncated at <3.5 R_HI and the use of derived rather than measured H I radii affect the strength of the comparison but are not definitional circularity. The derivation chain is therefore self-contained for the central claim.
Assumptions & free parameters
free parameters (4)
- Total hydrogen density n(H) grid =
log n(H)/cm^-3 from -5.00 to 0.00 in 0.25 dex steps
- Metallicity Z =
0.04, 0.30, 0.50, 1.00 solar
- H I column density log N(HI) =
Varied in 0.2 dex steps over per-system ranges (e.g., 14.0 to 18.0)
- Milky Way radiation field distance =
10, 50, or 100 kpc chosen per sight line
assumptions (6)
- domain assumption Absorbers within +-600 km/s of the galaxy's systemic velocity are associated with the target galaxy.
- ad hoc to paper The three-phase assignment (O I and Si II cold; C II and Si III cool; Si IV and N V warm) is a valid decomposition of the CGM.
- domain assumption Photoionization equilibrium is the relevant framework for interpreting the metal ratios.
- domain assumption Solar relative abundances and no dust depletion apply to all sight lines.
- domain assumption The H I radius from the Swaters et al. relation and ALFALFA and HIPASS represents the true neutral gas disk size.
- domain assumption The nearest and most massive galaxy at the same redshift is the source of absorption when systems overlap.
Cite this review
Pith. "Pith review of DIISC -- VI (COS-DIISC): UV Metal Absorption Relative to the H I disk of Galaxies." pith.science (2026). https://pith.science/paper/RN25EBTY
@misc{pith2026250202583,
  author       = {Pith},
  title        = {Pith review of: DIISC -- VI (COS-DIISC): UV Metal Absorption Relative to the H I disk of Galaxies},
  year         = {2026},
  howpublished = {\url{https://pith.science/paper/RN25EBTY}},
  note         = {Machine review of arXiv:2502.02583}
}
abstract
As part of the Deciphering the Interplay between the Interstellar medium, Stars, and the Circumgalactic medium (DIISC) survey, we present the UV metal absorption features in the Circumgalactic Medium (CGM) near the H I gas disk ($<$4.5$R_\mathrm{HI}$) of 31 nearby galaxies through quasar absorption line spectroscopy. Of the ions under study, Si III $\lambda1206$ was most frequently detected (18 of 31 sight lines), while C II $\lambda1334$ and Si II $\lambda1260$ were detected in 17 and 15 of 31 sight lines, respectively. Many components were consistent with photoionization equilibrium models, most of the cold and cool gas phase clouds were found to have lengths smaller than 2 kpc. Sight lines with smaller impact parameters ($\rho$) normalized by the galaxy's virial radius ($R_\mathrm{vir}$) and H I radius ($R_\mathrm{HI}$) tend to have more components and larger rest-frame equivalent widths ($W_r$) than those that probe the CGM at larger radii. In particular, we find that the location of metals are better traced by $\rho$ / $R_\mathrm{HI}$ rather than the traditional $\rho$ / $R_\mathrm{vir}$. Larger covering fractions are found closer to galaxies, with a radial decline that depends on the $W_r$ limit used. Our results provide new insights into the spatial distribution of metals around the H I disks of low-redshift galaxies.
Figures


Figures from the paper (12 more)




Reference graph
Works this paper leans on
-
[1]
2021, MNRAS, 507, 2383, doi: 10.1093/mnras/stab2310
Smith, B. 2021, MNRAS, 507, 2383, doi: 10.1093/mnras/stab2310
-
[2]
Asplund, M., Grevesse, N., Sauval, A. J., & Scott, P. 2009, ARA&A, 47, 481, doi: 10.1146/annurev.astro.46.060407.145222 Astropy Collaboration, Robitaille, T. P., Tollerud, E. J., et al. 2013, A&A, 558, A33, doi: 10.1051/0004-6361/201322068 Astropy Collaboration, Price-Whelan, A. M., Sip˝ ocz, B. M., et al. 2018, AJ, 156, 123, doi: 10.3847/1538-3881/aabc4f
arXiv 2009
-
[3]
Behroozi, P. S., Conroy, C., & Wechsler, R. H. 2010, ApJ, 717, 379, doi: 10.1088/0004-637X/717/1/379
-
[4]
Bordoloi, R., Tumlinson, J., Werk, J. K., et al. 2014, ApJ, 796, 136, doi: 10.1088/0004-637X/796/2/136
-
[5]
2015, ApJ, 813, 46, doi: 10.1088/0004-637X/813/1/46 —
Borthakur, S., Heckman, T., Tumlinson, J., et al. 2015, ApJ, 813, 46, doi: 10.1088/0004-637X/813/1/46 —. 2016, ApJ, 833, 259, doi: 10.3847/1538-4357/833/2/259
-
[6]
2024, arXiv e-prints, arXiv:2409.12554, doi: 10.48550/arXiv.2409.12554
Borthakur, S., Padave, M., Heckman, T., et al. 2024, arXiv e-prints, arXiv:2409.12554, doi: 10.48550/arXiv.2409.12554
-
[7]
Bowen, D. V., Chelouche, D., Jenkins, E. B., et al. 2016, ApJ, 826, 50, doi: 10.3847/0004-637X/826/1/50
-
[8]
Burchett, J. N., Tripp, T. M., Wang, Q. D., et al. 2018, MNRAS, 475, 2067, doi: 10.1093/mnras/stx3170
Show all 88 references
-
[9]
N., Tripp, T
Burchett, J. N., Tripp, T. M., Prochaska, J. X., et al. 2019, ApJL, 877, L20, doi: 10.3847/2041-8213/ab1f7f
2019 doi
-
[10]
2023, RMxAA, 59, 327, doi: 10.22201/ia.01851101p.2023.59.02.12
Chatzikos, M., Bianchi, S., Camilloni, F., et al. 2023, RMxAA, 59, 327, doi: 10.22201/ia.01851101p.2023.59.02.12
2023 doi
-
[11]
E., Gauthier, J.-R., et al
Chen, H.-W., Helsby, J. E., Gauthier, J.-R., et al. 2010, ApJ, 714, 1521, doi: 10.1088/0004-637X/714/2/1521
2010 doi
- [12]
-
[13]
S., Boettcher, E., et al
Chen, H.-W., Zahedy, F. S., Boettcher, E., et al. 2020, MNRAS, 497, 498, doi: 10.1093/mnras/staa1773
2020 doi
-
[14]
Kacprzak, G. G. 2013, ApJ, 779, 87, doi: 10.1088/0004-637X/779/1/87
2013 doi
-
[15]
J., Rudie, G
Cooper, T. J., Rudie, G. C., Chen, H.-W., et al. 2021, MNRAS, 508, 4359, doi: 10.1093/mnras/stab2869
2021 doi
- [16]
-
[17]
J., Crain, R
Davies, J. J., Crain, R. A., Oppenheimer, B. D., & Schaye, J. 2020, MNRAS, 491, 4462, doi: 10.1093/mnras/stz3201
2020 doi
- [18]
-
[19]
2006, MNRAS, 368, 2, doi: 10.1111/j.1365-2966.2006.10145.x
Dekel, A., & Birnboim, Y. 2006, MNRAS, 368, 2, doi: 10.1111/j.1365-2966.2006.10145.x
2006
-
[20]
2009, Nature, 457, 451, doi: 10.1038/nature07648
Dekel, A., Birnboim, Y., Engel, G., et al. 2009, Nature, 457, 451, doi: 10.1038/nature07648
2009 doi
-
[21]
Donahue, M., & Voit, G. M. 2022, PhR, 973, 1, doi: 10.1016/j.physrep.2022.04.005 Faucher-Gigu` ere, C.-A., Feldmann, R., Quataert, E., et al. 2016, MNRAS, 461, L32, doi: 10.1093/mnrasl/slw091
2022 doi
-
[22]
W., Morris, S
Finn, C. W., Morris, S. L., Tejos, N., et al. 2016, MNRAS, 460, 590, doi: 10.1093/mnras/stw918
2016 doi
-
[23]
J., Savage, B
Fox, A. J., Savage, B. D., Wakker, B. P., et al. 2004, ApJ, 602, 738, doi: 10.1086/381024
2004 doi
-
[24]
J., Wakker, B
Fox, A. J., Wakker, B. P., Savage, B. D., et al. 2005, ApJ, 630, 332, doi: 10.1086/431915
2005 doi
-
[25]
B., Borthakur, S., Momjian, E., et al
Gim, H. B., Borthakur, S., Momjian, E., et al. 2021, ApJ, 922, 69, doi: 10.3847/1538-4357/ac2303
2021 doi
-
[26]
P., Kent, B
Giovanelli, R., Haynes, M. P., Kent, B. R., et al. 2005, AJ, 130, 2598, doi: 10.1086/497431
2005 doi
-
[27]
2007, ApJS, 168, 213, doi: 10.1086/509786
Gnat, O., & Sternberg, A. 2007, ApJS, 168, 213, doi: 10.1086/509786
2007 doi
-
[28]
C., Froning, C
Green, J. C., Froning, C. S., Osterman, S., et al. 2012, ApJ, 744, 60, doi: 10.1088/0004-637X/744/1/60
2012 doi
-
[29]
2012, ApJ, 746, 125, doi: 10.1088/0004-637X/746/2/125
Haardt, F., & Madau, P. 2012, ApJ, 746, 125, doi: 10.1088/0004-637X/746/2/125
2012 doi
-
[30]
2022, MNRAS, 514, 5056, doi: 10.1093/mnras/stac1603
Hafen, Z., Stern, J., Bullock, J., et al. 2022, MNRAS, 514, 5056, doi: 10.1093/mnras/stac1603
2022 doi
-
[31]
J., Tripp, T
Haislmaier, K. J., Tripp, T. M., Katz, N., et al. 2021, MNRAS, 502, 4993, doi: 10.1093/mnras/staa3544
2021 doi
-
[32]
R., Millman, K
Harris, C. R., Millman, K. J., van der Walt, S. J., et al. 2020, Nature, 585, 357, doi: 10.1038/s41586-020-2649-2
2020 doi
-
[33]
P., Giovanelli, R., Kent, B
Haynes, M. P., Giovanelli, R., Kent, B. R., et al. 2018, ApJ, 861, 49, doi: 10.3847/1538-4357/aac956
2018 doi
-
[34]
2017, ApJ, 846, 151, doi: 10.3847/1538-4357/aa80dc
Bordoloi, R. 2017, ApJ, 846, 151, doi: 10.3847/1538-4357/aa80dc
2017 doi
-
[35]
H., Martin, C
Ho, S. H., Martin, C. L., Kacprzak, G. G., & Churchill, C. W. 2017, ApJ, 835, 267, doi: 10.3847/1538-4357/835/2/267
2017 doi
-
[36]
Hunter, J. D. 2007, Computing in Science and Engineering, 9, 90, doi: 10.1109/MCSE.2007.55
2007 doi
-
[37]
I., Schaerer, D., Worseck, G., et al
Izotov, Y. I., Schaerer, D., Worseck, G., et al. 2023, MNRAS, 522, 1228, doi: 10.1093/mnras/stad1036
2023 doi
-
[38]
G., Churchill, C
Kacprzak, G. G., Churchill, C. W., Evans, J. L., Murphy, M. T., & Steidel, C. C. 2011, MNRAS, 416, 3118, doi: 10.1111/j.1365-2966.2011.19261.x DIISC-VI: CGM Metal Features 19
2011
-
[39]
2016, MNRAS, 462, 3751, doi: 10.1093/mnras/stw1950
Kauffmann, G., Borthakur, S., & Nelson, D. 2016, MNRAS, 462, 3751, doi: 10.1093/mnras/stw1950
2016 doi
-
[40]
A., Stocke, J
Keeney, B. A., Stocke, J. T., Rosenberg, J. L., et al. 2013, ApJ, 765, 27, doi: 10.1088/0004-637X/765/1/27
2013 doi
-
[41]
A., Stocke, J
Keeney, B. A., Stocke, J. T., Danforth, C. W., et al. 2017, ApJS, 230, 6, doi: 10.3847/1538-4365/aa6b59 Kereˇ s, D., Katz, N., Weinberg, D. H., & Dav´ e, R. 2005, MNRAS, 363, 2, doi: 10.1111/j.1365-2966.2005.09451.x
2017
-
[42]
V., Kulkarni, V., Wake, D
Klimenko, V. V., Kulkarni, V., Wake, D. A., et al. 2023, ApJ, 954, 115, doi: 10.3847/1538-4357/ace329
2023 doi
-
[43]
2023, ApJ, 956, 54, doi: 10.3847/1538-4357/acf4fc
Koplitz, B., , Edward Buie, I., & Scannapieco, E. 2023, ApJ, 956, 54, doi: 10.3847/1538-4357/acf4fc
2023 doi
- [44]
-
[45]
C., & Wakker, B
Lehner, N., Howk, J. C., & Wakker, B. P. 2015, ApJ, 804, 79, doi: 10.1088/0004-637X/804/2/79
2015 doi
-
[46]
C., Tripp, T
Lehner, N., Howk, J. C., Tripp, T. M., et al. 2013, ApJ, 770, 138, doi: 10.1088/0004-637X/770/2/138
2013 doi
-
[47]
C., Howk, J
Lehner, N., Berek, S. C., Howk, J. C., et al. 2020, ApJ, 900, 9, doi: 10.3847/1538-4357/aba49c
2020 doi
-
[48]
J., & Chen, H.-W
Liang, C. J., & Chen, H.-W. 2014, MNRAS, 445, 2061, doi: 10.1093/mnras/stu1901
2014 doi
-
[49]
Machado, R. E. G., Tissera, P. B., Lima Neto, G. B., & Sodr´ e, L. 2018, A&A, 609, A66, doi: 10.1051/0004-6361/201628886
2018 doi
-
[51]
2018, MNRAS, 476, 4965, doi: 10.1093/mnras/sty529
Muzahid, S., Fonseca, G., Roberts, A., et al. 2018, MNRAS, 476, 4965, doi: 10.1093/mnras/sty529
2018 doi
-
[52]
F., Frenk, C
Navarro, J. F., Frenk, C. S., & White, S. D. M. 1996, ApJ, 462, 563, doi: 10.1086/177173
1996 doi
-
[53]
2020, MNRAS, 498, 2391, doi: 10.1093/mnras/staa2419
Nelson, D., Sharma, P., Pillepich, A., et al. 2020, MNRAS, 498, 2391, doi: 10.1093/mnras/staa2419
2020 doi
-
[54]
M., Churchill, C
Nielsen, N. M., Churchill, C. W., & Kacprzak, G. G. 2013, ApJ, 776, 115, doi: 10.1088/0004-637X/776/2/115
2013 doi
-
[55]
M., Kacprzak, G
Nielsen, N. M., Kacprzak, G. G., Pointon, S. K., Churchill, C. W., & Murphy, M. T. 2018, ApJ, 869, 153, doi: 10.3847/1538-4357/aaedbd
2018 doi
-
[56]
2011, Ap&SS, 335, 257, doi: 10.1007/s10509-011-0699-5
Osterman, S., Green, J., Froning, C., et al. 2011, Ap&SS, 335, 257, doi: 10.1007/s10509-011-0699-5
2011 doi
- [57]
- [58]
-
[59]
X., Werk, J
Prochaska, J. X., Werk, J. K., Worseck, G., et al. 2017, ApJ, 837, 169, doi: 10.3847/1538-4357/aa6007
2017 doi
-
[60]
C., et al
Qu, Z., Chen, H.-W., Rudie, G. C., et al. 2022, MNRAS, 516, 4882, doi: 10.1093/mnras/stac2528 —. 2023, MNRAS, 524, 512, doi: 10.1093/mnras/stad1886
2022 doi
-
[61]
2018, in COS Data Handbook, 4
Rafelski, M., & et al. 2018, in COS Data Handbook, 4
2018
-
[62]
2021, pandas-dev/pandas: Pandas 1.3.5, v1.3.5, Zenodo, Zenodo, doi: 10.5281/zenodo.5774815
Reback, J., Jbrockmendel, McKinney, W., et al. 2021, pandas-dev/pandas: Pandas 1.3.5, v1.3.5, Zenodo, Zenodo, doi: 10.5281/zenodo.5774815
2021 doi
-
[63]
P., Fechner, C., et al
Richter, P., Wakker, B. P., Fechner, C., et al. 2016, A&A, 590, A68, doi: 10.1051/0004-6361/201527038
2016 doi
-
[64]
R., Charlton, J
Rigby, J. R., Charlton, J. C., & Churchill, C. W. 2002, ApJ, 565, 743, doi: 10.1086/324723
2002 doi
-
[65]
C., Steidel, C
Rudie, G. C., Steidel, C. C., Trainor, R. F., et al. 2012, ApJ, 750, 67, doi: 10.1088/0004-637X/750/1/67
2012 doi
-
[66]
C., Wakker, B
Sameer, Charlton, J. C., Wakker, B. P., et al. 2024, MNRAS, 530, 3827, doi: 10.1093/mnras/stae962
2024 doi
- [67]
-
[68]
2012, ApJ, 760, 50, doi: 10.1088/0004-637X/760/1/50
Shen, S., Madau, P., Aguirre, A., et al. 2012, ApJ, 760, 50, doi: 10.1088/0004-637X/760/1/50
2012 doi
-
[69]
S., & Dav´ e, R
Somerville, R. S., & Dav´ e, R. 2015, ARA&A, 53, 51, doi: 10.1146/annurev-astro-082812-140951
2015 doi
-
[70]
2020, MNRAS, 499, 2760, doi: 10.1093/mnras/staa2937
Sorini, D., Dav´ e, R., & Angl´ es-Alc´ azar, D. 2020, MNRAS, 499, 2760, doi: 10.1093/mnras/staa2937
2020 doi
-
[71]
T., Keeney, B
Stocke, J. T., Keeney, B. A., Danforth, C. W., et al. 2013, ApJ, 763, 148, doi: 10.1088/0004-637X/763/2/148
2013 doi
-
[72]
2015, MNRAS, 448, 895, doi: 10.1093/mnras/stu2762
Suresh, J., Bird, S., Vogelsberger, M., et al. 2015, MNRAS, 448, 895, doi: 10.1093/mnras/stu2762
2015 doi
-
[73]
2002, A&A, 390, 829, doi: 10.1051/0004-6361:20011755
Sancisi, R. 2002, A&A, 390, 829, doi: 10.1051/0004-6361:20011755
2002 doi
-
[74]
K., Wilde, M
Tchernyshyov, K., Werk, J. K., Wilde, M. C., et al. 2023, ApJ, 949, 41, doi: 10.3847/1538-4357/acc86a
2023 doi
-
[75]
L., Finn, C
Tejos, N., Morris, S. L., Finn, C. W., et al. 2014, MNRAS, 437, 2017, doi: 10.1093/mnras/stt1844
2014 doi
-
[76]
K., et al
Thom, C., Tumlinson, J., Werk, J. K., et al. 2012, ApJL, 758, L41, doi: 10.1088/2041-8205/758/2/L41
2012 doi
-
[77]
S., & Werk, J
Tumlinson, J., Peeples, M. S., & Werk, J. K. 2017, ARA&A, 55, 389, doi: 10.1146/annurev-astro-091916-055240
2017 doi
-
[78]
K., et al
Tumlinson, J., Thom, C., Werk, J. K., et al. 2011, Science, 334, 948, doi: 10.1126/science.1209840 —. 2013, ApJ, 777, 59, doi: 10.1088/0004-637X/777/1/59 van de Voort, F., Springel, V., Mandelker, N., van den
2011 doi
-
[79]
C., & Pakmor, R
Bosch, F. C., & Pakmor, R. 2019, MNRAS, 482, L85, doi: 10.1093/mnrasl/sly190
2019 doi
-
[80]
2005, ARA&A, 43, 769, doi: 10.1146/annurev.astro.43.072103.150610 20 Koplitz et al
Veilleux, S., Cecil, G., & Bland-Hawthorn, J. 2005, ARA&A, 43, 769, doi: 10.1146/annurev.astro.43.072103.150610 20 Koplitz et al
2005 arXiv
-
[81]
E., et al
Virtanen, P., Gommers, R., Oliphant, T. E., et al. 2020, Nature Methods, 17, 261, doi: 10.1038/s41592-019-0686-2
2020 doi
-
[82]
M., Bryan, G
Voit, G. M., Bryan, G. L., Prasad, D., et al. 2020, ApJ, 899, 70, doi: 10.3847/1538-4357/aba42e
2020 doi
-
[83]
K., Prochaska, J
Werk, J. K., Prochaska, J. X., Thom, C., et al. 2013, ApJS, 204, 17, doi: 10.1088/0067-0049/204/2/17
2013 doi
-
[84]
K., Prochaska, J
Werk, J. K., Prochaska, J. X., Tumlinson, J., et al. 2014, ApJ, 792, 8, doi: 10.1088/0004-637X/792/1/8
2014 doi
-
[85]
K., Prochaska, J
Werk, J. K., Prochaska, J. X., Cantalupo, S., et al. 2016, ApJ, 833, 54, doi: 10.3847/1538-4357/833/1/54
2016 doi
-
[86]
C., Werk, J
Wilde, M. C., Werk, J. K., Burchett, J. N., et al. 2021, ApJ, 912, 9, doi: 10.3847/1538-4357/abea14
2021 doi
-
[87]
S., Chen, H.-W., Cooper, T
Zahedy, F. S., Chen, H.-W., Cooper, T. M., et al. 2021, MNRAS, 506, 877, doi: 10.1093/mnras/stab1661
2021 doi
-
[88]
2020, MNRAS, 499, 768, doi: 10.1093/mnras/staa2607
Zinger, E., Pillepich, A., Nelson, D., et al. 2020, MNRAS, 499, 768, doi: 10.1093/mnras/staa2607
2020 doi
-
[89]
A., Meyer, M
Zwaan, M. A., Meyer, M. J., Webster, R. L., et al. 2004, MNRAS, 350, 1210, doi: 10.1111/j.1365-2966.2004.07782.x
2004
Reviewed August 9, 2026 · model on record in the stance chip above.
Discussion (0). Continue with ORCID to comment.