REVIEW 4 major objections 5 minor 2 cited by
Knowledge Distillation from Large Language Models for Household Energy Modeling
T0 review · 4 major / 5 minor · reviewed 2026-08-09 · deepseek-v4-flash
Pith's one-line read The paper proposes that five large language models, guided by structured prompts, can generate culturally sensitive household energy consumption data for six countries, addressing the shortage of realistic, privacy-compliant datasets for…
desk verdict A reproducible, honest proof-of-concept for LLM-based household load synthesis, whose core 'realistic' claim is face-validity-only and needs quantitative validation or a cooled-down claim. read the letter →
The pith
A machine-rendered reading of the paper's core claim, the machinery that carries it, and where it could break.
The reading
What carries the argument
The central mechanism is prompt-engineered knowledge distillation, implemented as a sequence of four prompting stages with strict structured-output formats. The named object that carries the argument is the energy signature, a plot of total household electricity use against outside temperature; it is the device that lets the synthetic data be compared with real-world consumption and that makes climate-adaptive behavior visible. A secondary mechanism is the swap of LLM-generated weather for external Typical Meteorological Year data, which keeps the downstream energy modeling physically consistent while bypassing the two weather stages.
What would settle it
Take the published synthetic profiles for a defined household type and season, and compare their hourly load shape against real smart-meter or CityLearn data using a quantitative error metric. If the synthetic profiles are no closer to real loads than a simple constant-load or average-shape baseline, the realism claim fails.
Extended reading notes
Core claim
The central claim is that a four-stage, prompt-driven workflow can distill the cultural, climatic, and behavioral knowledge already stored in LLMs into structured household energy data. The stages are: generate culturally appropriate family structures; identify realistic seasonal ranges for temperature, humidity, solar radiation, and wind; synthesize 24-hour weather profiles; and assign each member 24 hourly activities with electricity values plus weather-linked HVAC loads, then aggregate into yearly profiles using country-specific weekends and holidays. Three of the five tested models produced consistently complete outputs, and an alternative route replaces the two weather stages with externally sourced Typical Meteorological Year data. The generated profiles are summarized as energy signatures, plots of total consumption against outside temperature, which the authors compare visually with a real open dataset to argue that the synthetic data align with observed household behavior.
Load-bearing premise
The whole pipeline stands on the assumption that the specific hourly electricity values the LLM assigns, for example 0.3 kWh for dinner, are close to real residential loads, and the paper's check of this is a visual comparison against one open dataset rather than a quantitative error measurement.
Editorial extensions
If this is right
- Household energy researchers can generate on-demand datasets for countries, cultures, and family types that lack smart-meter coverage, without privacy constraints.
- The framework turns scenario questions, such as changing climate, family composition, or weekday and weekend routines, into prompt changes, enabling controlled simulation experiments.
- Swapping in external Typical Meteorological Year weather data makes the pipeline cheaper and physically consistent while preserving the cultural and behavioral detail of the consumption stage.
- Energy signatures derived from the synthetic yearly profiles support cross-cultural comparison of heating and cooling efficiency, insulation, and demand-response potential.
- Prompt-based iterative refinement provides a mechanism to correct contextual errors, such as misaligned family activities, as they are spotted.
Reading between the lines
- The paper's realism check is visual; a quantitative scoring of synthetic hourly profiles against real smart-meter distributions would be a direct extension, and would settle whether the generated shapes match statistical reality rather than just plausibility.
- If the pipeline scales, it could generate controlled counterfactual datasets, such as identical family structures under different climates or different cultural routines under identical weather, isolating culture from climate in ways real data rarely allow.
- The same distillation pipeline could be redirected to non-residential loads, EV charging, or socioeconomic strata, turning it into a reusable data generator rather than a one-off dataset.
Signed reviews
Editorial analysis
A structured set of objections, weighed in public.
Referee Report
Summary. The manuscript proposes a four-stage LLM-based pipeline for generating synthetic household energy consumption data across six countries, using five different LLMs. The stages generate culturally specific family structures, seasonally appropriate weather parameter ranges, hourly weather data, and hourly per-member electricity consumption profiles with HVAC contributions. The authors also present an alternative branch that replaces LLM-generated weather with external TMY data from pvlib, and they compare generated energy signatures to the CityLearn Challenge 2022 dataset. The paper claims the resulting data are realistic, culturally sensitive, and behavior-specific, and it releases source code.
Significance. If the realism claim were quantitatively supported, this pipeline would be a potentially useful, low-cost tool for generating diverse synthetic household load data for smart-grid ML research. The systematic comparison of five LLMs, the use of external weather data as a physically consistent alternative, and the public release of code are genuine strengths. However, the central claim currently rests on face validity: the kWh values are LLM-assigned, the only external validation is a visual comparison, and the paper's own examples document inconsistencies. The contribution is therefore promising but not yet demonstrated at the level claimed in the abstract.
major comments (4)
- [Section 3.5 and Appendix A.5] The headline output of the pipeline—hourly electricity consumption in kWh—is produced by prompting an LLM to attach a consumption value to each activity, with no appliance-level model, no calibration to metered data, and no quantitative error metric. The only external validation is the visual juxtaposition of energy signatures in Figures 8 and 9, with no RMSE, MAPE, distributional test, or overlaid comparison. This does not support the abstract's claim that the data are "realistic." I recommend adding quantitative validation against one or more public residential load datasets (e.g., CityLearn, UK-DALE, REFIT) and reporting error metrics and distributional comparisons.
- [Sections 3.6 and 4.5] The paper's own examples document semantic and attribution errors that directly undermine the realism claim. Section 4.5 reports that Llama-3.3-70B-Instruct assigned a 0.20 kWh lunch consumption to a father who is at work, and Section 3.6 reports identical 0.1 kWh values for father and son on a shared homework task, with the text noting this could be double-counting. These are not edge cases; they show that the generated data are not internally consistent with the stated occupancy model. The prompt refinements described in Section 3.6 reduce but do not eliminate these errors, and no post-hoc consistency checker is described.
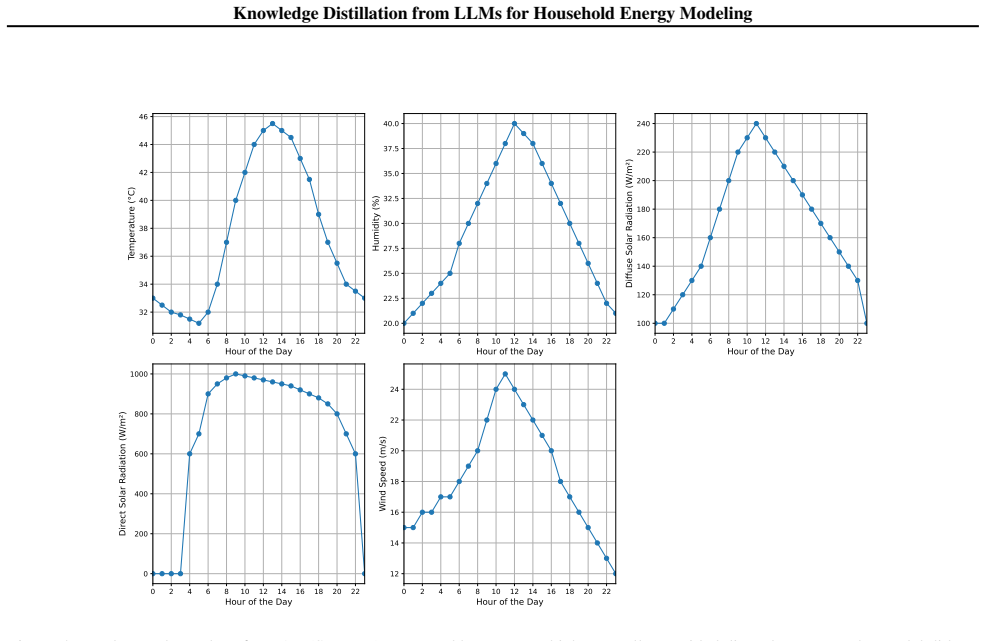
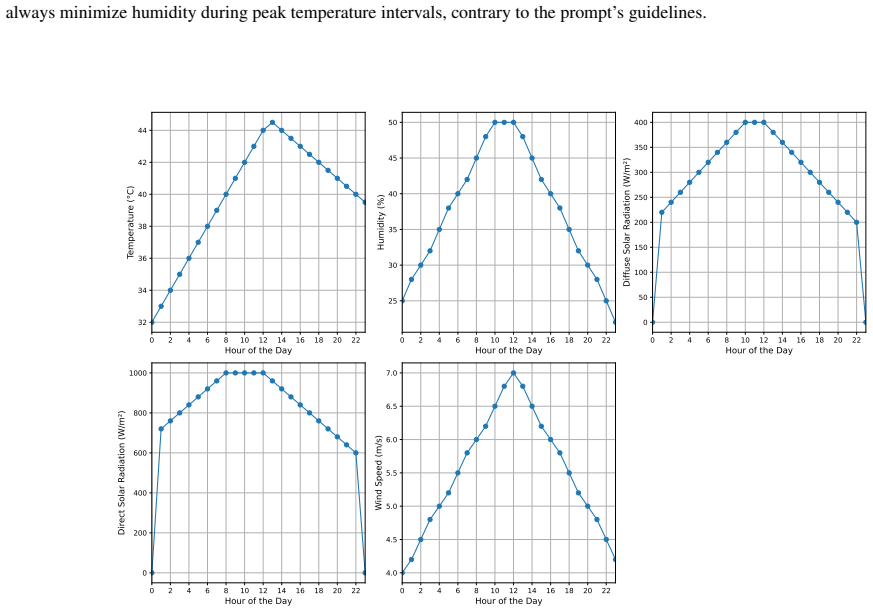
- [Appendix B.3] The sample Stage 3 weather output for the USA winter contains physically impossible values: nonzero diffuse and direct solar radiation at night (e.g., hour 21 has diffuse 80 W/m² and direct 160 W/m² with the label "No-Sun"). This violates the prompt's own constraint that solar radiation falls to zero at night and undermines confidence in the downstream HVAC calculations that consume this weather data. At minimum, a physical-consistency post-processing filter should be applied and documented, or the LLM-generated weather branch should be explicitly presented as illustrative rather than physically consistent.
- [Section 3.6] The "Validation and Refinement" step is largely self-referential. The refinements are justified by the model's adherence to prompt directives (e.g., thermal lag, interaction synchronization), not by comparison with measured data. This conflates prompt compliance with empirical validity. The paper should separate these two notions and clearly state which parts of the realism claim are supported only by the former.
minor comments (5)
- [Introduction] The phrase "significant correlations between between these factors" contains a duplicated "between."
- [Figure 1] The word "metrological" in the Stage 2 label should be "meteorological."
- [Throughout] The spacing in "HV AC" is inconsistent; it should be "HVAC" throughout.
- [Figures 2 and 7] The y-axis label "Electricity Usage (kW)" is ambiguous because the values are hourly energy amounts; please use "kWh" or specify "average power over the hour (kW)" consistently.
- [Section 4.5 and Appendix A.5] The cross-reference to the CityLearn comparison in Section 4.5 would be easier to follow if it explicitly pointed to Figure 9 in Appendix A.5.
Circularity Check
Central 'realistic data' claim is validated by prompt adherence rather than independent measurement; weather validation is partially self-referential to LLM-generated ranges.
-
fitted input called prediction
[Section 3.5 (Stage 4: Consumption Patterns and Yearly Profiles) and Section 3.6 (Validation and Refinement)]
"Stage 4 assigns 24 hourly actions and energy values to each household member, factoring in HVAC linked to weather data. Prompts emphasize cultural, seasonal, and weekday/weekend differences. ... To ensure accuracy and realism, outputs were validated against expected cultural norms, weather patterns, and energy usage behaviors. Iterative refinements to the prompts were made based on observed deviations, such as unrealistic activity sequences, energy values, or weather anomalies."
The claimed deliverable—realistic, culturally sensitive, behavior-specific hourly kWh values—is produced by prompting the LLM to be realistic, and then 'validated' against the same prompt-defined expectations. The validation loop is closed by prompt refinement, so the conclusion that the profiles are realistic reduces to the fact that the LLM followed the prompt's own criteria. No quantitative error metric against metered consumption is reported, so the 'realism' prediction is forced by construction rather than established externally.
-
self definitional
[Sections 3.3-3.4 and 3.6 (Stage 2, Stage 3, Weather Data Refinement)]
"Hourly variations reflect typical weather patterns within the following ranges for the country of [Country] during the [Season] season: Temperature: ... Humidity: ... Solar Radiation ... — Following these adjustments, the weather data showed improvements: Most solar radiation values aligned with expected meteorological ranges, enhancing the realism of HVAC energy modeling."
The Stage 2 ranges are themselves LLM outputs. Stage 3 is instructed to generate hourly values inside those ranges, and Section 3.6 validates the hourly output against those same self-generated ranges. The 'expected meteorological ranges' are therefore not independent physical constraints. The pvlib/TMY alternative path does provide an independent anchor, so this step is only partially circular for the LLM-generated weather branch.
full rationale
The paper's derivation chain reduces at two points to its own prompts. The headline product—hourly household electricity values—is generated by an LLM prompted to produce 'realistic' patterns; Section 3.6 validates these outputs against 'expected' cultural and behavioral norms and then refines the prompts until outputs match those norms. That is a closed loop: the evidence of realism is prompt compliance, not measurement. The only external check is a visual juxtaposition of generated energy signatures (Figure 8) with the CityLearn dataset (Figure 9); no RMSE, MAPE, distributional test, or overlay is reported, so it cannot independently break the loop. The weather branch is partially circular: Stage 3 is constrained to the Stage 2 LLM ranges and then checked against those same ranges, although the pvlib/TMY route supplies an independent alternative. The paper's own Section 4.5 records failures (0.20 kWh lunch while the father is at work; identical 0.1 kWh for father and son on a shared task), so outputs do not even fully meet the prompt criteria. Because the central claim of realism is asserted through the generative prompt rather than verified against data, a partial circularity score is appropriate. No self-citation, uniqueness-import, or ansatz-smuggling circularity is present.
Assumptions & free parameters
free parameters (1)
- Solar radiation cap =
1000 W/m²
assumptions (4)
- domain assumption LLMs contain sufficient real-world knowledge about household energy consumption, family structures, and weather to generate realistic data
- domain assumption Prompt engineering can elicit this knowledge reliably
- domain assumption External TMY data from pvlib is accurate and representative
- ad hoc to paper Visual comparison to CityLearn dataset is a valid validation of realism
Cite this review
Pith. "Pith review of Knowledge Distillation from Large Language Models for Household Energy Modeling." pith.science (2026). https://pith.science/paper/6TCTM5WJ
@misc{pith2026250203034,
  author       = {Pith},
  title        = {Pith review of: Knowledge Distillation from Large Language Models for Household Energy Modeling},
  year         = {2026},
  howpublished = {\url{https://pith.science/paper/6TCTM5WJ}},
  note         = {Machine review of arXiv:2502.03034}
}
read the original abstract
Machine learning (ML) is increasingly vital for smart-grid research, yet restricted access to realistic, diverse data - often due to privacy concerns - slows progress and fuels doubts within the energy sector about adopting ML-based strategies. We propose integrating Large Language Models (LLMs) in energy modeling to generate realistic, culturally sensitive, and behavior-specific data for household energy usage across diverse geographies. In this study, we employ and compare five different LLMs to systematically produce family structures, weather patterns, and daily consumption profiles for households in six distinct countries. A four-stage methodology synthesizes contextual daily data, including culturally nuanced activities, realistic weather ranges, HVAC operations, and distinct `energy signatures' that capture unique consumption footprints. Additionally, we explore an alternative strategy where external weather datasets can be directly integrated, bypassing intermediate weather modeling stages while ensuring physically consistent data inputs. The resulting dataset provides insights into how cultural, climatic, and behavioral factors converge to shape carbon emissions, offering a cost-effective avenue for scenario-based energy optimization. This approach underscores how prompt engineering, combined with knowledge distillation, can advance sustainable energy research and climate mitigation efforts. Source code is available at https://github.com/Singularity-AI-Lab/LLM-Energy-Knowledge-Distillation .
Figures


Figures from the paper (6 more)



Forward citations
Cited by 2 Pith papers
-
WattCouncil: Context-Aware Household Energy Scenario Generation With Governed LLMs
A governed multi-agent LLM council produces context-aware synthetic household load profiles whose daily shapes correlate with CER smart-meter data, though absolute magnitudes remain systematically off.
-
Negotiating Comfort: Simulating Personality-Driven LLM Agents in Shared Residential Social Networks
LLM-based generative agents simulate personality-driven temperature negotiations in a shared residential building, with positive personality traits associated with higher happiness and stronger friendships.
Reference graph
Works this paper leans on
-
[1]
For the provided country , create unique family types based on cultural norms , ensuring no duplication of family types within the same country
-
[2]
, relevant to the country 's cultural setting
Include family structures like Nuclear Family , Extended Family , Single - Parent Family , Joint Family , etc . , relevant to the country 's cultural setting
-
[3]
Each family type should have a short clear description and a list of family members that represent this family type
-
[4]
Provide a diverse set of families for the country to represent realistic household scenarios
-
[5]
The language must be English and it should be clear , concise , and culturally sensitive to represent the diversity of family structures across different regions . ** Output Format **: Once you finish analyzing , respond in valid JSON format , starting with ` $$ MESSAGE_START $$ ` and ending with ` $$ MESSAGE_END $$ `. \ Your response must be formatted st...
-
[6]
** Heating / Cooling **: Include heating or cooling activities based on the season , weather data and members daily usage and include corresponding electricity usage
-
[7]
** Format **: Adhere strictly to the provided output format , ensuring no extra text or commentary . Key Considerations : - Electricity consumption values must align with typical appliance usage or activities for each action . - If a family member is outside the house ( e . g . , at work , school , or commuting ) , the corresponding electricity consumptio...
-
[9]
** Seasonal Weather Data **: Provide min - max ranges for the specified weather parameters for each season in the given country
Show all 44 references
-
[11]
Values should reflect : - Seasonal variations ( e
** Realism **: Ensure that the min - max values align with realistic expectations for each season and the country . Values should reflect : - Seasonal variations ( e . g . , higher temperatures in summer , lower in winter ) . - Regional climatic conditions ( e . g . , arid reg...
-
[12]
Key Considerations :
** Output Format **: Adhere strictly to the provided structure below to ensure compatibility with downstream processing . Key Considerations :
-
[13]
Use global meteorological data and knowledge to derive the ranges
-
[14]
Avoid extreme outliers unless they represent realistic but rare occurrences
-
[15]
"" User Prompt
Ensure : - The min - max values are realistic for the specified country and season . - The ranges reflect typical daily variations within each season . - Coherence between the parameters ( e . g . , high solar radiation corresponds to low humidity ) . Once you finish thinking ...
-
[17]
** Daily Weather Data **: Generate distinct weather data for a specific country and season , covering 24 hours
-
[18]
** Weather Parameters **: - Temperature ( ° C ) - Humidity (%) - Solar Radiation ( Diffuse and Direct ) ( W / m 2 ) - Wind Speed ( m / s )
-
[19]
** Seasonal Context **: Ensure that the values align with the seasonal conditions and interact realistically \ ( e . g . , higher solar radiation typically corresponds to lower humidity during the day , while wind speeds may increase in the afternoon )
-
[20]
** Realism **: Values should vary throughout the day to reflect typical weather patterns ( e . g . , higher solar radiation at noon , lower temperatures at night )
-
[21]
"" User Prompt
** Format **: Adhere strictly to the provided output format , ensuring no extra text or commentary . Key Considerations : - The temperature range should reflect the country and season ( e . g . , colder in winter , hotter in summer ) . - Humidity levels should vary realistical...
-
[22]
Values are realistic for the specified country and season , and extreme outliers ( e . g . , unrealistic highs or lows ) are avoided unless representing rare but plausible conditions
-
[23]
Each parameter includes a short descriptive label along with its numeric value e . g . , (0 , Cold - clear , -2.0)
-
[24]
""" Below is a sample response generated using the Meta-Llama-3.1-405B-Instruct model showing the USA weather for a full day per season
The values for Solar Radiation peak during midday (12 PM to 3 PM ) , and Temperature peaks later in the day (2 -4 PM ) . """ Below is a sample response generated using the Meta-Llama-3.1-405B-Instruct model showing the USA weather for a full day per season. Each LLM generated ...
-
[30]
]\ n # SolRad - Direct #[(0 , No - Sun , 0) , (1 , Low , 50) , (2 , Low , 100) , (3 , Moderate ,
-
[33]
** Daily Patterns **: Generate distinct patterns for weekdays and weekends for each family in the selected country and season
-
[34]
** Hourly Actions **: Each family member must have 24 hourly actions , each with a corresponding electricity consumption value
-
[35]
Father helps Son with homework
** Interactions **: Include realistic interactions among family members where applicable ( e . g . , " Father helps Son with homework ")
-
[36]
** Realism **: Ensure variety and avoid repetition ( no action repeated for more than 3 hours , except for sleeping , capped at 8 hours )
-
[37]
** Context **: Consider the cultural , seasonal , and weekday / weekend - specific lifestyle patterns when assigning actions and consumption values
-
[40]
Hourly actions and electricity consumption for each family member
-
[41]
Father helps Son with homework
Realistic interactions among family members ( e . g . , " Father helps Son with homework ")
-
[42]
, (2 , Low , 45) , (3 , Moderate , 50) , (4 , Moderate , 55) , (5 , Moderate , 60) , (6 , High , 65) , (7 , High , 70) , (8 , High , 68) , (9 , Moderate , 65) , (10 , Moderate , 62) , (11 , Moderate , 60) , (12 , Low , 58) , (13 , Low , 55) , (14 , Low , 50) , (15 , Low , 45) ...
-
[43]
Varied actions ( no single action repeated for more than 3 hours , except for sleeping , capped at 8 hours )
-
[44]
Electricity consumption in kWh for each action , considering appliances / devices 28 Knowledge Distillation from LLMs for Household Energy Modeling used in a typical household
-
[45]
Each family member must have exactly 24 hourly actions and corresponding consumption values
-
[46]
"" User Prompt
HVAC ( Heating , Ventilation , and Air Conditioning ) values for heating and cooling , which are influenced by : - The total number of members in the house in total and at the current hour . - Their activities ( e . g . , all members sleeping , eating together , or when the ho...
-
[60]
]\ n # SolRad - Diffuse #[(0 , No - Sun , 0) , (1 , Low , 20) , (2 , Low , 40) , (3 , Moderate , 60) , (4 , Moderate , 80) , (5 , High , 100) , (6 , High , 120) , (7 , High ,
-
[115]
, (16 , Moderate , 110) , (17 , Moderate , 105) , (18 , Low , 100) , (19 , Low , 95) , (20 , Low , 90) , (21 , No - Sun , 80) , (22 , No - Sun , 60) , (23 , No - Sun ,
-
[135]
, (12 , Very - High , 130) , (13 , Very - High , 125) , (14 , High , 120) , (15 , High ,
-
[140]
, (8 , Very - High , 150) , (9 , Very - High , 145) , (10 , High , 140) , (11 , High ,
-
[150]
, (4 , Moderate , 200) , (5 , High , 250) , (6 , High , 280) , (7 , High , 300) , (8 , Very - High , 290) , (9 , Very - High , 280) , (10 , High , 270) , (11 , High , 260) , (12 , Very - High , 250) , (13 , Very - High , 240) , (14 , High , 230) , (15 , High , 220) , (16 , Mod...
-
[170]
, (21 , No - Sun , 160) , (22 , No - Sun , 120) , (23 , No - Sun , 0) ]\ n # Wind - Speed #[(0 , Calm , 0.5) , (1 , Light - Air , 1.0) , (2 , Light - Breeze , 1.5) , (3 , Gentle - Breeze , 2.0) , (4 , Gentle - Breeze , 2.5) , (5 , Moderate - Breeze , 3.0) , (6 , Moderate - Bre...
-
[700]
Generating Weather Data System Prompt """ You are a highly skilled assistant specializing in weather forecasting and energy modeling
,( Autumn ,200 ,500) ]# Wind - Speed #[( Winter ,0 ,15) ,( Spring ,2 ,18) , ( Summer ,2 ,15) ,( Autumn ,2 ,18) ] $$ MESSAGE_END $$ ' 24 Knowledge Distillation from LLMs for Household Energy Modeling B.3. Generating Weather Data System Prompt """ You are a highly skilled assist...
-
[2021]
doi: 10.1145/3447555.3464867. Wood, R. Prompt Engineering for Large Language Mod- els. Business Applications of Artificial Intelligence and Machine Learning, April 2024. 9 Knowledge Distillation from LLMs for Household Energy Modeling Xu, F., Tian, D., Gao, Z., and Zhang, J. J...
2024
-
[6296]
Nweye, K., Siva, S., and Nagy, G
doi: 10.1016/j.erss.2015.08.018. Nweye, K., Siva, S., and Nagy, G. Z. The CityLearn Chal- lenge 2022, 2023. URL https://doi.org/10.18738/ T8/0YLJ6Q. Park, J. S., O’Brien, J., Cai, C. J., Morris, M. R., Liang, P., and Bernstein, M. S. Generative agents: Interactive simulacra of...
2015 doi
-
[6478]
Nicholls, L
doi: 10.1007/s12053-017-9553-0. Nicholls, L. and Strengers, Y . Peak demand and the ‘fam- ily peak’ period in Australia: Understanding practice (in)flexibility in households with children. Energy Re- search & Social Science, 9:116–124, 2015. ISSN 2214-
Reviewed August 9, 2026 · model on record in the stance chip above.
Discussion (0). Continue with ORCID to comment.