REVIEW 4 major objections 5 minor 66 references
Starburst Galaxies in Their Last Billion Years: An H${\delta}$ Absorption Line Selected Sample
T0 review · 4 major / 5 minor · reviewed 2026-08-08 · deepseek-v4-flash
Pith's one-line read This paper claims that a sample of galaxies selected solely by H$\delta$ absorption captures starbursts in their final billion years and shows a spectral aging sequence from burst to quiescence.
desk verdict A useful new Hδ-selected sample with a plausible but not yet nailed-down evolutionary timeline; referee it, but require error bars on the stacked EWs and a softer interpretation of the Hδ-sSFR clock. read the letter →
The pith
A machine-rendered reading of the paper's core claim, the machinery that carries it, and where it could break.
The reading
What carries the argument
The central object is the H$\delta$ absorption-line equivalent width used as an age tracer, interpreted with the Kauffmann et al. (2003) model in which EW(H$\delta$) rises from a burst, peaks near $4\times10^8$ yr when A stars dominate, and declines to about 2 \AA{} by $10^9$ yr. This is combined with a star-formation-rate normalisation relative to the main sequence (Popesso et al. 2019) and UVJ rest-frame colour boundaries (Muzzin et al. 2013) to split the sample into starburst, main-sequence, and quiescent zones, while stacked MgII/MgI line strengths provide the F/G-star measure that carries the aging argument.
What would settle it
Measure the cold-gas content or merger morphology of the main-sequence galaxies that have the highest H$\delta$ equivalent widths: if many are gas-rich or tidally disturbed, then they are not faded post-starbursts in transit to quiescence, and the monotonic aging track is falsified. A complementary test is to fit full star-formation histories to the stacked spectra and check whether a single SSP-plus-exponential decay reproduces the MgII--H$\delta$ correlation; if a mixed young-plus-old population fits equally well, the inference of a single aging sequence is not unique.
Extended reading notes
Core claim
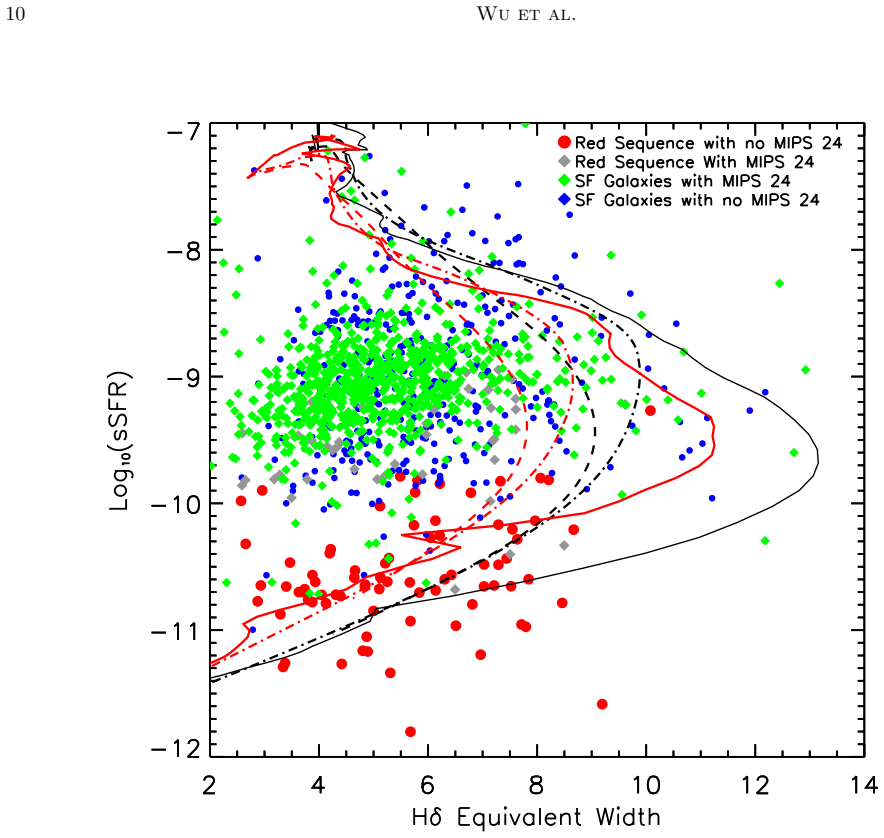
The central claim is that a pure H$\delta$ absorption-line selection, without the [OII] emission cut used in traditional E+A post-starburst searches, captures late-stage starburst galaxies and orders them along an evolutionary sequence from burst to quiescence. In the plane of H$\delta$ equivalent width versus $\mathrm{SFR}/\mathrm{SFR}_{\mathrm{MS}}$, both the starburst and the quiescent populations sit at low H$\delta$, while the main-sequence galaxies peak in H$\delta$ EW, and stacked MgII (2800 \AA) and MgI (2852 \AA) absorption equivalent widths rise from roughly 2.6--3.7 \AA{} in star-forming populations to 6.5--7.2 \AA{} in red-sequence populations. Since MgII lines strengthen from A-type through F- and G-type stars, this rise is presented as direct evidence of a stellar-population aging sequence spanning about $10^9$ years.
Load-bearing premise
The chronological reading of the data assumes that a galaxy's place in the H$\delta$ equivalent width versus star-formation-rate diagram maps monotonically to the time since its last burst, so a secondary burst (for example from merging) does not break the ordering.
Editorial extensions
If this is right
- A sample selected purely by H$\delta$ absorption, without [OII] cuts, includes dusty and AGN-affected transition galaxies that classical E+A selection misses, giving a more complete census of the starburst-to-quiescent phase.
- The main sequence in the H$\delta$--sSFR plane marks the evolutionary crossing point, so galaxies found there can be treated as the recently burst, fading population at $0.1<z<0.8$.
- The observed increase of MgII and MgI absorption toward red-sequence populations implies a measurable buildup of F- and G-type stars over the $\sim 10^9$ yr fading time, which can be used to date the quenching event.
- The low overall AGN fraction (about 7%) implies that AGN activity is short-lived compared with the A-star phase, while the 30% AGN rate among red-sequence galaxies with MIPS 24$\mu$m emission points to that population as the place where AGN-driven quenching operates.
Reading between the lines
- A direct extension would be to measure CO or dust-mass gas fractions across the sequence; a smooth decline toward the red sequence would support the monotonic fading track, while gas-rich galaxies in the H$\delta$-peak bin would support a starburst-cyclic picture that the paper itself mentions as a possibility.
- Because the classification uses normalized SFR and rest-frame UVJ colors rather than observed [OII] fluxes, it can be ported to higher-redshift samples observed with near-infrared spectroscopy, where H$\delta$ is still accessible.
- The stacking approach predicts a tight correlation between H$\delta$ EW and MgII EW within the main-sequence bin if the sample is a single-age sequence; a wide scatter would indicate composite stellar populations and would weaken the 'last billion years' interpretation.
- The contrasting AGN fractions between red-sequence galaxies with and without MIPS 24$\mu$m emission suggest a testable scenario in which the final quenching is accompanied by a dust-obscured AGN episode; follow-up X-ray stacking on fainter AGN candidates could check this.
Editorial analysis
A structured set of objections, weighed in public.
Referee Report
Summary. The paper selects 1323 galaxies from the AGES spectroscopic survey in the Boötes field with rest-frame Hδ absorption equivalent width greater than 2 Å, S/N > 3, and a 5σ continuum requirement, over 0.1 < z < 0.8. It uses UVJ colors and MIPS 24 μm detections to split the sample into four populations, estimates stellar masses and star formation rates from multi-wavelength photometry, and studies the distribution of the sample in the Hδ EW versus sSFR plane. Simple stellar population and exponential-decay star formation history models are used to interpret motion in this plane as an evolutionary sequence from starburst through the main sequence to quiescence. Stacked spectra are used to measure mean MgII, MgI, [OII], and [OIII] equivalent widths in the four populations, and the increase of MgII/MgI absorption from star-forming to red-sequence galaxies is interpreted as growth of the F- and G-type star fraction. The paper also identifies AGNs via [NeV], broad MgII, X-ray, and mid-infrared selection and reports their fraction per population.
Significance. If the central claims are confirmed, the paper would provide a sizable Hδ-selected sample at higher redshift than most previous post-starburst studies and a plausible method for mapping the late stages of starburst evolution. The sample construction is transparent, the iterative emission-plus-absorption decomposition for Hδ is a reasonable approach, and the multi-wavelength coverage in Boötes is a clear strength that allows consistent mass and SFR estimates. The paper also makes a useful, falsifiable observational statement: red-sequence galaxies in this Hδ-selected sample have stronger mean MgII absorption than star-forming galaxies. However, the quantitative support for the evolutionary-stage interpretation is currently incomplete: the stacked equivalent widths in Table 2 are presented without uncertainties, the models in Figure 7 are illustrative rather than fit to the data, and the MgII interpretation does not account for the resonance-line nature of the feature. These issues are load-bearing for the paper's main chronological and stellar-population claims, so the manuscript needs a major revision rather than a minor one.
major comments (4)
- [Section 5, Table 2] Table 2 reports mean MgII(2800), MgI(2852), [OII](3727), and [OIII](5008) equivalent widths for the four populations without any uncertainties, sample sizes, or significance tests. The paper's central claim that MgII absorption 'substantially increases' from star-forming galaxies (EW ≈ 3.7 Å) to red-sequence galaxies without MIPS detection (EW ≈ 7.2 Å) rests entirely on these values, so without bootstrap or jackknife errors on the stacks, or at least a statement of the number of spectra entering each stack, the difference cannot be evaluated. This is a load-bearing quantitative gap.
- [Section 4 and Figure 7] The evolutionary-track interpretation treats a galaxy's position in the Hδ EW versus sSFR plane as a monotonic clock. The curves plotted in Figure 7 are SSP and exponential-decay models with τ = 10^6 and 10^7 yr; they are not fitted to the data and do not include ongoing star formation or multiple bursts. The manuscript itself states that 'galaxy merging can move them up to the starburst region again,' which breaks the monotonic mapping. A main-sequence galaxy with high Hδ EW could be a post-burst descendant, a rejuvenated system, or a continuous star former with a minor recent episode. The claim that these objects are 'passing through' the main sequence from starburst to quiescence therefore needs independent age indicators or an explicit treatment of these alternative paths, rather than relying on the illustrative models alone.
- [Section 5 and Figure 10] The inference that increasing MgII absorption traces an increasing fraction of F- and G-type stars is not yet secure because the MgII λλ2796,2803 doublet is a resonance line whose observed absorption can be substantially affected by interstellar gas, outflows, and dust, in addition to stellar photospheric absorption. The paper cites Fanelli et al. (1990) for the stellar spectral dependence, but the stacked spectra in Figure 10 include the full galaxy spectrum, so the MgII feature cannot be assumed to be purely stellar. A stellar-population interpretation requires either a decomposition that separates interstellar from photospheric components or a demonstration that the MgII EW trend is not driven by outflow or covering-fraction effects.
- [Section 4, right panel of Figure 6] The statement that galaxies 'passing through the main sequence zone have the maximum fraction of A-type stars' is partly a selection effect. The sample is selected on EW(Hδ) > 2 Å and S/N > 3, so every galaxy in the sample has a measurable A-star population; the main-sequence region in the right panel of Figure 6 is populated by galaxies with the highest Hδ EW, which is expected if the selection preferentially captures the post-burst epoch. To support the chronological interpretation, the paper should compare the Hδ EW distribution in the main-sequence region with that of galaxies below the main sequence and with the selection function of the parent AGES sample, rather than treating the peak as direct evidence of a transition.
minor comments (5)
- [Section 7] The summary contains a duplicated phrase: 'or even already to become a post-starburst galaxy' appears twice in the first paragraph.
- [Section 5] The phrase 'no detectable emission orange of H α and [OII] 3727 Å' should read 'no detectable emission lines of H α and [OII] 3727 Å'.
- [Table 2 caption] The caption should specify that the equivalent widths are rest-frame, give the number of galaxies in each stack, and state the wavelength range used for the MgII and MgI measurements.
- [Figure 7 caption] The caption should define the star formation histories explicitly, including the burst mass fraction, metallicity values, and the exact meaning of the solid, dash-dotted, and dashed curves, so the reader can reproduce the tracks.
- [References] The reference for Soifer & Spitzer/NOAO Team (2004) is incomplete; it lists an abstract number but no page or article identifier, which should be corrected.
Circularity Check
No significant circularity: the Hδ-selected sample, sSFR/UVJ classification, and MgII spectral measurements are independent observables; the evolutionary interpretation is model-dependent but not fitted to the same data.
full rationale
The paper's central results are empirical associations among independently measured quantities: Hδ equivalent widths measured from AGES spectra, UVJ colors, SFRs estimated from UV/IR photometry, and MgII/MgI equivalent widths from stacked spectra. The evolutionary timeline is anchored to external models (Kauffmann et al. 2003) and to simple stellar-population/exponential-decay tracks in Figure 7, but no parameter of these models is fitted to the Hδ–sSFR distribution of the sample, so the agreement between data and tracks is a genuine comparison rather than a fitted prediction. The main-sequence 'crossing' interpretation is model-dependent: the paper itself notes that 'galaxy merging can move them up to the starburst region again' (Section 4), which breaks a strictly monotonic age clock, but that is a correctness or model-selection concern, not circularity. The only author-overlap citations (e.g., Li et al. 2024 for [NeV] AGN identification; Huang et al. 2013 and Xu et al. 2020 for context) are not load-bearing for the central evolutionary claim, and the MgII stacking results are independent of the UVJ/SFR classification despite being qualitatively consistent with it. I therefore find no specific circular step that can be exhibited as a reduction of a prediction to its inputs.
Assumptions & free parameters
free parameters (4)
- Post-starburst selection thresholds =
EW(Hδ) > 4 Å; log10(SFR/SFRMS) < -0.3; UVJ red-sequence colors
- Starburst and quiescent boundaries in SFR/SFRMS =
+/-0.3 dex
- Exponential decay timescales in SFH models =
tau = 1e6 and 1e7 yr
- Dust attenuation prior in SED fits =
0 < Av < 3 mag
assumptions (8)
- domain assumption Flat Lambda-CDM cosmology with Omega_M=0.3, Omega_Lambda=0.7, h=0.7
- domain assumption Chabrier (2003) initial mass function
- domain assumption Bruzual and Charlot (2003) stellar population synthesis models
- domain assumption Calzetti et al. (2000) dust attenuation law
- domain assumption Kauffmann et al. (2003) Hδ equivalent width evolution model
- domain assumption Muzzin et al. (2013) UVJ boundaries separate passive from star-forming galaxies at z<1
- domain assumption Popesso et al. (2019) main-sequence relation is valid for the Boötes field at z=0.1-0.8
- domain assumption MgII absorption strength tracks the F/G star fraction without strong dust or metallicity degeneracy
Cite this review
Pith. "Pith review of Starburst Galaxies in Their Last Billion Years: An H${\delta}$ Absorption Line Selected Sample." pith.science (2026). https://pith.science/paper/DKCFMPO5
@misc{pith2026250204607,
  author       = {Pith},
  title        = {Pith review of: Starburst Galaxies in Their Last Billion Years: An H$\delta$ Absorption Line Selected Sample},
  year         = {2026},
  howpublished = {\url{https://pith.science/paper/DKCFMPO5}},
  note         = {Machine review of arXiv:2502.04607}
}
abstract
In this paper, we focus on the study of starburst galaxies in their final billion years. Our galaxy selection is based solely on the presence of the H${\delta}$ absorption line, which permits tracing the later evolution of starburst galaxies, coinciding with the emergence of A-type stars in these galaxies. We propose a novel method that utilizes star formation rate and UVJ colors to classify galaxies in the sample, and use the spectral features to mark their evolution stages. Our in-depth analysis of the MgII line indicates the substantial increasing of F- and G-type stars when a galaxy evolves from star forming to quiescent phase. Furthermore, we identify AGNs in this sample to explore their roles in the later stage of galaxy star formation history.
Figures


Figures from the paper (9 more)




Reference graph
Works this paper leans on
-
[1]
Abraham, R. G., Nair, P., McCarthy, P. J., et al. 2007, ApJ, 669, 184, doi: 10.1086/521138
doi:10.1086/521138 2007
-
[2]
Arnouts, S., Walcher, C. J., Le F` evre, O., et al. 2007, A&A, 476, 137, doi: 10.1051/0004-6361:20077632 An Hδ Absorption Line Selected Sample 15
-
[3]
K., Glazebrook, K., Brinkmann, J., et al
Baldry, I. K., Glazebrook, K., Brinkmann, J., et al. 2004, ApJ, 600, 681, doi: 10.1086/380092
doi:10.1086/380092 2004
-
[4]
Beare, R., Brown, M. J. I., Pimbblet, K., Bian, F., & Lin, Y.-T. 2015, ApJ, 815, 94, doi: 10.1088/0004-637X/815/2/94
-
[5]
Beare, R., Brown, M. J. I., Pimbblet, K., & Taylor, E. N. 2019, ApJ, 873, 78, doi: 10.3847/1538-4357/ab041a
-
[7]
F., Papovich, C., Wolf, C., et al
Bell, E. F., Papovich, C., Wolf, C., et al. 2005, ApJ, 625, 23, doi: 10.1086/429552
doi:10.1086/429552 2005
-
[8]
Blake, C., Pracy, M. B., Couch, W. J., et al. 2004, MNRAS, 355, 713, doi: 10.1111/j.1365-2966.2004.08351.x
-
[9]
Borch, A., Meisenheimer, K., Bell, E. F., et al. 2006, A&A, 453, 869, doi: 10.1051/0004-6361:20054376
Show all 66 references
-
[10]
Brand, K., Brown, M. J. I., Dey, A., et al. 2006, ApJ, 641, 140, doi: 10.1086/500312
2006 doi
-
[12]
C., et al
Calzetti, D., Armus, L., Bohlin, R. C., et al. 2000, ApJ, 533, 682, doi: 10.1086/308692
2000 doi
-
[13]
I., Lilly, S
Caputi, K. I., Lilly, S. J., Aussel, H., et al. 2009, ApJ, 707, 1387, doi: 10.1088/0004-637X/707/2/1387
2009 doi
-
[14]
2003, PASP, 115, 763, doi: 10.1086/376392
Chabrier, G. 2003, PASP, 115, 763, doi: 10.1086/376392
2003 doi
-
[15]
2022, ApJ, 936, 47, doi: 10.3847/1538-4357/ac8748
Chang, W., Fang, G., Gu, Y., et al. 2022, ApJ, 936, 47, doi: 10.3847/1538-4357/ac8748
2022 doi
-
[16]
2001, ApJ, 556, 562, doi: 10.1086/321609
Chary, R., & Elbaz, D. 2001, ApJ, 556, 562, doi: 10.1086/321609
2001 doi
-
[17]
2024, ApJ, 961, 216, doi: 10.3847/1538-4357/ad1510
Cheng, Z., Li, C., Li, N., Yan, R., & Mo, H. 2024, ApJ, 961, 216, doi: 10.3847/1538-4357/ad1510
2024 doi
-
[18]
P., Naab, T., & Johansson, P
Choi, E., Ostriker, J. P., Naab, T., & Johansson, P. H. 2012, ApJ, 754, 125, doi: 10.1088/0004-637X/754/2/125
2012 doi
-
[19]
Ciotti, L., & Ostriker, J. P. 2001, ApJ, 551, 131, doi: 10.1086/320053
2001 doi
-
[20]
P., & Proga, D
Ciotti, L., Ostriker, J. P., & Proga, D. 2009, ApJ, 699, 89, doi: 10.1088/0004-637X/699/1/89
2009 doi
-
[21]
L., Songaila, A., Hu, E
Cowie, L. L., Songaila, A., Hu, E. M., & Cohen, J. G. 1996, AJ, 112, 839, doi: 10.1086/118058
1996 doi
-
[23]
L., Rieke, G
Donley, J. L., Rieke, G. H., P´ erez-Gonz´ alez, P. G., Rigby, J. R., & Alonso-Herrero, A. 2007, ApJ, 660, 167, doi: 10.1086/512798
2007 doi
-
[24]
2021, ApJ, 907, 114, doi: 10.3847/1538-4357/abd17c
Dou, J., Peng, Y., Renzini, A., et al. 2021, ApJ, 907, 114, doi: 10.3847/1538-4357/abd17c
2021 doi
-
[25]
Dressler, A., & Gunn, J. E. 1983, ApJ, 270, 7, doi: 10.1086/161093
1983 doi
-
[26]
R., Stern, D., Brodwin, M., et al
Eisenhardt, P. R., Stern, D., Brodwin, M., et al. 2004, ApJS, 154, 48, doi: 10.1086/423180
2004 doi
-
[27]
J., Gonzalez, A
Elston, R. J., Gonzalez, A. H., McKenzie, E., et al. 2006, ApJ, 639, 816, doi: 10.1086/499423
2006 doi
-
[28]
2006, ApJL, 641, L93, doi: 10.1086/504111
Taniguchi, K. 2006, ApJL, 641, L93, doi: 10.1086/504111
2006 doi
-
[29]
M., Willmer, C
Faber, S. M., Willmer, C. N. A., Wolf, C., et al. 2007, ApJ, 665, 265, doi: 10.1086/519294
2007 doi
-
[30]
Fabian, A. C. 1999, MNRAS, 308, L39, doi: 10.1046/j.1365-8711.1999.03017.x
1999
-
[31]
2005, PASP, 117, 1411, doi: 10.1086/497385
Fabricant, D., Fata, R., Roll, J., et al. 2005, PASP, 117, 1411, doi: 10.1086/497385
2005 doi
-
[32]
N., O’Connell, R
Fanelli, M. N., O’Connell, R. W., Burstein, D., & Wu, C.-C. 1990, ApJ, 364, 272, doi: 10.1086/169411
1990 doi
-
[33]
2018, A&A, 617, A62, doi: 10.1051/0004-6361/201833281
Feltre, A., Bacon, R., Tresse, L., et al. 2018, A&A, 617, A62, doi: 10.1051/0004-6361/201833281
2018 doi
-
[34]
2004, A&A, 424, 23, doi: 10.1051/0004-6361:20035626
Fontana, A., Pozzetti, L., Donnarumma, I., et al. 2004, A&A, 424, 23, doi: 10.1051/0004-6361:20035626
2004 doi
-
[35]
2013, ApJ, 775, 124, doi: 10.1088/0004-637X/775/2/124
Fu, L., & Li, X.-D. 2013, ApJ, 775, 124, doi: 10.1088/0004-637X/775/2/124
2013 doi
-
[36]
2004, AJ, 128, 2652, doi: 10.1086/425552
Glazebrook, K., Tober, J., Thomson, S., Bland-Hawthorn, J., & Abraham, R. 2004, AJ, 128, 2652, doi: 10.1086/425552
2004 doi
-
[37]
2005, MNRAS, 357, 937, doi: 10.1111/j.1365-2966.2005.08701.x —
Goto, T. 2005, MNRAS, 357, 937, doi: 10.1111/j.1365-2966.2005.08701.x —. 2007, MNRAS, 381, 187, doi: 10.1111/j.1365-2966.2007.12227.x
2005
-
[38]
E., Danieli, S., Carlsten, S., et al
Greene, J. E., Danieli, S., Carlsten, S., et al. 2023, ApJ, 949, 94, doi: 10.3847/1538-4357/acc58c
2023 doi
-
[39]
F., Hernquist, L., Cox, T
Hopkins, P. F., Hernquist, L., Cox, T. J., et al. 2005, ApJ, 630, 705, doi: 10.1086/432438
2005 doi
-
[40]
2006, ApJS, 163, 50, doi: 10.1086/499493
Springel, V. 2006, ApJS, 163, 50, doi: 10.1086/499493
2006 doi
-
[41]
S., Faber, S
Huang, J. S., Faber, S. M., Willmer, C. N. A., et al. 2013, ApJ, 766, 21, doi: 10.1088/0004-637X/766/1/21
2013 doi
-
[42]
2010, ApJ, 709, 644, doi: 10.1088/0004-637X/709/2/644
Ilbert, O., Salvato, M., Le Floc’h, E., et al. 2010, ApJ, 709, 644, doi: 10.1088/0004-637X/709/2/644
2010 doi
-
[43]
J., Le F` evre, O., et al
Ilbert, O., McCracken, H. J., Le F` evre, O., et al. 2013, A&A, 556, A55, doi: 10.1051/0004-6361/201321100
2013 doi
-
[44]
T., & Dey, A
Jannuzi, B. T., & Dey, A. 1999, in Astronomical Society of the Pacific Conference Series, Vol. 191, Photometric Redshifts and the Detection of High Redshift Galaxies, ed. R. Weymann, L. Storrie-Lombardi, M. Sawicki, & R. Brunner, 111
1999
-
[45]
M., White, S
Kauffmann, G., Heckman, T. M., White, S. D. M., et al. 2003, MNRAS, 341, 33, doi: 10.1046/j.1365-8711.2003.06291.x
2003
-
[46]
S., Forman, W
Kenter, A., Murray, S. S., Forman, W. R., et al. 2005, ApJS, 161, 9, doi: 10.1086/444379
2005 doi
-
[47]
S., Eisenstein, D
Kochanek, C. S., Eisenstein, D. J., Cool, R. J., et al. 2012, ApJS, 200, 8, doi: 10.1088/0067-0049/200/1/8 16 Wu et al
2012 doi
-
[48]
N., Hardcastle, M
Kondapally, R., Best, P. N., Hardcastle, M. J., et al. 2021, A&A, 648, A3, doi: 10.1051/0004-6361/202038813
2021 doi
-
[49]
G., Labb´ e, I., et al
Kriek, M., van Dokkum, P. G., Labb´ e, I., et al. 2009, ApJ, 700, 221, doi: 10.1088/0004-637X/700/1/221
2009 doi
-
[50]
S., Huang, J
Li, Z.-J., Dai, Y. S., Huang, J. S., Wuyts, S., & Cao, T.-W. 2024, ApJ, 963, 99, doi: 10.3847/1538-4357/ad1b54
2024 doi
-
[51]
C., Fanson, J., Schiminovich, D., et al
Martin, D. C., Fanson, J., Schiminovich, D., et al. 2005, ApJL, 619, L1, doi: 10.1086/426387
2005 doi
-
[52]
C., Carroll, C
Masini, A., Hickox, R. C., Carroll, C. M., et al. 2020, ApJS, 251, 2, doi: 10.3847/1538-4365/abb607
2020 doi
-
[53]
S., Kenter, A., Forman, W
Murray, S. S., Kenter, A., Forman, W. R., et al. 2005, ApJS, 161, 1, doi: 10.1086/444378
2005 doi
-
[54]
2013, ApJ, 777, 18, doi: 10.1088/0004-637X/777/1/18
Muzzin, A., Marchesini, D., Stefanon, M., et al. 2013, ApJ, 777, 18, doi: 10.1088/0004-637X/777/1/18
2013 doi
-
[55]
J., Bock, J., Altieri, B., et al
Oliver, S. J., Bock, J., Altieri, B., et al. 2012, MNRAS, 424, 1614, doi: 10.1111/j.1365-2966.2012.20912.x
2012
-
[56]
2019, MNRAS, 483, 3213, doi: 10.1093/mnras/sty3210
Popesso, P., Concas, A., Morselli, L., et al. 2019, MNRAS, 483, 3213, doi: 10.1093/mnras/sty3210
2019 doi
-
[57]
D., Hogg, D
Quintero, A. D., Hogg, D. W., Blanton, M. R., et al. 2004, ApJ, 602, 190, doi: 10.1086/380601
2004 doi
-
[58]
H., Alonso-Herrero, A., Weiner, B
Rieke, G. H., Alonso-Herrero, A., Weiner, B. J., et al. 2009, ApJ, 692, 556, doi: 10.1088/0004-637X/692/1/556
2009 doi
-
[59]
2020, ARA&A, 58, 529, doi: 10.1146/annurev-astro-032620-021933
Salim, S., & Narayanan, D. 2020, ARA&A, 58, 529, doi: 10.1146/annurev-astro-032620-021933
2020 doi
- [60]
-
[61]
T., & Spitzer/NOAO Team
Soifer, B. T., & Spitzer/NOAO Team. 2004, in American Astronomical Society Meeting Abstracts, Vol. 204, American Astronomical Society Meeting Abstracts #204, 48.05
2004
-
[62]
2014, MNRAS, 444, 2870, doi: 10.1093/mnras/stu1569
Wang, L., Viero, M., Clarke, C., et al. 2014, MNRAS, 444, 2870, doi: 10.1093/mnras/stu1569
2014 doi
-
[63]
M., et al
Wang, T., Elbaz, D., Alexander, D. M., et al. 2017, A&A, 601, A63, doi: 10.1051/0004-6361/201526645
2017 doi
-
[64]
R., Davidzon, I., Toft, S., et al
Weaver, J. R., Davidzon, I., Toft, S., et al. 2023, A&A, 677, A184, doi: 10.1051/0004-6361/202245581
2023 doi
-
[65]
E., Franx, M., Leja, J., et al
Whitaker, K. E., Franx, M., Leja, J., et al. 2014, ApJ, 795, 104, doi: 10.1088/0004-637X/795/2/104
2014 doi
-
[66]
S., Huang, J.-S., et al
Xu, H., Dai, Y. S., Huang, J.-S., et al. 2020, ApJ, 905, 103, doi: 10.3847/1538-4357/abbeff
2020 doi
-
[67]
A., Faber, S
Yan, R., Newman, J. A., Faber, S. M., et al. 2009, MNRAS, 398, 735, doi: 10.1111/j.1365-2966.2009.15192.x
2009
-
[68]
I., Zaritsky, D., & Mihos, J
Yang, Y., Zabludoff, A. I., Zaritsky, D., & Mihos, J. C. 2008, ApJ, 688, 945, doi: 10.1086/591656
2008 doi
-
[69]
I., Zaritsky, D., Lin, H., et al
Zabludoff, A. I., Zaritsky, D., Lin, H., et al. 1996, ApJ, 466, 104, doi: 10.1086/177495
1996 doi
Reviewed August 8, 2026 · model on record in the stance chip above.
Discussion (0). Continue with ORCID to comment.