REVIEW 3 major objections 4 minor 174 references
SDSS-IV MaStar: Quantification and Abatement of Interstellar Absorption in the Largest Empirical Stellar Spectral Library
T0 review · 3 major / 4 minor · reviewed 2026-08-07 · deepseek-v4-flash
Pith's one-line read Milky Way interstellar gas plants spurious calcium and sodium lines in the largest star library, and the paper's cleaned version removes them, shifting galaxy ages, sodium abundances, and mass-function fits.
desk verdict Useful, practical ISM-cleaning of MaStar with one unresolved 3–4 sigma discrepancy between the two replacement methods for hot stars, exactly where the corrections are largest. read the letter →
The pith
A machine-rendered reading of the paper's core claim, the machinery that carries it, and where it could break.
The reading
What carries the argument
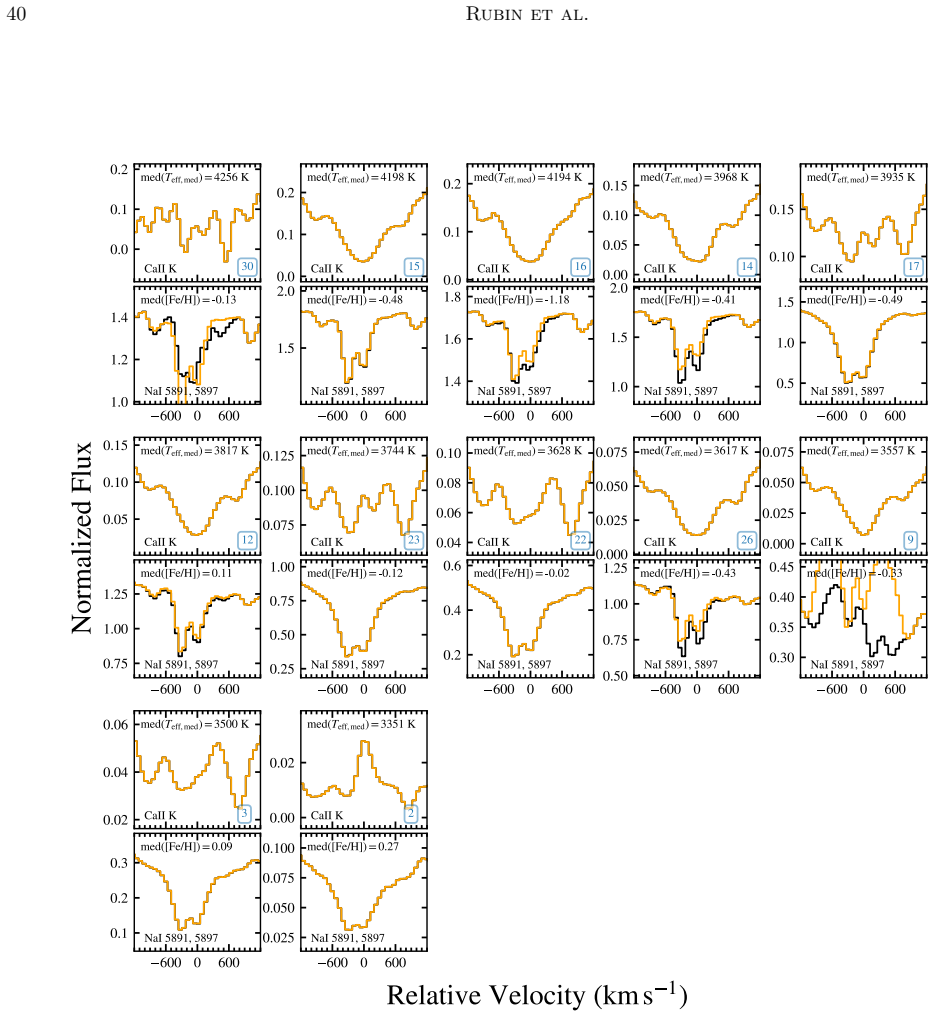
The central mechanism is an empirical scaling law for interstellar contamination: in each of six distance bins, the equivalent width of Ca II K and of each Na I D component is modeled as $W^{\rm ISM} = \beta + \alpha \log E_{\rm DustMap}$, with slope and intercept fit by MCMC likelihoods that include upper limits and intrinsic scatter, anchored to the high-resolution samples of Sembach et al., Munari & Zwitter, and Welsh et al. This predictor converts three readily available stellar quantities — distance, Galactic latitude, and dust reddening — into a predicted contaminating width, which in turn sets the thresholds ($W^{\rm ISM}$(Ca II K) < 0.07 Å, $W^{\rm ISM}$(Na I 5891) < 0.05 Å) that define the 6342-star 'low-ISM' reference sample. Replacement matching runs on a three-dimensional stellar-parameter distance $\Psi$ built from $\log g$, $\theta = 5040\ \mathrm{K}/T_{\rm eff}$, and $[\mathrm{Fe/H}]$; coadded low-ISM spectra are inserted into the windows 3912–3995 Å and 5873–5917 Å with Gaussian-tapered edges, and isolated hot stars instead receive ATLAS9-based BOSZ model profiles. The cleaned spectra are then passed through the established stellar-population construction to produce SSP templates whose line strengths, compared with SSPs built from the original library, quantify the bias.
What would settle it
Re-observe a sample of MaStar stars spanning the predicted contamination range at spectral resolution R ≳ 30,000, where interstellar Ca II and Na I components are narrow and kinematically separated from the broad stellar lines. If the measured interstellar equivalent widths disagree with the model's binned predictions for a substantial fraction of sightlines, or if the paper's 'cleaned' profiles do not match the interstellar-free photospheric lines seen at high resolution, the correction is wrong. A cheap version of this test is the paper's own internal check, in which SSPs built only from low-ISM stars agree with the fully cleaned SSPs at the 3–4% level: any regime where that agreement fails marks where the cleaning breaks down.
Extended reading notes
Core claim
The paper argues that the Milky Way's interstellar medium leaves its own absorption signature inside the MaStar empirical stellar library, and that the signature is large enough to bias galaxy science. At the library's R ~ 1800 resolution, interstellar Ca II λλ3934, 3969 and Na I λλ5891, 5897 absorption is blended into the stellar photospheric profiles of those transitions. The authors construct a model of the interstellar equivalent width as a function of stellar distance, Galactic latitude, and dust reddening, fit as $W^{\rm ISM} = \beta + \alpha \log E_{\rm DustMap}$ in six distance bins using high-resolution literature measurements. Applying this model to all 24,162 MaStar stars selects 6342 stars predicted to have negligible contamination ($W^{\rm ISM}$(Ca II K) < 0.07 Å and $W^{\rm ISM}$(Na I 5891) < 0.05 Å); for the remaining stars with close matches, the Na I D region (and, for stars with $T_{\rm eff} > 9000$ K, the Ca II region too) is replaced with coadded spectra of similar low-contamination stars, and 738 isolated hot stars receive matched ATLAS9-based BOSZ model profiles instead. The result is a cleaned library whose mean $W$(Ca II K) falls by 0.4–0.7 Å and whose mean $W$(Na I D) falls by 0.6–1.1 Å for hot stars ($T_{\rm eff} > 7610$ K) and by 0.1–0.2 Å for cooler stars. Constructed from the original library, simple stellar population models overestimate $W$(Ca II K) by ≥20% at ages below 400 Myr and overestimate the NaD index by ≥50% in starbursting systems and by ≥10% at ages above 10 Gyr. The cleaned stellar spectra, hierarchically clustered templates, and SSP libraries are released as public data products.
Load-bearing premise
The entire cleaning rests on one premise: that the high-resolution calcium and sodium absorption measurements made toward roughly two thousand stellar sightlines, binned by distance and reddening and converted through a dust map, correctly predict the interstellar absorption along every one of the 24,000 MaStar sightlines.
Editorial extensions
If this is right
- Stellar-population fits to young and starbursting galaxies made with the original library underestimate stellar ages, because interstellar Ca II K mimics the strong calcium absorption that diagnoses A-type stars.
- [Na/Fe] estimates in early-type galaxies from the NaD Lick index are systematically low by roughly 0.1–0.2 dex, and the paper argues the true sodium enhancement of massive ellipticals may reach +0.7 to +1.0 dex.
- Spectroscopic IMF-slope constraints anchored on Na I transitions shift toward less bottom-heavy (more Milky Way-like) slopes once templates are corrected, and lower-mass ellipticals may move toward bottom-light slopes.
- Down-the-barrel studies of Na I D as a tracer of galactic winds will overestimate the stellar contribution and underestimate the host-galaxy interstellar component in starbursts.
- The public cleaned spectra, hierarchical cluster templates, and SSP libraries let existing galaxy surveys be re-fit without new observations, putting a quantitative bound on this systematic for each survey.
Reading between the lines
- Editorial inference: the same contamination model could be applied to other moderate-resolution empirical libraries, re-deriving the NaD–[Na/Fe] calibration from a contamination-free sample to test how much the index–abundance slope shifts.
- Editorial inference: the distance binning smooths over small-scale structure (the paper itself notes an absorbing 'wall' at 80 pc), so the model will be least reliable toward dense clouds and the Galactic plane; a version using the full 3D dust map rather than binned medians would directly test how often stars near such clouds are misclassified as low-ISM.
- Editorial inference: the predicted interstellar widths for all 24,162 stars form a statistical absorption map of the local Milky Way that the paper does not exploit; cross-correlating these widths with known cloud and gas catalogs could calibrate Ca II and Na I columns against dust and 21 cm emission.
Editorial analysis
A structured set of objections, weighed in public.
Referee Report
Summary. The paper assesses the impact of Milky Way interstellar Ca II and Na I absorption on the SDSS-IV MaStar empirical stellar library. The authors build a model for W_ISM as a function of distance, Galactic latitude, and dust reddening from high-resolution literature samples (Sembach et al. 1993; Munari & Zwitter 1997; Welsh et al. 2010), apply it to 24,162 MaStar stars, identify 6,342 low-ISM sightlines, and replace the Ca II and Na I D profiles of 12,110 stars with coadded low-ISM spectra and of 738 hot stars with BOSZ theoretical templates. They release cleaned stellar spectra, hierarchically clustered templates, and SSP templates, and quantify the artificial enhancement of Ca II K and NaD indices in SSP models built from the original library.
Significance. If the cleaning procedure is reliable, this is a valuable data product: it would remove a previously unquantified Milky Way ISM contamination from the largest empirical stellar library, with direct consequences for galaxy spectral fitting and stellar population synthesis. The public releases of cleaned spectra, HC templates, and SSP templates are concrete strengths, and the demonstration that NaD enhancements persist at the >10% level at old ages is an important, falsifiable result. The paper also contains a careful treatment of telluric contamination (Appendix A). The significance is conditional on resolving a 3-4 sigma disagreement between the empirical and theoretical cleaning methods for hot stars, which is the central load-bearing issue.
major comments (3)
- [Section 3.3, Figure 14] This is a major comment.
- [Section 2.2-2.3] This is a major comment.
- [Section 3.6.4] This is a major comment.
minor comments (4)
- [Table 3 and Section 3.4] This is a minor comment.
- [Section 3.5] This is a minor comment.
- [Figure 13] This is a minor comment.
- [Equation (1) and Section 2.2] This is a minor comment.
Circularity Check
No central circularity: the ISM model is externally calibrated and the cleaning reduces to a measured spectral replacement; however, one self-referential robustness check and an unresolved BOSZ/coadd offset qualify the validation.
-
self definitional
[Section 3.6.4, Fig. 17]
"To test the robustness of our cleaning procedure, we have constructed an additional set of SSP templates using only our original “low-ISM” sample of stars. ... These profiles are very similar, and in some cases nearly identical, to those of the cleaned templates. ... We conclude from this comparison that our procedure for ISM removal is indeed robust, and does not introduce unwanted artifacts into our final cleaned SSP templates."
The cleaned SSPs are built from spectra whose Ca II/Na I regions have been replaced with coadds of the low-ISM stars, while the comparison SSPs are constructed directly from those same low-ISM stars. Both template sets therefore draw on the identical low-ISM pool, so near-identical Na I D profiles are expected by construction rather than being an independent confirmation that the low-ISM sample is genuinely free of interstellar absorption. Presenting this agreement as evidence that the cleaning is robust overstates its evidentiary value: it mainly checks the internal bookkeeping of the replacement procedure, not whether the model-selected low-ISM profiles are truly intrinsic.
full rationale
The central cleaning claim does not reduce to its inputs. The W_ISM model is primarily calibrated to high-resolution external literature sightlines (Sembach et al. 1993; Munari & Zwitter 1997; Welsh et al. 2010), with MaStar hot-star measurements included as supplementary data points in the fits; applying the resulting relation to MaStar is a standard calibration exercise rather than a definitional derivation. The reported reductions in W(Ca II K) and W(NaI D) are measured differences between original spectra and the replacement coadds or BOSZ models, not fitted parameters renamed as predictions. Likewise, the SSP enhancements are computed by comparing original and cleaned SSPs; they are not algebraically forced to equal the model's W_ISM. The internal robustness check in Section 3.6.4 is self-referential, as noted above, but it is not the central claim. The paper itself flags an unresolved 3–4σ offset between BOSZ and empirical low-ISM coadds for the eleven hottest stars in Section 3.3, with opposite interpretations that would shift the cleaned products in opposite directions; this is a correctness risk, not evidence of circular derivation. Self-citations to Lazarz et al. (2022) and Maraston et al. (2020) are externally published methodological inputs and are not used to forbid alternatives or to define the target result. Overall, the derivation is substantially independent even though one validation step is partly tautological.
Assumptions & free parameters
free parameters (14)
- alpha_CaIIK_six_bins =
0.01, 0.05, -0.01, 0.22, 0.36, 0.17 Angstrom per log E_DustMap
- beta_CaIIK_six_bins =
0.04, 0.14, 0.12, 0.40, 0.57, 0.57 Angstrom
- sigma_intr_CaIIK_six_bins =
0.03, 0.09, 0.12, 0.08, 0.06, 0.13 Angstrom
- alpha_NaI5891_six_bins =
0.03, 0.11, 0.12, 0.60, 0.68, 0.66 Angstrom per log E_DustMap
- beta_NaI5891_six_bins =
0.17, 0.29, 0.35, 0.84, 0.99, 0.98 Angstrom
- sigma_intr_NaI5891_six_bins =
0.09, 0.10, 0.17, 0.13, 0.11, 0.17 Angstrom
- alpha_NaI5897_six_bins =
0.04, 0.12, 0.16, 0.54, 0.60, 0.63 Angstrom per log E_DustMap
- beta_NaI5897_six_bins =
0.15, 0.26, 0.35, 0.71, 0.84, 0.83 Angstrom
- sigma_intr_NaI5897_six_bins =
0.07, 0.08, 0.14, 0.11, 0.09, 0.13 Angstrom
- Distance bin boundaries =
0.0, 0.2, 0.4, 1.0, 2.0, 4.0, 20.0 kpc
- Low-ISM threshold for CaII K =
0.07 Angstrom
- Low-ISM threshold for NaI 5891 =
0.05 Angstrom
- Supersolar low-ISM thresholds =
0.4 Angstrom (CaII K), 0.15 Angstrom (NaI 5891)
- Psi replacement thresholds =
0.2 with N>=10, 0.6 with N>=5, 1.0 with N>=1
assumptions (7)
- domain assumption The literature samples of Sembach et al. (1993), Munari & Zwitter (1997), and Welsh et al. (2010) are representative of interstellar CaII and NaI absorption toward all MaStar sightlines after distance and reddening scaling.
- domain assumption The Green et al. (2019) 3D dust map and the Lazarz et al. (2022) relation AV = 3.31 E_DustMap - 0.076 give accurate reddening and extinction for every MaStar star.
- domain assumption Stars with similar Teff, log g, and [Fe/H] have statistically interchangeable CaII and NaI D profiles.
- domain assumption BOSZ/ATLAS9 theoretical spectra correctly predict intrinsic CaII and NaI D profiles for Teff > 9000 K.
- domain assumption MaStar median stellar parameters and Gaia EDR3 photogeometric distances are sufficiently accurate for parameter matching.
- domain assumption Telluric absorption near NaI D is negligible for most sightlines.
- standard math Affine-invariant MCMC sampling and Gaussian likelihoods yield unbiased parameter estimates for the W_ISM relations.
Cite this review
Pith. "Pith review of SDSS-IV MaStar: Quantification and Abatement of Interstellar Absorption in the Largest Empirical Stellar Spectral Library." pith.science (2026). https://pith.science/paper/NRMGPBDV
@misc{pith2026250209707,
  author       = {Pith},
  title        = {Pith review of: SDSS-IV MaStar: Quantification and Abatement of Interstellar Absorption in the Largest Empirical Stellar Spectral Library},
  year         = {2026},
  howpublished = {\url{https://pith.science/paper/NRMGPBDV}},
  note         = {Machine review of arXiv:2502.09707}
}
abstract
We assess the impact of CaII 3934,3969 and NaI 5891,5897 absorption arising in the interstellar medium (ISM) on the SDSS-IV MaNGA Stellar Library (MaStar) and produce corrected spectroscopy for 80% of the 24,162-star catalog. We model the absorption strength of these transitions as a function of stellar distance, Galactic latitude, and dust reddening based upon high-spectral resolution studies. With this model, we identify 6342 MaStar stars that have negligible ISM absorption ($W^\mathrm{ISM}$(CaII K) $<0.07$ Ang and $W^\mathrm{ISM}$(NaI 5891) $<0.05$ Ang). For 12,110 of the remaining stars, we replace their NaI D profile (and their CaII profile for effective temperatures $T_{\rm eff}>9000$ K) with a coadded spectrum of low-ISM stars with similar $T_{\rm eff}$, surface gravity, and metallicity. For 738 additional stars with $T_{\rm eff}>9000$ K, we replace these spectral regions with a matching ATLAS9-based BOSZ model. This results in a mean reduction in $W$(CaII K) ($W$(NaI D)) of $0.4-0.7$ Ang ($0.6-1.1$ Ang) for hot stars ($T_{\rm eff}>7610$ K), and a mean reduction in $W$(NaI D) of $0.1-0.2$ Ang for cooler stars. We show that interstellar absorption in simple stellar population (SSP) model spectra constructed from the original library artificially enhances $W$(CaII K) by $\gtrsim20\%$ at young ages ($<400$ Myr); dramatically enhances the strength of stellar NaI D in starbursting systems (by ${\gtrsim}50\%$); and enhances stellar NaI D in older stellar populations (${\gtrsim}10$ Gyr) by ${\gtrsim}10\%$. We provide SSP spectra constructed from the cleaned library, and discuss the implications of these effects for stellar population synthesis analyses constraining stellar age, [Na/Fe] abundance, and the initial mass function.
Figures


Figures from the paper (24 more)


Reference graph
Works this paper leans on
-
[1]
2022, ApJS, 259, 35, doi: 10.3847/1538-4365/ac4414
Abdurro’uf, Accetta, K., Aerts, C., et al. 2022, ApJS, 259, 35, doi: 10.3847/1538-4365/ac4414
-
[2]
Alatalo, K., Davis, T. A., Bureau, M., et al. 2013, MNRAS, 432, 1796, doi: 10.1093/mnras/sts299
-
[3]
Alton, P. D., Smith, R. J., & Lucey, J. R. 2017, MNRAS, 468, 1594, doi: 10.1093/mnras/stx464
-
[4]
R., Wuyts, S., F¨ orster Schreiber, N
Avery, C. R., Wuyts, S., F¨ orster Schreiber, N. M., et al. 2022, MNRAS, 511, 4223, doi: 10.1093/mnras/stac190
-
[5]
2021, AJ, 161, 147, doi: 10.3847/1538-3881/abd806
Demleitner, M., & Andrae, R. 2021, AJ, 161, 147, doi: 10.3847/1538-3881/abd806
-
[6]
2016, ApJ, 832, 8, doi: 10.3847/0004-637X/832/1/8
Baron, D., Stern, J., Poznanski, D., & Netzer, H. 2016, ApJ, 832, 8, doi: 10.3847/0004-637X/832/1/8
-
[7]
2017, MNRAS, 469, 151, doi: 10.1093/mnras/stx789
Belfiore, F., Maiolino, R., Tremonti, C., et al. 2017, MNRAS, 469, 151, doi: 10.1093/mnras/stx789
-
[8]
Belfiore, F., Westfall, K. B., Schaefer, A., et al. 2019, AJ, 158, 160, doi: 10.3847/1538-3881/ab3e4e Ben Bekhti, N., Richter, P., Westmeier, T., & Murphy, M. T. 2008, A&A, 487, 583, doi: 10.1051/0004-6361:20079067 Ben Bekhti, N., Winkel, B., Richter, P., et al. 2012, A&A, 542, A110, doi: 10.1051/0004-6361/201118673
Show all 174 references
-
[9]
Bensby, T., Feltzing, S., & Oey, M. S. 2014, A&A, 562, A71, doi: 10.1051/0004-6361/201322631
2014 doi
-
[10]
2017, A&A, 605, A89, doi: 10.1051/0004-6361/201730560
Bensby, T., Feltzing, S., Gould, A., et al. 2017, A&A, 605, A89, doi: 10.1051/0004-6361/201730560
2017 doi
-
[11]
R., & Lane, R
Brownstein, J. R., & Lane, R. R. 2023, MNRAS, 518, 4713, doi: 10.1093/mnras/stac3287
2023 doi
-
[12]
2006, AJ, 131, 1288, doi: 10.1086/499522
Brinkmann, J. 2006, AJ, 131, 1288, doi: 10.1086/499522
2006 doi
-
[13]
V., Werk, J
Bish, H. V., Werk, J. K., Prochaska, J. X., et al. 2019, ApJ, 882, 76, doi: 10.3847/1538-4357/ab3414
2019 doi
-
[14]
V., Croom, S
Bloom, J. V., Croom, S. M., Bryant, J. J., et al. 2017, MNRAS, 472, 1809, doi: 10.1093/mnras/stx1701
2017 doi
-
[15]
C., M´ esz´ aros, S., Fleming, S
Bohlin, R. C., M´ esz´ aros, S., Fleming, S. W., et al. 2017, AJ, 153, 234, doi: 10.3847/1538-3881/aa6ba9
2017 doi
-
[16]
B., Chilingarian, I
Borisov, S. B., Chilingarian, I. V., Rubtsov, E. V., et al. 2023, ApJS, 266, 11, doi: 10.3847/1538-4365/acc321
2023 doi
-
[17]
Bruzual, A. G. 1983, ApJ, 273, 105, doi: 10.1086/161352
1983 doi
-
[19]
J., Croom, S
Bryant, J. J., Croom, S. M., van de Sande, J., et al. 2019, MNRAS, 483, 458, doi: 10.1093/mnras/sty3122
2019 doi
-
[20]
A., Law, D
Bundy, K., Bershady, M. A., Law, D. R., et al. 2015, ApJ, 798, 7, doi: 10.1088/0004-637X/798/1/7
2015 doi
-
[21]
M., Gaskell, C
Burstein, D., Faber, S. M., Gaskell, C. M., & Krumm, N. 1984, ApJ, 287, 586, doi: 10.1086/162718
1984 doi
-
[22]
M., & Gonzalez, J
Burstein, D., Faber, S. M., & Gonzalez, J. J. 1986, AJ, 91, 1130, doi: 10.1086/114090
1986 doi
-
[23]
M., & Stanway, E
Byrne, C. M., & Stanway, E. R. 2023, MNRAS, 521, 4995, doi: 10.1093/mnras/stad832
2023 doi
-
[24]
2016, ARA&A, 54, 597, doi: 10.1146/annurev-astro-082214-122432 —
Cappellari, M. 2016, ARA&A, 54, 597, doi: 10.1146/annurev-astro-082214-122432 —. 2017, MNRAS, 466, 798, doi: 10.1093/mnras/stw3020
2016 doi
-
[26]
M., Alatalo, K., et al
Cappellari, M., McDermid, R. M., Alatalo, K., et al. 2012, Nature, 484, 485, doi: 10.1038/nature10972
2012 doi
- [27]
-
[29]
1997b, MNRAS, 290, 515, doi: 10.1093/mnras/290.3.515
Cassisi, S., degl’Innocenti, S., & Salaris, M. 1997b, MNRAS, 290, 515, doi: 10.1093/mnras/290.3.515
-
[30]
Castelli, F., & Kurucz, R. L. 2003, in Modelling of Stellar Atmospheres, ed. N. Piskunov, W. W. Weiss, & D. F
2003
- [31]
-
[32]
2014, A&A, 569, A14, doi: 10.1051/0004-6361/201323296
Cazzoli, S., Arribas, S., Colina, L., et al. 2014, A&A, 569, A14, doi: 10.1051/0004-6361/201323296
2014 doi
-
[33]
E., Gauthier, J.-R., et al
Chen, H.-W., Helsby, J. E., Gauthier, J.-R., et al. 2010a, ApJ, 714, 1521, doi: 10.1088/0004-637X/714/2/1521
-
[34]
A., Heckman, T
Chen, Y.-M., Tremonti, C. A., Heckman, T. M., et al. 2010b, AJ, 140, 445, doi: 10.1088/0004-6256/140/2/445
-
[35]
C., Peletier, R
Chen, Y.-P., Trager, S. C., Peletier, R. F., et al. 2014, A&A, 565, A117, doi: 10.1051/0004-6361/201322505
2014 doi
-
[36]
2020, ApJ, 899, 62, doi: 10.3847/1538-4357/ab9f35 Cid Fernandes, R., Mateus, A., Sodr´ e, L., Stasi´ nska, G., &
Chen, Y.-P., Yan, R., Maraston, C., et al. 2020, ApJ, 899, 62, doi: 10.3847/1538-4357/ab9f35 Cid Fernandes, R., Mateus, A., Sodr´ e, L., Stasi´ nska, G., &
2020 doi
-
[39]
A., Iacono, M
Clough, S. A., Iacono, M. J., & Moncet, J.-L. 1992, J. Geophys. Res., 97, 15,761, doi: 10.1029/92JD01419
1992 doi
-
[40]
A., Shephard, M
Clough, S. A., Shephard, M. W., Mlawer, E. J., et al. 2005, JQSRT, 91, 233, doi: 10.1016/j.jqsrt.2004.05.058
2005 doi
-
[41]
Castilho, B. V. 2005, A&A, 443, 735, doi: 10.1051/0004-6361:20053511
2005 doi
-
[42]
Coelho, P. R. T. 2014, MNRAS, 440, 1027, doi: 10.1093/mnras/stu365
2014 doi
-
[43]
2019, A&A, 622, A188, doi: 10.1051/0004-6361/201732152 42 Rubin et al
Thomas, D. 2019, A&A, 622, A188, doi: 10.1051/0004-6361/201732152 42 Rubin et al
2019 doi
-
[44]
2013, ARA&A, 51, 393, doi: 10.1146/annurev-astro-082812-141017
Conroy, C. 2013, ARA&A, 51, 393, doi: 10.1146/annurev-astro-082812-141017
2013 doi
-
[45]
J., & van Dokkum, P
Conroy, C., Graves, G. J., & van Dokkum, P. G. 2014, ApJ, 780, 33, doi: 10.1088/0004-637X/780/1/33
2014 doi
-
[46]
2012a, ApJ, 747, 69, doi: 10.1088/0004-637X/747/1/69
Conroy, C., & van Dokkum, P. 2012a, ApJ, 747, 69, doi: 10.1088/0004-637X/747/1/69
-
[47]
Conroy, C., & van Dokkum, P. G. 2012b, ApJ, 760, 71, doi: 10.1088/0004-637X/760/1/71
-
[48]
G., & Lind, K
Conroy, C., Villaume, A., van Dokkum, P. G., & Lind, K. 2018, ApJ, 854, 139, doi: 10.3847/1538-4357/aaab49
2018 doi
-
[49]
J., & Sharples, R
Couch, W. J., & Sharples, R. M. 1987, MNRAS, 229, 423, doi: 10.1093/mnras/229.3.423
1987 doi
-
[50]
Crawford, I. A. 1992, MNRAS, 259, 47, doi: 10.1093/mnras/259.1.47
1992 doi
-
[51]
Crowther, P. A. 2022, arXiv e-prints, arXiv:2207.08690. https://arxiv.org/abs/2207.08690
2022 arXiv
-
[52]
A., Greene, J
Davis, T. A., Greene, J. E., Ma, C.-P., et al. 2019, MNRAS, 486, 1404, doi: 10.1093/mnras/stz871
2019 doi
-
[53]
A., Alatalo, K., Bureau, M., et al
Davis, T. A., Alatalo, K., Bureau, M., et al. 2013, MNRAS, 429, 534, doi: 10.1093/mnras/sts353 den Brok, M., Krajnovi´ c, D., Emsellem, E., et al. 2024, MNRAS, 530, 3278, doi: 10.1093/mnras/stae912
2013 doi
-
[54]
Dressler, A., & Gunn, J. E. 1983, ApJ, 270, 7, doi: 10.1086/161093
1983 doi
-
[55]
J., Stanway, E
Eldridge, J. J., Stanway, E. R., Xiao, L., et al. 2017, PASA, 34, e058, doi: 10.1017/pasa.2017.51
2017 doi
-
[56]
Faber, S. M. 1972, A&A, 20, 361
1972
- [57]
-
[58]
Feldmeier-Krause, A., Lonoce, I., & Freedman, W. L. 2021, ApJ, 923, 65, doi: 10.3847/1538-4357/ac281e
2021 doi
-
[59]
Clayton, G. C. 2019, ApJ, 886, 108, doi: 10.3847/1538-4357/ab4c3a
2019 doi
-
[60]
W., Lang, D., & Goodman, J
Foreman-Mackey, D., Hogg, D. W., Lang, D., & Goodman, J. 2013, PASP, 125, 306, doi: 10.1086/670067
2013 doi
-
[61]
1990, ApJL, 359, L41, doi: 10.1086/185791 Gaia Collaboration, Schultheis, M., Zhao, H., et al
Franx, M., & Illingworth, G. 1990, ApJL, 359, L41, doi: 10.1086/185791 Gaia Collaboration, Schultheis, M., Zhao, H., et al. 2023a, A&A, 680, A38, doi: 10.1051/0004-6361/202347103 Gaia Collaboration, Vallenari, A., Brown, A. G. A., et al. 2023b, A&A, 674, A1, doi: 10.1051/0004-...
1990 doi
-
[62]
2000, A&AS, 141, 371, doi: 10.1051/aas:2000126
Girardi, L., Bressan, A., Bertelli, G., & Chiosi, C. 2000, A&AS, 141, 371, doi: 10.1051/aas:2000126
2000 doi
-
[63]
2017, MNRAS, 466, 4731, doi: 10.1093/mnras/stw3371 Gonz´ alez Delgado, R
Goddard, D., Thomas, D., Maraston, C., et al. 2017, MNRAS, 466, 4731, doi: 10.1093/mnras/stw3371 Gonz´ alez Delgado, R. M., P´ erez, E., Cid Fernandes, R., et al. 2014, A&A, 562, A47, doi: 10.1051/0004-6361/201322011 Gonz´ alez Delgado, R. M., Garc ´ ıa-Benito, R., P´ erez, E....
2017 doi
-
[64]
2022, Journal of Quantitative Spectroscopy and Radiative Transfer, 277, 107949, doi: https://doi.org/10.1016/j.jqsrt.2021.107949
Gordon, I., Rothman, L., Hargreaves, R., et al. 2022, Journal of Quantitative Spectroscopy and Radiative Transfer, 277, 107949, doi: https://doi.org/10.1016/j.jqsrt.2021.107949
2022
-
[65]
2018, The Journal of Open Source Software, 3, 695, doi: 10.21105/joss.00695
Green, G. 2018, The Journal of Open Source Software, 3, 695, doi: 10.21105/joss.00695
2018 doi
-
[66]
2019, ApJ, 887, 93, doi: 10.3847/1538-4357/ab5362
Finkbeiner, D. 2019, ApJ, 887, 93, doi: 10.3847/1538-4357/ab5362
2019 doi
-
[67]
E., Janish, R., Ma, C.-P., et al
Greene, J. E., Janish, R., Ma, C.-P., et al. 2015, ApJ, 807, 11, doi: 10.1088/0004-637X/807/1/11
2015 doi
-
[68]
E., Newman, A
Gu, M., Greene, J. E., Newman, A. B., et al. 2022, ApJ, 932, 103, doi: 10.3847/1538-4357/ac69ea
2022 doi
-
[69]
1987, A&A, 186, 1
Guiderdoni, B., & Rocca-Volmerange, B. 1987, A&A, 186, 1
1987
-
[70]
Habets, G. M. H. J., & Heintze, J. R. W. 1981, A&AS, 46, 193
1981
-
[71]
1904, ApJ, 19, 268, doi: 10.1086/141112
Hartmann, J. 1904, ApJ, 19, 268, doi: 10.1086/141112
1904 doi
-
[72]
2000, ApJS, 129, 493, doi: 10.1086/313421
Armus, L. 2000, ApJS, 129, 493, doi: 10.1086/313421
2000 doi
-
[73]
2022, MNRAS, 509, 4308, doi: 10.1093/mnras/stab3263
Hill, L., Thomas, D., Maraston, C., et al. 2022, MNRAS, 509, 4308, doi: 10.1093/mnras/stab3263
2022 doi
-
[74]
T., Kudritzki, R.-P., Kewley, L
Ho, I. T., Kudritzki, R.-P., Kewley, L. J., et al. 2015, MNRAS, 448, 2030, doi: 10.1093/mnras/stv067
2015 doi
-
[75]
Hobbs, L. M. 1969, ApJ, 158, 461, doi: 10.1086/150210 —. 1974, ApJ, 191, 381, doi: 10.1086/152976
1969 doi
-
[76]
C., Sembach, K
Howk, J. C., Sembach, K. R., & Savage, B. D. 2003, ApJ, 586, 249, doi: 10.1086/346262
2003 doi
-
[77]
A., Yan, R., et al
Imig, J., Holtzman, J. A., Yan, R., et al. 2022, AJ, 163, 56, doi: 10.3847/1538-3881/ac3ca7
2022 doi
-
[81]
I., & Lugaro, M
Kobayashi, C., Karakas, A. I., & Lugaro, M. 2020, ApJ, 900, 179, doi: 10.3847/1538-4357/abae65
2020 doi
-
[82]
2006, ApJ, 653, 1145, doi: 10.1086/508914
Ohkubo, T. 2006, ApJ, 653, 1145, doi: 10.1086/508914
2006 doi
-
[83]
K., et al
Kos, J., Zwitter, T., Grebel, E. K., et al. 2013, ApJ, 778, 86, doi: 10.1088/0004-637X/778/2/86
2013 doi
-
[84]
2000, MNRAS, 315, 184, doi: 10.1046/j.1365-8711.2000.03377.x SDSS-IV MaStar: Removal of Interstellar Absorption 43
Kuntschner, H. 2000, MNRAS, 315, 184, doi: 10.1046/j.1365-8711.2000.03377.x SDSS-IV MaStar: Removal of Interstellar Absorption 43
2000
-
[85]
Kurucz, R. L. 1993, SYNTHE spectrum synthesis programs and line data —. 2011, Canadian Journal of Physics, 89, 417, doi: 10.1139/p10-104 La Barbera, F., Ferreras, I., Vazdekis, A., et al. 2013, MNRAS, 433, 3017, doi: 10.1093/mnras/stt943 La Barbera, F., Vazdekis, A., Ferreras,...
1993 doi
-
[86]
1993, A&A, 271, 734
Lallement, R., Bertin, P., Chassefiere, E., & Scott, N. 1993, A&A, 271, 734
1993
-
[87]
R., Belfiore, F., Bershady, M
Law, D. R., Belfiore, F., Bershady, M. A., et al. 2022, ApJ, 928, 58, doi: 10.3847/1538-4357/ac5620
2022 doi
-
[88]
2022, A&A, 668, A21, doi: 10.1051/0004-6361/202243701 Le Borgne, J
Lazarz, D., Yan, R., Wilhelm, R., et al. 2022, A&A, 668, A21, doi: 10.1051/0004-6361/202243701 Le Borgne, J. F., Bruzual, G., Pell´ o, R., et al. 2003, A&A, 402, 433, doi: 10.1051/0004-6361:20030243
2022 doi
-
[89]
Lehner, N., & Howk, J. C. 2011, Science, 334, 955, doi: 10.1126/science.1209069
2011 doi
-
[90]
Leitherer, C., & Heckman, T. M. 1995, ApJS, 96, 9, doi: 10.1086/192112
1995 doi
-
[91]
1997, A&AS, 125, 229, doi: 10.1051/aas:1997373
Lejeune, T., Cuisinier, F., & Buser, R. 1997, A&AS, 125, 229, doi: 10.1051/aas:1997373
1997 doi
-
[92]
J., & Rose, J
Leonardi, A. J., & Rose, J. A. 1996, AJ, 111, 182, doi: 10.1086/117772 —. 2003, AJ, 126, 1811, doi: 10.1086/377617 Le´ sniewska, A., Micha lowski, M. J., Gall, C., et al. 2023, ApJ, 953, 27, doi: 10.3847/1538-4357/acdcfc
1996 doi
-
[93]
L., & Feldmeier-Krause, A
Lonoce, I., Freedman, W. L., & Feldmeier-Krause, A. 2023, ApJ, 948, 65, doi: 10.3847/1538-4357/acc025
2023 doi
-
[94]
2016, MNRAS, 463, 3220, doi: 10.1093/mnras/stw2434
Lyubenova, M., Mart ´ ın-Navarro, I., van de Ven, G., et al. 2016, MNRAS, 463, 3220, doi: 10.1093/mnras/stw2434
2016 doi
-
[95]
2024, MNRAS, 531, 2864, doi: 10.1093/mnras/stae1318
Maksymowicz-Maciata, M., Spiniello, C., Mart ´ ın-Navarro, I., et al. 2024, MNRAS, 531, 2864, doi: 10.1093/mnras/stae1318
2024 doi
-
[96]
1998, MNRAS, 300, 872, doi: 10.1046/j.1365-8711.1998.01947.x —
Maraston, C. 1998, MNRAS, 300, 872, doi: 10.1046/j.1365-8711.1998.01947.x —. 2005, MNRAS, 362, 799, doi: 10.1111/j.1365-2966.2005.09270.x
1998
-
[97]
2009, A&A, 493, 425, doi: 10.1051/0004-6361:20066907
Thomas, D. 2009, A&A, 493, 425, doi: 10.1051/0004-6361:20066907
2009 doi
-
[99]
2020, MNRAS, 496, 2962, doi: 10.1093/mnras/staa1489 Mart ´ ın-Navarro, I., La Barbera, F., Vazdekis, A., Falc´ on-Barroso, J., & Ferreras, I
Maraston, C., Hill, L., Thomas, D., et al. 2020, MNRAS, 496, 2962, doi: 10.1093/mnras/staa1489 Mart ´ ın-Navarro, I., La Barbera, F., Vazdekis, A., Falc´ on-Barroso, J., & Ferreras, I. 2015, MNRAS, 447, 1033, doi: 10.1093/mnras/stu2480 Mart ´ ın-Navarro, I., Spiniello, C., Tor...
2020 doi
-
[100]
J., Lu, J
McConnell, N. J., Lu, J. R., & Mann, A. W. 2016, ApJ, 821, 39, doi: 10.3847/0004-637X/821/1/39
2016 doi
-
[101]
2003, A&A, 407, 423, doi: 10.1051/0004-6361:20030886 M´ esz´ aros, S., Allende Prieto, C., Edvardsson, B., et al
Wegner, G. 2003, A&A, 407, 423, doi: 10.1051/0004-6361:20030886 M´ esz´ aros, S., Allende Prieto, C., Edvardsson, B., et al. 2012, AJ, 144, 120, doi: 10.1088/0004-6256/144/4/120
2003 doi
-
[102]
1997, A&A, 318, 269 M¨ unch, G., & Zirin, H
Munari, U., & Zwitter, T. 1997, A&A, 318, 269 M¨ unch, G., & Zirin, H. 1961, ApJ, 133, 11, doi: 10.1086/146999
1997 doi
-
[103]
2015, MNRAS, 452, 511, doi: 10.1093/mnras/stv1277
Murga, M., Zhu, G., M´ enard, B., & Lan, T.-W. 2015, MNRAS, 452, 511, doi: 10.1093/mnras/stv1277
2015 doi
-
[104]
2021, MNRAS, 508, 4844, doi: 10.1093/mnras/stab286810.48550/arXiv.2109.11564 O’Connell, R
Neumann, J., Thomas, D., Maraston, C., et al. 2021, MNRAS, 508, 4844, doi: 10.1093/mnras/stab286810.48550/arXiv.2109.11564 O’Connell, R. W. 1976, ApJ, 206, 370, doi: 10.1086/154392
2021
-
[105]
2006, MNRAS, 365, 46, doi: 10.1111/j.1365-2966.2005.09182.x
Ocvirk, P., Pichon, C., Lan¸ con, A., & Thi´ ebaut, E. 2006, MNRAS, 365, 46, doi: 10.1111/j.1365-2966.2005.09182.x
2006
-
[107]
2024, MNRAS, 528, 7338, doi: 10.1093/mnras/stae448
Parikh, T., Saglia, R., Thomas, J., et al. 2024, MNRAS, 528, 7338, doi: 10.1093/mnras/stae448
2024 doi
-
[108]
2021, MNRAS, 502, 5508, doi: 10.1093/mnras/stab449 —
Parikh, T., Thomas, D., Maraston, C., et al. 2021, MNRAS, 502, 5508, doi: 10.1093/mnras/stab449 —. 2018, MNRAS, 477, 3954, doi: 10.1093/mnras/sty785 —. 2019, MNRAS, 483, 3420, doi: 10.1093/mnras/sty3339
2021 doi
-
[109]
W., Robert, C., et al
Pellerin, A., Fullerton, A. W., Robert, C., et al. 2002, ApJS, 143, 159, doi: 10.1086/342268 P´ erez, E., Cid Fernandes, R., Gonz´ alez Delgado, R. M., et al. 2013, ApJL, 764, L1, doi: 10.1088/2041-8205/764/1/L1
2002 doi
-
[110]
2020, A&A, 643, A139, doi: 10.1051/0004-6361/202038328
Perna, M., Arribas, S., Catal´ an-Torrecilla, C., et al. 2020, A&A, 643, A139, doi: 10.1051/0004-6361/202038328
2020 doi
-
[111]
2021, A&A, 646, A101, doi: 10.1051/0004-6361/202039702
Perna, M., Arribas, S., Pereira Santaella, M., et al. 2021, A&A, 646, A101, doi: 10.1051/0004-6361/202039702
2021 doi
-
[112]
P., Pettini, M., & Gondhalekar, P
Phillips, A. P., Pettini, M., & Gondhalekar, P. M. 1984, MNRAS, 206, 337, doi: 10.1093/mnras/206.2.337
1984 doi
-
[113]
M., Simon, J
Phillips, M. M., Simon, J. D., Morrell, N., et al. 2013, ApJ, 779, 38, doi: 10.1088/0004-637X/779/1/38
2013 doi
-
[114]
Pickles, A. J. 1985, ApJ, 296, 340, doi: 10.1086/163454
1985 doi
-
[116]
2012, A&A, 545, A21, doi: 10.1051/0004-6361/201219284
Puspitarini, L., & Lallement, R. 2012, A&A, 545, A21, doi: 10.1051/0004-6361/201219284
2012 doi
-
[117]
1986, in Astrophysics and Space Science Library, Vol
Renzini, A., & Buzzoni, A. 1986, in Astrophysics and Space Science Library, Vol. 122, Spectral Evolution of Galaxies, ed. C. Chiosi & A. Renzini, 195–231, doi: 10.1007/978-94-009-4598-2 19 44 Rubin et al
1986 doi
-
[118]
Murphy, M. T. 2011, A&A, 528, A12, doi: 10.1051/0004-6361/201015566
2011 doi
-
[119]
D., Wakker, B
Richter, P., Savage, B. D., Wakker, B. P., Sembach, K. R., & Kalberla, P. M. W. 2001a, ApJ, 549, 281, doi: 10.1086/319070
-
[120]
R., Wakker, B
Richter, P., Sembach, K. R., Wakker, B. P., et al. 2001b, ApJ, 559, 318, doi: 10.1086/322401
-
[121]
2003, ApJS, 144, 21, doi: 10.1086/344478
Robert, C., Pellerin, A., Aloisi, A., et al. 2003, ApJS, 144, 21, doi: 10.1086/344478
2003 doi
-
[122]
P., Chopin, N., & Rousseau, J
Robert, C. P., Chopin, N., & Rousseau, J. 2009, Statistical Science, 24, 141 , doi: 10.1214/09-STS284
2009 doi
-
[123]
W., & Saintonge, A
Roberts-Borsani, G. W., & Saintonge, A. 2019, MNRAS, 482, 4111, doi: 10.1093/mnras/sty2824
2019 doi
-
[124]
Stark, D. V. 2020, MNRAS, 493, 3081, doi: 10.1093/mnras/staa464 Rodr ´ ıguez-Merino, L. H., Chavez, M., Bertone, E., &
2020 doi
-
[125]
2005, ApJ, 626, 411, doi: 10.1086/429858
Buzzoni, A. 2005, ApJ, 626, 411, doi: 10.1086/429858
2005 doi
-
[126]
R., & Yan, R
Roig, B., Blanton, M. R., & Yan, R. 2015, ApJ, 808, 26, doi: 10.1088/0004-637X/808/1/26
2015 doi
-
[127]
Rose, J. A. 1985, AJ, 90, 1927, doi: 10.1086/113898
1985 doi
-
[128]
Crighton, N. H. M., & Moustakas, J. 2018, ApJ, 853, 95, doi: 10.3847/1538-4357/aa9792
2018 doi
-
[129]
Rubin, K. H. R., Juarez, C., Cooksey, K. L., et al. 2022, ApJ, 936, 171, doi: 10.3847/1538-4357/ac7b88
2022 doi
-
[130]
A., et al
Ruffa, I., Prandoni, I., Laing, R. A., et al. 2019, MNRAS, 484, 4239, doi: 10.1093/mnras/stz255
2019 doi
-
[131]
S., Veilleux, S., & Sanders, D
Rupke, D. S., Veilleux, S., & Sanders, D. B. 2005, ApJS, 160, 87, doi: 10.1086/432886
2005 doi
-
[132]
Rupke, D. S. N., Thomas, A. D., & Dopita, M. A. 2021, MNRAS, 503, 4748, doi: 10.1093/mnras/stab743 S´ anchez-Bl´ azquez, P., Peletier, R. F., Jim´ enez-Vicente, J., et al. 2006, MNRAS, 371, 703, doi: 10.1111/j.1365-2966.2006.10699.x S´ anchez-Bl´ azquez, P., Rosales-Ortega, F....
2021
-
[133]
R., Weisz, D
Sandford, N. R., Weisz, D. R., & Ting, Y.-S. 2023, ApJS, 267, 18, doi: 10.3847/1538-4365/acd37b
2023 doi
-
[134]
1992, A&AS, 96, 269
Schaller, G., Schaerer, D., Meynet, G., & Maeder, A. 1992, A&AS, 96, 269
1992
-
[135]
J., Finkbeiner, D
Schlegel, D. J., Finkbeiner, D. P., & Davis, M. 1998, ApJ, 500, 525, doi: 10.1086/305772 Schmidt-Kaler. 1982, Numerical Data and Functional Relationships in Science and Technology, Landolt/Bornstein No. Group IV, Vol. 2(b) (Springer,Berlin)
1998 doi
-
[136]
R., & Danks, A
Sembach, K. R., & Danks, A. C. 1994, A&A, 289, 539
1994
-
[137]
R., Danks, A
Sembach, K. R., Danks, A. C., & Savage, B. D. 1993, A&AS, 100, 107
1993
-
[138]
R., Savage, B
Sembach, K. R., Savage, B. D., & Hurwitz, M. 1999, ApJ, 524, 98, doi: 10.1086/307811
1999 doi
-
[139]
Serven, J., Worthey, G., & Briley, M. M. 2005, ApJ, 627, 754, doi: 10.1086/430400
2005 doi
-
[140]
J., Lucey, J
Smith, R. J., Lucey, J. R., & Carter, D. 2012, MNRAS, 426, 2994, doi: 10.1111/j.1365-2966.2012.21922.x
2012
-
[141]
C., Koopmans, L
Spiniello, C., Trager, S. C., Koopmans, L. V. E., & Chen, Y. P. 2012, ApJL, 753, L32, doi: 10.1088/2041-8205/753/2/L32
2012 doi
-
[142]
Spinrad, H., & Taylor, B. J. 1971, ApJS, 22, 445, doi: 10.1086/190232
1971 doi
-
[144]
2017, MNRAS, 471, 2587, doi: 10.1093/mnras/stx1068
Starkenburg, E., Martin, N., Youakim, K., et al. 2017, MNRAS, 471, 2587, doi: 10.1093/mnras/stx1068
2017 doi
-
[145]
A., Noterdaeme, P., Srianand, R., et al
Straka, L. A., Noterdaeme, P., Srianand, R., et al. 2015, MNRAS, 447, 3856, doi: 10.1093/mnras/stu2739
2015 doi
-
[146]
1963, Basic Astronomical Data, Basic Astronomical Data No
Strand, K. 1963, Basic Astronomical Data, Basic Astronomical Data No. v. 3 (University of Chicago Press). https://books.google.com/books?id=qInvAAAAMAAJ S¯ udˇ zius, J., & Bobinas, V. 1994, Baltic Astronomy, 3, 158, doi: 10.1515/astro-1994-1-221
1963 doi
-
[147]
P., Hurwitz, M., et al
Taresch, G., Kudritzki, R. P., Hurwitz, M., et al. 1997, A&A, 321, 531
1997
-
[149]
2003, MNRAS, 339, 897, doi: 10.1046/j.1365-8711.2003.06248.x
Thomas, D., Maraston, C., & Bender, R. 2003, MNRAS, 339, 897, doi: 10.1046/j.1365-8711.2003.06248.x
2003
-
[150]
2005, ApJ, 621, 673, doi: 10.1086/426932
Oliveira, C. 2005, ApJ, 621, 673, doi: 10.1086/426932
2005 doi
-
[153]
Tinsley, B. M. 1978, ApJ, 222, 14, doi: 10.1086/156116
1978 doi
-
[154]
C., Worthey, G., Faber, S
Trager, S. C., Worthey, G., Faber, S. M., Burstein, D., & Gonz´ alez, J. J. 1998, ApJS, 116, 1, doi: 10.1086/313099
1998 doi
-
[155]
A., Heckman, T
Tremonti, C. A., Heckman, T. M., Kauffmann, G., et al. 2004, ApJ, 613, 898, doi: 10.1086/423264
2004 doi
-
[156]
W., Koopmans, L
Treu, T., Auger, M. W., Koopmans, L. V. E., et al. 2010, ApJ, 709, 1195, doi: 10.1088/0004-637X/709/2/1195
2010 doi
-
[157]
M., Rachford, B
Tumlinson, J., Shull, J. M., Rachford, B. L., et al. 2002, ApJ, 566, 857, doi: 10.1086/338112
2002 doi
-
[158]
Turnrose, B. E. 1976, ApJ, 210, 33, doi: 10.1086/154801 SDSS-IV MaStar: Removal of Interstellar Absorption 45
1976 doi
-
[159]
A., Singh, H
Valdes, F., Gupta, R., Rose, J. A., Singh, H. P., & Bell, D. J. 2004, ApJS, 152, 251, doi: 10.1086/386343 van Dokkum, P., Conroy, C., Villaume, A., Brodie, J., &
2004 doi
-
[160]
Romanowsky, A. J. 2017, ApJ, 841, 68, doi: 10.3847/1538-4357/aa7135 van Dokkum, P. G., & Conroy, C. 2010, Nature, 468, 940, doi: 10.1038/nature09578 —. 2012, ApJ, 760, 70, doi: 10.1088/0004-637X/760/1/70
2017 doi
- [161]
-
[162]
Houghton, R. C. W. 2018, MNRAS, 479, 2443, doi: 10.1093/mnras/sty1434
2018 doi
-
[163]
1999, ApJ, 513, 224, doi: 10.1086/306843
Vazdekis, A. 1999, ApJ, 513, 224, doi: 10.1086/306843
1999 doi
-
[164]
2010, MNRAS, 404, 1639, doi: 10.1111/j.1365-2966.2010.16407.x
Vazdekis, A., S´ anchez-Bl´ azquez, P., Falc´ on-Barroso, J., et al. 2010, MNRAS, 404, 1639, doi: 10.1111/j.1365-2966.2010.16407.x
2010
-
[165]
D., & Aalto, S
Veilleux, S., Maiolino, R., Bolatto, A. D., & Aalto, S. 2020, A&A Rv, 28, 2, doi: 10.1007/s00159-019-0121-9 Vogrinˇ ciˇ c, R., Kos, J., Zwitter, T., et al. 2023, MNRAS, 521, 3727, doi: 10.1093/mnras/stad678
2020 doi
-
[166]
Wakker, B. P. 2001, ApJS, 136, 463, doi: 10.1086/321783
2001 doi
-
[167]
Walborn, N. R. 1972, AJ, 77, 312, doi: 10.1086/111285 —. 1973, AJ, 78, 1067, doi: 10.1086/111509
1972 doi
-
[168]
Y., Lallement, R., Vergely, J
Welsh, B. Y., Lallement, R., Vergely, J. L., & Raimond, S. 2010, A&A, 510, A54, doi: 10.1051/0004-6361/200913202
2010 doi
-
[169]
E., Federman, S
Welty, D. E., Federman, S. R., Gredel, R., Thorburn, J. A., & Lambert, D. L. 2006, ApJS, 165, 138, doi: 10.1086/504153
2006 doi
-
[170]
E., Morton, D
Welty, D. E., Morton, D. C., & Hobbs, L. M. 1996, ApJS, 106, 533, doi: 10.1086/192347
1996 doi
-
[171]
E., Xue, R., & Wong, T
Welty, D. E., Xue, R., & Wong, T. 2012, ApJ, 745, 173, doi: 10.1088/0004-637X/745/2/173
2012 doi
-
[172]
B., Cappellari, M., Bershady, M
Westfall, K. B., Cappellari, M., Bershady, M. A., et al. 2019, AJ, 158, 231, doi: 10.3847/1538-3881/ab44a2
2019 doi
-
[173]
Whitford, A. E. 1977, ApJ, 211, 527, doi: 10.1086/154959
1977 doi
-
[174]
Wild, V., & Hewett, P. C. 2005, MNRAS, 361, L30, doi: 10.1111/j.1745-3933.2005.00058.x
2005
-
[176]
M., Maraston, C., Goddard, D., Thomas, D., & Parikh, T
Wilkinson, D. M., Maraston, C., Goddard, D., Thomas, D., & Parikh, T. 2017, MNRAS, 472, 4297, doi: 10.1093/mnras/stx2215
2017 doi
- [177]
- [178]
-
[179]
M., & Gonzalez, J
Worthey, G., Faber, S. M., & Gonzalez, J. J. 1992, ApJ, 398, 69, doi: 10.1086/171836
1992 doi
-
[180]
M., Gonzalez, J
Worthey, G., Faber, S. M., Gonzalez, J. J., & Burstein, D. 1994, ApJS, 94, 687, doi: 10.1086/192087
1994 doi
-
[181]
Worthey, G., & Ottaviani, D. L. 1997, ApJS, 111, 377, doi: 10.1086/313021
1997 doi
-
[182]
2014, ApJ, 783, 20, doi: 10.1088/0004-637X/783/1/20
Worthey, G., Tang, B., & Serven, J. 2014, ApJ, 783, 20, doi: 10.1088/0004-637X/783/1/20
2014 doi
-
[183]
R., et al
Yan, R., Bundy, K., Law, D. R., et al. 2016, AJ, 152, 197, doi: 10.3847/0004-6256/152/6/197
2016 doi
-
[184]
2019, ApJ, 883, 175, doi: 10.3847/1538-4357/ab3ebc
Yan, R., Chen, Y., Lazarz, D., et al. 2019, ApJ, 883, 175, doi: 10.3847/1538-4357/ab3ebc
2019 doi
-
[185]
M., Wang, Q
Yao, Y., Tripp, T. M., Wang, Q. D., et al. 2009, ApJ, 697, 1784, doi: 10.1088/0004-637X/697/2/1784
2009 doi
-
[186]
S., et al
Youakim, K., Starkenburg, E., Aguado, D. S., et al. 2017, MNRAS, 472, 2963, doi: 10.1093/mnras/stx2005
2017 doi
-
[187]
M., Bureau, M., Davis, T
Young, L. M., Bureau, M., Davis, T. A., et al. 2011, MNRAS, 414, 940, doi: 10.1111/j.1365-2966.2011.18561.x
2011
-
[188]
I., Zaritsky, D., Lin, H., et al
Zabludoff, A. I., Zaritsky, D., Lin, H., et al. 1996, ApJ, 466, 104, doi: 10.1086/177495
1996 doi
-
[189]
J., Murphy, M
Zych, B. J., Murphy, M. T., Hewett, P. C., & Prochaska, J. X. 2009, MNRAS, 392, 1429, doi: 10.1111/j.1365-2966.2008.14157.x
2009
-
[190]
J., Murphy, M
Zych, B. J., Murphy, M. T., Pettini, M., et al. 2007, MNRAS, 379, 1409, doi: 10.1111/j.1365-2966.2007.12015.x
2007
Reviewed August 7, 2026 · model on record in the stance chip above.
Discussion (0). Continue with ORCID to comment.