REVIEW 4 major objections 3 minor 4 cited by
The Rich JWST Spectrum of the Western Nucleus of Arp 220: Shocked Hot Core Chemistry Dominates the Inner Disk
T0 review · 4 major / 3 minor · reviewed 2026-08-07 · deepseek-v4-flash
Pith's one-line read JWST spectra show the western nucleus of Arp 220 is a shocked hot core with no AGN signature.
desk verdict Genuinely new JWST data and careful fits make this a valuable paper on Arp 220's western nucleus, but the absolute column densities and the warm HCN component rest on pure-absorption LTE assumptions that the authors flag but do not fully quantify. read the letter →
The pith
A machine-rendered reading of the paper's core claim, the machinery that carries it, and where it could break.
The reading
What carries the argument
The load-bearing machinery is the LTE spectral fitting of rovibrational bands with a free scalar background fraction $f_\mathrm{bg}$, which parametrizes the fraction of observed continuum that passes through the absorbing gas and is constrained when Q-branches saturate. The critical identity is the dilution-factor relation $f_D = (e^{E_{ul}/k_B T_\mathrm{bg}}-1)/(e^{E_{ul}/k_B T_\mathrm{rot}}-1)$, which converts the measured 330 K HCN rotational temperature into a geometric dilution factor for a 600–1500 K background, placing the gas at the edge of the opaque core. The supporting toy model—a hot 1000 K background blackbody behind a cool 100 K foreground dust shell—explains the wavelength-dependent background fractions and the partial filling of the 14 µm bands by line emission while leaving the 7 µm bands nearly intact. This combination of saturated-feature fitting, a dilution-factor identity, and a foreground-dilution toy model carries the central argument that the absorbing gas is deep inside the nuclear disk rather than in a cold foreground screen.
What would settle it
A resolved, higher-signal observation of the 14 µm HCN ν2 band that shows its Q-branch in emission rather than absorption—or a non-LTE radiative-transfer calculation demonstrating that the P/R-branch asymmetry requires substantial emission filling—would falsify the pure-absorption column densities and the low background fractions.
Extended reading notes
Core claim
Using MIRI/MRS and NIRSpec/IFU spectra that for the first time separate the two nuclei of Arp 220, the paper detects rovibrational absorption bands of C$_2$H$_2$, HCN, HNC, CO$_2$, H$_2$O, CO, CH$_4$, C$_2$H, NO, N$_2$H$^+$, and other species along the line of sight to the western nucleus. The key quantitative claim is that the optically thick Q-branches of C$_2$H$_2$, HCN, and HNC force a background fraction $f_\mathrm{bg}$ well below unity (about 0.28 at 14 µm and 0.06 for HNC at 21.6 µm), so the true column densities are much larger than the absorption depths naively suggest: HCN, C$_2$H$_2$, and CO$_2$ columns come out an order of magnitude above the earlier Spitzer values. A second, warm HCN component with $T_\mathrm{rot}=330$ K is required to fit the 14 µm Q-branch shape; the paper attributes it to radiative excitation by the hot inner nucleus seen with a dilution factor $f_D\approx0.2$–$0.5$. The derived chemistry is hot-core-like with a low C$_2$H$_2$ ortho-to-para ratio of $1.71\pm0.05$ and an HCN/HNC ratio above unity, and the paper concludes there is no sign of an AGN in either the chemistry or the excitation.
Load-bearing premise
The analysis assumes every band is a pure absorption line under LTE with a single scalar background fraction $f_\mathrm{bg}$; if line emission fills in the bands, as the P/R-branch asymmetries and the tentative HCN hot band suggest, then the derived column densities are lower limits and the low derived background fractions change.
Editorial extensions
If this is right
- The order-of-magnitude higher column densities mean the nuclear gas mass and abundances derived from mid-infrared absorption in ULIRGs need revision: C$_2$H$_2$ and HCN reach abundances near $10^{-6}$ relative to H$_2$.
- The 330 K HCN component is a new diagnostic of the local radiation field and can be used to measure the brightness and dilution of an embedded hot core in other compact obscured nuclei.
- The non-detection of the fast molecular outflow in absorption, despite its column density being above the detection limit, implies a covering-factor dilution that must be accounted for in future outflow studies using pencil-beam absorption.
- The C$_2$H$_2$ ortho-to-para ratio of $1.71\pm0.05$, the first extragalactic measurement, provides a new probe of the past thermal history of the gas, analogous to hot-core measurements.
- If no AGN is present, the entire energy budget of the western nucleus can be powered by star formation in a compact, highly obscured starburst disk, sharpening the debate on what powers ULIRG nuclei.
Reading between the lines
- A testable extension is to compare the vibrational temperatures implied by the 7 and 14 µm bands: if the column-density discrepancy is indeed due to emission filling, non-LTE models should predict a measurable 14 µm emission component whose strength correlates with the 330 K rotational temperature.
- The same foreground-dilution toy model could be applied to other compact obscured nuclei observed by JWST, predicting a correlation between band wavelength and derived background fraction; a uniform pattern would strengthen the hot-background interpretation.
- If the hot core is purely starburst-powered, the inferred H$_2$ column density of $10^{23}$–$10^{24}$ cm$^{-2}$ in the inner disk constrains the star formation rate surface density there and could be compared to the supernova rate traced by the radio VLBI sources.
- The tentative HCN 3ν2−ν2 hot-band detection, if confirmed, opens a direct probe of the vibrational temperature and would allow a purely radiative-excitation model of the HCN level populations to be tested against the data.
Signed reviews
Editorial analysis
A structured set of objections, weighed in public.
Referee Report
Summary. The paper presents 3–28 µm JWST MIRI/MRS and NIRSpec/IFU spectra of the western nucleus of Arp 220, the first spatially resolved mid-infrared spectroscopic view of this nucleus. The authors identify and model a large set of molecular rovibrational absorption bands, using LTE spectral models with MCMC fitting and a single scalar background fraction f_bg per band. They derive column densities and rotational temperatures for 10 species. The main claims are: (i) HCN, C2H2 and CO2 column densities an order of magnitude higher than previous Spitzer estimates because the Q-branches are optically thick and f_bg≈0.28; (ii) a warm 330 K HCN component radiatively excited by a hot (Td>500 K) embedded core; and (iii) a chemical footprint resembling Galactic hot cores with additional shock tracers, and no evidence for AGN-driven X-ray chemistry. The paper is careful in stating its assumptions and explicitly discusses the possibility of line emission filling in the absorption bands.
Significance. If correct, these results provide the deepest mid-infrared view of the Arp 220 western nucleus and establish rovibrational absorption spectroscopy as a powerful probe of compact obscured nuclei. The order-of-magnitude increase over Spitzer would revise our picture of the molecular content of ULIRG nuclei. The C2H2 ortho-to-para ratio of 1.71±0.05 is the first extragalactic measurement and offers a new diagnostic of nuclear chemistry. The absence of X-ray-driven chemical signatures in gas close to the putative buried AGN is an important, albeit not decisive, contribution to the AGN/starburst debate. The paper's strengths include the careful use of MCMC fitting, the explicit treatment of the degeneracy between f_bg and column density, and the transparent discussion of systematic uncertainties, including the self-identified limitations of the pure-absorption LTE approach.
major comments (4)
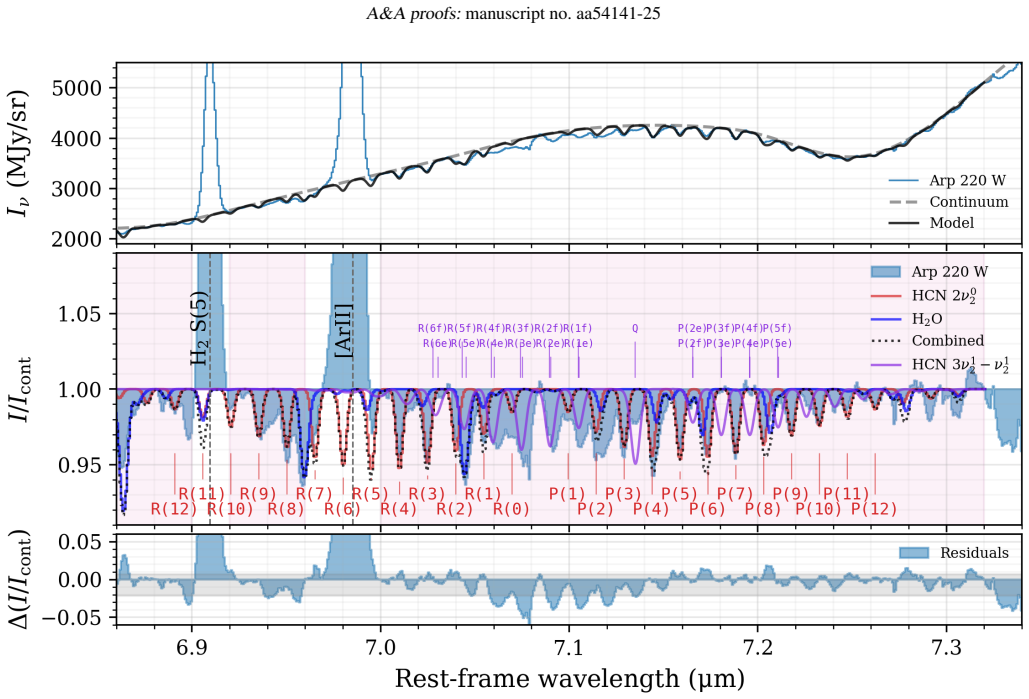
- [Section 3; Section 4.1.2; Table 1; Eq. (1)] The pure-absorption LTE assumption with a single scalar background fraction is load-bearing for the central quantitative results. The paper itself provides evidence that this assumption is imperfect: P/R-branch asymmetries in H2O (Fig. 4) and CO (Fig. 5), and the tentative HCN 3ν2−ν2 hot band (Fig. 7) indicate line emission partially filling the absorption. In Section 4.1.2 the authors show that such emission can fill in the 14 µm ν2 band while leaving the 7 µm band nearly unchanged. Under these conditions the fitted f_bg values are lower limits, and the decomposition into 50 K and 330 K HCN components in Table 1 may not be unique. Because the warm 330 K component and the dilution factors derived from Eq. (1) in Section 4.3 underlie the main geometric conclusion, the paper would be substantially strengthened by a non-LTE or two-layer model, or by an explicit sensitivity test showing how the derived parameters change when emission filling is included.
- [Section 4.1.1; Table 1; Sections 3.1 and 3.4.2] The factor 1.6–2.0 discrepancy between the 7 µm and 14 µm column densities of HCN and C2H2 is acknowledged but not resolved. The toy model of Section 4.1.1 (Figs. 11–13) is invoked to explain the difference qualitatively, but it is not fitted to the data and does not demonstrate that a single set of physical parameters can reproduce the observed f_bg at 7, 14 and 21 µm simultaneously. Since the absolute column densities in Table 1 are central to the order-of-magnitude claim relative to Spitzer and to the abundance ratios in Section 4.4, the systematic uncertainty of roughly a factor of two should be propagated into the quoted column densities and the derived ratios.
- [Section 4.3; Eq. (1)] The derivation of the dilution factor f_D = 0.2–0.5 assumes that the 330 K rotational temperature of HCN is set entirely by radiative pumping from a blackbody with T_bg = 600–1500 K. The paper argues that collisional excitation is unlikely because of the high critical densities of the J≥10 levels, but it does not quantify the competition between collisional and radiative pumping, including the effect of photon trapping which it mentions. A simple LVG or two-level estimate would show whether the derived f_D and the resulting statement that the absorbing gas lies 'at or near the edge of the optically thick background source' are robust. Without this, the geometric interpretation is plausible but not fully secured.
- [Section 3.2; Table 1; Section 4.4] The H2O column density is listed in Table 1 and used in the chemical comparison of Section 4.4 (e.g., the [H2O]/[CO] ratio of ~1), despite the fact that the LTE model fails to reproduce the R-branch lines (Fig. 4) and the authors state that far-infrared radiative excitation is important for H2O. The quoted N(H2O) = (2.4–7.0)×10^18 cm^-2 should therefore be regarded as a rough estimate with large systematic uncertainty. Since H2O is one of the two most abundant molecules in the sample, this uncertainty propagates into the hot-core/shock chemistry conclusions. At minimum, the paper should either restrict the H2O-based claims to a lower limit or present a non-LTE excitation model for H2O.
minor comments (3)
- [Section 3.1; Section 3.4.2] The statement in Section 3.1 that 'we do not detect any clear hot band absorption' may be read as contradicting the tentative 3ν2−ν2 hot band detection in Section 3.4.2; clarifying that the former refers specifically to the 14 µm ν2 fundamental region would avoid confusion.
- [Table 1; Section 3.3] For CO, the text states that the cold and warm components are not uniquely determined by the fits because they vary strongly with small changes to the assumed kinematics, but the table lists only narrow ranges for their column densities and temperatures. It would be helpful to indicate in the table that these ranges do not include the kinematic degeneracy.
- [Section 4.4; Section 2] The abundance ratios in Section 4.4 compare CO, whose column density is measured from the 0.15 arcsec NIRSpec aperture (Section 2.2), with species measured from the 0.435 arcsec MIRI aperture. Since the CO absorption is known to be aperture-dependent, the aperture mismatch should be stated when presenting ratios involving CO.
Circularity Check
No significant circularity: the derived column densities and temperatures are MCMC fits to the observed absorption spectra with external line lists, and the interpretive models use independent submillimetre constraints; the paper's own caveats about LTE and pure-absorption assumptions are acknowledged systematics, not input-output identity.
full rationale
The paper's central quantitative results are obtained by fitting LTE absorption models with MCMC to the continuum-normalized MIRI/NIRSpec spectra, using external line lists from HITRAN, CDMS, and GEISA (Section 3). The background fraction f_bg is a free parameter constrained by the depth ratio between saturated Q-branches and P/R-branch lines; the factor-of-order-ten increase over Lahuis et al. (2007) follows from the fitted f_bg = 0.28 and the resolved P/R-branch lines, not from imposing the desired column densities. The 330 K HCN component is required to reproduce the asymmetric Q-branch shape in the LTE fit and is then interpreted as radiatively excited using Eq. 1 with Tbg taken from independent ALMA dust continuum measurements (Sakamoto et al. 2017). The toy model in Section 4.1.1 adopts N(HCN) = 2e18 cm^-2, Tvib = 440 K, and Trot = 150 K from independent submillimetre studies (Tunnard et al. 2015; Martín et al. 2016; Sakamoto et al. 2021b), so it does not feed the paper's own fitted values back into the derivation. Self-references (Buiten et al. 2024; Van der Werf et al. in prep; Perna et al. 2024) provide data-reduction context and complementary emission-line results; they are not used as the sole warrant for the absorption-line analysis or for the absence-of-AGN conclusion. The pure-absorption, scalar-f_bg LTE approximation is explicitly flagged in Sections 3 and 4.1.2 as a possible source of underestimated column densities if line emission fills the bands, which is an acknowledged systematic uncertainty rather than a circular step. No equation or fitted parameter is defined in terms of the claim it is used to support.
Assumptions & free parameters
free parameters (6)
- fbg_14um_HCN_C2H2 =
0.28
- fbg_HNC =
0.06
- OPR_C2H2 =
1.71
- Trot_warm_HCN =
330 K
- N_cold_HCN =
2.45e17 cm-2
- N_C2H2 =
2.29e17 cm-2
assumptions (6)
- domain assumption LTE excitation for all fitted rovibrational bands
- domain assumption Pure absorption lines
- domain assumption Scalar background fraction f_bg per band
- domain assumption PAH emission arises in the foreground
- domain assumption Continuum estimated by spline with manually placed nodes
- standard math HITRAN/CDMS/GEISA line lists are correct
Cite this review
Pith. "Pith review of The Rich JWST Spectrum of the Western Nucleus of Arp 220: Shocked Hot Core Chemistry Dominates the Inner Disk." pith.science (2026). https://pith.science/paper/W6F4JFU7
@misc{pith2026250210271,
  author       = {Pith},
  title        = {Pith review of: The Rich JWST Spectrum of the Western Nucleus of Arp 220: Shocked Hot Core Chemistry Dominates the Inner Disk},
  year         = {2026},
  howpublished = {\url{https://pith.science/paper/W6F4JFU7}},
  note         = {Machine review of arXiv:2502.10271}
}
abstract
We present full 3-28 $\mathrm{\mu m}$ JWST MIRI/MRS and NIRSpec/IFU spectra of the western nucleus of Arp 220, the nearest ultraluminous infrared galaxy. This nucleus has long been suggested to possibly host an embedded Compton-thick AGN. Millimeter observations of the dust continuum suggest the presence of a distinct 20 pc core with a dust temperature of $T_\mathrm{d} \gtrsim 500~\mathrm{K}$, in addition to a 100 pc circumnuclear starburst disk. However, unambiguously identifying the nature of this core is challenging, due to the immense obscuration, the nuclear starburst activity, and the nearby eastern nucleus. With the JWST integral field spectrographs, we can, for the first time, separate the two nuclei across this full wavelength range, revealing a wealth of molecular absorption features towards the western nucleus. We analyse the rovibrational bands detected at 4-22 $\mathrm{\mu m}$, deriving column densities and rotational temperatures for 10 distinct species. Optically thick features of C$_2$H$_2$, HCN and HNC suggest that this molecular gas is hidden behind a curtain of cooler dust, and indicate that the column densities of C$_2$H$_2$ and HCN are an order of magnitude higher than previously derived from Spitzer observations. We identify a warm HCN component with rotational temperature $T_\mathrm{rot} = 330~\mathrm{K}$, which we associate with radiative excitation by the hot inner nucleus. We propose a geometry where the detected molecular gas is located in the inner regions of the starburst disk, directly surrounding the hot 20 $\mathrm{pc}$ core. The chemical footprint of the western nucleus is reminiscent of that of hot cores, with additional evidence for shocks. Despite the molecular material's close proximity to the central source, no evidence for the presence of an AGN in the form of X-ray-driven chemistry or extreme excitation is found.
Figures


Figures from the paper (10 more)




Forward citations
Cited by 4 Pith papers
-
JWST reveals cosmic ray dominated chemistry in the local ULIRG IRAS 07251$-$0248
Molecular ion absorption bands in the ULIRG IRAS 07251 imply a cosmic ray ionization rate of log(zeta_H2/n_H) between -18.2 and -19.1 cm^3 s^-1, consistent with cosmic ray dominated chemistry.
-
MICONIC: JWST/MIRI MRS reveals a fast ionized gas outflow in the central region of Centaurus A
JWST/MIRI MRS data show a fast ionized gas outflow in the central ~6 pc of Centaurus A, with velocities up to about 1000-1400 km/s and a mass outflow rate near 2 solar masses per year.
-
JWST Observations of Young protoStars (JOYS): overview of program and early results
JWST MIRI-MRS maps of 23 protostars reveal nested jets, cool hot-core molecular emission, comparable ice abundances across stellar masses, a second HDO ice detection near 0.4%, and an O2 ice upper limit near 20% of water.
-
Theoretical Diagnostics for the Physical Conditions in Active Galactic Nuclei under the View of JWST
New mid-IR line diagnostics from MAPPINGS V models to measure physical conditions in AGN for JWST.
Reference graph
Works this paper leans on
-
[1]
2015, A&A, 584, A42
Aalto, S., Martín, S., Costagliola, F., et al. 2015, A&A, 584, A42
2015
-
[2]
C., & Hüttemeister, S
Aalto, S., Spaans, M., Wiedner, M. C., & Hüttemeister, S. 2007, A&A, 464, 193
2007
-
[3]
2015, A&A, 579, A101 Alonso Herrero, A., Hermosa Muñoz, L., Labiano, A., et al
Aladro, R., Martín, S., Riquelme, D., et al. 2015, A&A, 579, A101 Alonso Herrero, A., Hermosa Muñoz, L., Labiano, A., et al. 2024, A&A, 690, A95
2015
-
[4]
A., & Hofner, P
Araya, E., Baan, W. A., & Hofner, P. 2004, ApJS, 154, 541
2004
- [5]
-
[6]
2007, ApJ, 656, 148 Astropy Collaboration, Price-Whelan, A
Armus, L., Charmandaris, V ., Bernard-Salas, J., et al. 2007, ApJ, 656, 148 Astropy Collaboration, Price-Whelan, A. M., Sip˝ocz, B. M., et al. 2018, AJ, 156, 123 Astropy Collaboration, Robitaille, T. P., Tollerud, E. J., et al. 2013, A&A, 558, A33
work page 2007
-
[7]
Baan, W. A., Aditya, J. N. H. S., An, T., & Klöckner, H.-R. 2023, MNRAS, 523, 5487
work page 2023
-
[8]
Baan, W. A. & Haschick, A. D. 1984, ApJ, 279, 541
work page 1984
Show all 84 references
-
[9]
A., Haschick, A
Baan, W. A., Haschick, A. D., & Henkel, C. 1989, ApJ, 346, 680
1989
-
[10]
A., Wood, P
Baan, W. A., Wood, P. A. D., & Haschick, A. D. 1982, ApJ, 260, L49 Barcos-Muñoz, L., Aalto, S., Thompson, T. A., et al. 2018, ApJ, 853, L28 Barcos-Muñoz, L., Leroy, A. K., Evans, A. S., et al. 2015, ApJ, 799, 10
1982
-
[11]
G., Boogert, A., DeWitt, C
Barr, A. G., Boogert, A., DeWitt, C. N., et al. 2020, ApJ, 900, 104
2020
-
[12]
G., Holdship, J., et al
Behrens, E., Mangum, J. G., Holdship, J., et al. 2022, ApJ, 939, 119 Böker, T., Beck, T. L., Birkmann, S. M., et al. 2023, PASP, 135, 038001
2022
-
[13]
Boogert, A. C. A., Gerakines, P. A., & Whittet, D. C. B. 2015, ARA&A, 53, 541
2015
-
[14]
Boonman, A. M. S., Stark, R., van der Tak, F. F. S., et al. 2001, ApJ, 553, L63
2001
-
[15]
Boonman, A. M. S., van Dishoeck, E. F., Lahuis, F., & Doty, S. D. 2003, A&A, 399, 1063
2003
-
[16]
A., van der Werf, P
Buiten, V . A., van der Werf, P. P., Viti, S., et al. 2024, ApJ, 966, 166
2024
-
[17]
2022, A&A, 667, A131
Butterworth, J., Holdship, J., Viti, S., & García-Burillo, S. 2022, A&A, 667, A131
2022
-
[18]
Charnley, S. B. & Kaufman, M. J. 2000, ApJ, 529, L111
2000
-
[19]
2024, A&A, 685, A75
Chown, R., Sidhu, A., Peeters, E., et al. 2024, A&A, 685, A75
2024
-
[20]
2015, A&A, 582, A91
Costagliola, F., Sakamoto, K., Muller, S., et al. 2015, A&A, 582, A91
2015
-
[21]
A., et al
Delahaye, T., Armante, R., Scott, N. A., et al. 2021, Journal of Molecular Spec- troscopy, 380, 111510 D’Eugenio, F., Pérez-González, P. G., Maiolino, R., et al. 2024, Nature Astron- omy, 8, 1443
2021
-
[22]
R., García-Bernete, I., Rigopoulou, D., et al
Donnan, F. R., García-Bernete, I., Rigopoulou, D., et al. 2024, MNRAS, 529, 1386
2024
-
[23]
D., van Dishoeck, E
Doty, S. D., van Dishoeck, E. F., van der Tak, F. F. S., & Boonman, A. M. S. 2002, A&A, 389, 446
2002
-
[24]
P., Schlemmer, S., Schilke, P., Stutzki, J., & Müller, H
Endres, C. P., Schlemmer, S., Schilke, P., Stutzki, J., & Müller, H. S. P. 2016, Journal of Molecular Spectroscopy, 327, 95
2016
-
[25]
2015, A&A, 580, A52
Falstad, N., González-Alfonso, E., Aalto, S., et al. 2015, A&A, 580, A52
2015
-
[26]
W., Lang, D., & Goodman, J
Foreman-Mackey, D., Hogg, D. W., Lang, D., & Goodman, J. 2013, PASP, 125, 306
2013
-
[27]
L., van Dishoeck, E
Francis, L., van Gelder, M. L., van Dishoeck, E. F., et al. 2024, A&A, 683, A249 Gaia Collaboration, Vallenari, A., Brown, A. G. A., et al. 2023, A&A, 674, A1 García-Bernete, I., Pereira-Santaella, M., González-Alfonso, E., et al. 2024, A&A, 682, L5
2024
-
[28]
E., Buiten, V
Goldberg, C. E., Buiten, V . A., Rieke, G. H., et al. 2024, ApJ, 977, 55
2024
-
[29]
Goldsmith, P. F. & Langer, W. D. 1999, ApJ, 517, 209 González-Alfonso, E., Fischer, J., Bruderer, S., et al. 2013, A&A, 550, A25 González-Alfonso, E., Fischer, J., Graciá-Carpio, J., et al. 2012, A&A, 541, A4 González-Alfonso, E., García-Bernete, I., Pereira-Santaella, M., et ...
1999
-
[30]
E., Rothman, L
Gordon, I. E., Rothman, L. S., Hargreaves, R. J., et al. 2022, J. Quant. Spectr. Rad. Transf., 277, 107949
2022
-
[31]
D., Aalto, S., König, S., et al
Gorski, M. D., Aalto, S., König, S., et al. 2023, A&A, 670, A70
2023
-
[32]
R., Carico, D
Graham, J. R., Carico, D. P., Matthews, K., et al. 1990, ApJ, 354, L5
1990
-
[33]
S., Martín, S., et al
Harada, N., Meier, D. S., Martín, S., et al. 2024, ApJS, 271, 38
2024
-
[34]
R., Millman, K
Harris, C. R., Millman, K. J., van der Walt, S. J., et al. 2020, Nature, 585, 357 Hermosa Muñoz, L., Alonso-Herrero, A., Labiano, A., et al. 2025, A&A, 693, A321
2020
-
[35]
E., Vacca, W
Hibbard, J. E., Vacca, W. D., & Yun, M. S. 2000, AJ, 119, 1130
2000
-
[36]
Hunter, J. D. 2007, Computing In Science & Engineering, 9, 90
2007
-
[37]
2009, AJ, 137, 3581
Imanishi, M., Nakanishi, K., Tamura, Y ., & Peng, C.-H. 2009, AJ, 137, 3581
2009
-
[38]
C., Álvarez-Márquez, J., Sloan, G
Jones, O. C., Álvarez-Márquez, J., Sloan, G. C., et al. 2023, MNRAS, 523, 2519
2023
-
[39]
Joseph, R. D. & Wright, G. S. 1985, MNRAS, 214, 87
1985
-
[40]
2001, in Astronomical Society of the Pacific Conference Series, V ol
Kohno, K., Matsushita, S., Vila-Vilaró, B., et al. 2001, in Astronomical Society of the Pacific Conference Series, V ol. 249, The Central Kiloparsec of Star- bursts and AGN: The La Palma Connection, ed. J. H. Knapen, J. E. Beckman, I. Shlosman, & T. J. Mahoney, 672
2001
-
[41]
2008, ApJ, 677, 262
Krips, M., Neri, R., García-Burillo, S., et al. 2008, ApJ, 677, 262
2008
-
[42]
Lahuis, F., Spoon, H. W. W., Tielens, A. G. G. M., et al. 2007, ApJ, 659, 296
2007
-
[43]
& van Dishoeck, E
Lahuis, F. & van Dishoeck, E. F. 2000, A&A, 355, 699
2000
-
[44]
Lai, T. S. Y ., Armus, L., U, V ., et al. 2022, ApJ, 941, L36
2022
-
[45]
Law, D. R., E. Morrison, J., Argyriou, I., et al. 2023, AJ, 166, 45
2023
-
[46]
J., Diamond, P
Lonsdale, C. J., Diamond, P. J., Thrall, H., Smith, H. E., & Lonsdale, C. J. 2006, ApJ, 647, 185
2006
-
[47]
& Scoville, N
Manohar, S. & Scoville, N. 2017, ApJ, 835, 127 Martín, S., Aalto, S., Sakamoto, K., et al. 2016, A&A, 590, A25 Martín, S., Krips, M., Martín-Pintado, J., et al. 2011, A&A, 527, A36
2017
-
[48]
F., & van der Werf, P
Meijerink, R., Spaans, M., Loenen, A. F., & van der Werf, P. P. 2011, A&A, 525, A119
2011
-
[49]
Nagy, Z., Ossenkopf, V ., Van der Tak, F. F. S., et al. 2015, A&A, 578, A124
2015
-
[50]
D., et al
Nishimura, Y ., Aalto, S., Gorski, M. D., et al. 2024, A&A, 686, A48
2024
-
[51]
Norris, R. P. 1988, MNRAS, 230, 345
1988
-
[52]
2024, ApJ, 976, 106
Onishi, S., Nakagawa, T., Baba, S., et al. 2024, ApJ, 976, 106
2024
-
[53]
A., & Weiß, A
Ott, J., Henkel, C., Braatz, J. A., & Weiß, A. 2011, ApJ, 742, 95
2011
-
[54]
2020, A&A, 643, A139
Perna, M., Arribas, S., Catalán-Torrecilla, C., et al. 2020, A&A, 643, A139
2020
-
[55]
2024, A&A, 690, A171 Planck Collaboration, Aghanim, N., Akrami, Y ., et al
Perna, M., Arribas, S., Lamperti, I., et al. 2024, A&A, 690, A171 Planck Collaboration, Aghanim, N., Akrami, Y ., et al. 2020, A&A, 641, A6
2024
-
[56]
Rangwala, N., Colgan, S. W. J., Le Gal, R., et al. 2018, ApJ, 856, 9
2018
-
[57]
R., Glenn, J., et al
Rangwala, N., Maloney, P. R., Glenn, J., et al. 2011, ApJ, 743, 94
2011
-
[58]
H., Arendt, R., et al
Rho, J., Park, S. H., Arendt, R., et al. 2024, ApJ, 969, L9
2024
-
[59]
& Bressert, E
Robitaille, T. & Bressert, E. 2012, APLpy: Astronomical Plotting Library in
2012
-
[60]
2017, ApJ, 849, 14
Sakamoto, K., Aalto, S., Barcos-Muñoz, L., et al. 2017, ApJ, 849, 14
2017
-
[61]
S., Wiedner, M
Sakamoto, K., Aalto, S., Evans, A. S., Wiedner, M. C., & Wilner, D. J. 2010, ApJ, 725, L228
2010
-
[62]
J., et al
Sakamoto, K., Aalto, S., Wilner, D. J., et al. 2009, ApJ, 700, L104
2009
-
[63]
Z., Yun, M
Sakamoto, K., Scoville, N. Z., Yun, M. S., et al. 1999, ApJ, 514, 68
1999
-
[64]
J., Ghosh, T., Catinella, B., et al
Salter, C. J., Ghosh, T., Catinella, B., et al. 2008, AJ, 136, 389
2008
-
[65]
B., Soifer, B
Sanders, D. B., Soifer, B. T., Elias, J. H., et al. 1988, ApJ, 325, 74
1988
-
[66]
2017, ApJ, 836, 66
Scoville, N., Murchikova, L., Walter, F., et al. 2017, ApJ, 836, 66
2017
-
[67]
2015, ApJ, 800, 70
Scoville, N., Sheth, K., Walter, F., et al. 2015, ApJ, 800, 70
2015
-
[68]
Z., Evans, A
Scoville, N. Z., Evans, A. S., Dinshaw, N., et al. 1998, ApJ, 492, L107
1998
-
[69]
Z., Sanders, D
Scoville, N. Z., Sanders, D. B., Sargent, A. I., et al. 1986, ApJ, 311, L47
1986
-
[70]
E., Lonsdale, C
Smith, H. E., Lonsdale, C. J., Lonsdale, C. J., & Diamond, P. J. 1998, ApJ, 493, L17
1998
-
[71]
Smith, J. D. T., Draine, B. T., Dale, D. A., et al. 2007, ApJ, 656, 770
2007
-
[72]
T., Helou, G., Lonsdale, C
Soifer, B. T., Helou, G., Lonsdale, C. J., et al. 1984, ApJ, 283, L1
1984
-
[73]
T., Neugebauer, G., Matthews, K., et al
Soifer, B. T., Neugebauer, G., Matthews, K., et al. 1999, ApJ, 513, 207
1999
-
[74]
Sonnentrucker, P., González-Alfonso, E., & Neufeld, D. A. 2007, ApJ, 671, L37
2007
-
[75]
Spoon, H. W. W., Moorwood, A. F. M., Lutz, D., et al. 2004, A&A, 414, 873
2004
-
[76]
2005, PASJ, 57, L29
Takano, S., Nakanishi, K., Nakai, N., & Takano, T. 2005, PASJ, 57, L29
2005
-
[77]
1986, Journal of Molecular Spec- troscopy, 117, 408
Tanaka, K., Kawaguchi, K., & Hirota, E. 1986, Journal of Molecular Spec- troscopy, 117, 408
1986
-
[78]
H., Rigby, J
Teng, S. H., Rigby, J. R., Stern, D., et al. 2015, ApJ, 814, 56
2015
-
[79]
R., Garcia-Burillo, S., et al
Tunnard, R., Greve, T. R., Garcia-Burillo, S., et al. 2015, ApJ, 800, 25
2015
-
[80]
2025, A&A, 693, A36 van der Tak, F
Ulivi, L., Perna, M., Lamperti, I., et al. 2025, A&A, 693, A36 van der Tak, F. F. S., van Dishoeck, E. F., Evans, II, N. J., Bakker, E. J., & Blake, G. A. 1999, ApJ, 522, 991 van Dishoeck, E. F., Grant, S., Tabone, B., et al. 2023, Faraday Discussions, 245, 52 van Gelder, M. L...
2025
-
[81]
E., Batejat, F., et al
Varenius, E., Conway, J. E., Batejat, F., et al. 2019, A&A, 623, A173
2019
-
[82]
E., et al
Virtanen, P., Gommers, R., Oliphant, T. E., et al. 2020, Nature Methods, 17, 261
2020
-
[83]
2020, ApJ, 896, 43
Wheeler, J., Glenn, J., Rangwala, N., & Fyhrie, A. 2020, ApJ, 896, 43
2020
-
[84]
S., Rieke, G
Wright, G. S., Rieke, G. H., Glasse, A., et al. 2023, PASP, 135, 048003 1 Leiden Observatory, Leiden University, PO Box 9513, 2300 RA Lei- den, The Netherlands 2 Transdisciplinary Research Area (TRA) ‘Matter’ /Argelander- Institut für Astronomie, University of Bonn, Bonn, Germ...
2023
Reviewed August 7, 2026 · model on record in the stance chip above.
Discussion (0). Continue with ORCID to comment.