REVIEW 4 major objections 5 minor 98 references
Temporal Variation of Flare Occurrence Rates via the Spot Evolution on the Sun and Solar-type Stars
T0 review · 4 major / 5 minor · reviewed 2026-08-16 · deepseek-v4-flash
Pith's one-line read Flare occurrence rates collapse onto one spot-lifetime profile for the Sun and solar-type stars.
desk verdict A genuinely new solar-stellar comparison of flare timing relative to spot maximum, with a plausible common exponential profile, but the load-bearing lifetime normalization in Eq. (3) is admittedly unvalidated and needs a real sensitivity analysis before the claim is solid. read the letter →
The pith
A machine-rendered reading of the paper's core claim, the machinery that carries it, and where it could break.
The reading
What carries the argument
The load-bearing object is the normalized flare timing $x=(t_{\rm flare}-t_{\rm max})/\tau_{\rm life}$, measured on a spot-lifetime clock: $t_{\rm max}$ is the time the source spot reaches maximum area $A_{\rm max}$, and $\tau_{\rm life}$ is estimated from the power-law scaling $\tau_{\rm life} = 0.5\,(A_{\rm max}/1\,{\rm MSH})^{0.7}(P_{\rm rot}/26\,{\rm d})^{0.8}\,{\rm d}$. All of the paper's collapse and fitting, including the $\alpha_{e,d}=6$--10 slopes and the emergence--decay asymmetry, is performed on this normalized time axis. A second normalized coordinate, $A(t_{\rm flare})/A_{\rm max}$, connects the same timing law to spot area through $N(t)/N_{\rm peak}\sim (A(t)/A_{\rm max})^\gamma$ with $\gamma\sim 1$--3, and the standard flare-energy power law $E_{\rm flare}^{-2}$ extends the formula to the energy dimension.
What would settle it
Track sunspot groups continuously across both disk passages so that individual lifetimes are measured rather than assumed, then rebuild the normalized flare-timing histogram; if the solar and stellar distributions stop overlapping or the peak shifts away from $t_{\rm max}$ when measured lifetimes replace Equation (3), the universal profile is refuted.
Extended reading notes
Core claim
On its own terms, the paper's central claim is that the distribution of flare occurrence times relative to spot maximum, normalized by the spot lifetime $\tau_{\rm life}$, is the same for the Sun and for solar-type stars, independent of spot size, flare energy, and stellar parameters. The shared profile is well described by $N(t)/N_{\rm peak} = \exp(-\alpha_e|t-t_{\rm max}|/\tau_{\rm life})$ for the emergence phase and $\exp(-\alpha_d|t-t_{\rm max}|/\tau_{\rm life})$ for the decay phase, with $\alpha_{e,d}$ in the range 6--10; the paper adopts $\alpha_e = 10$ and $\alpha_d = 6$ to capture a slight asymmetry favoring the decay phase. Combining this with the standard $dN/dE_{\rm flare}\propto E_{\rm flare}^{-2}$ power law and a flare-rate coefficient roughly proportional to spot area, the paper derives a per-spot formula $N(t,A_{\rm max},E_{\rm flare})\propto A_{\rm max} E_{\rm flare}^{-1}$ times the exponential factor, claimed to describe flare timing across roughly five decades of spot area. This is the first quantitative claim that the Sun and solar-type stars share the same spot-to-flare timing process.
Load-bearing premise
Every step puts flare timing on the spot-lifetime clock set by Equation (3), $\tau_{\rm life}=0.5\,(A_{\rm max}/1\,{\rm MSH})^{0.7}(P_{\rm rot}/26\,{\rm d})^{0.8}$ d, and the paper states that there is currently no clear support for those specific exponents.
Editorial extensions
If this is right
- Flaring activity peaks at spot maximum, so a spot observed to be growing has a rising flare hazard that peaks when the spot peaks and then decays on the spot-lifetime timescale.
- A single per-spot formula, roughly proportional to $A_{\rm max} E_{\rm flare}^{-1}$ with the exponential lifetime factor, gives a common benchmark for flare rates on the Sun, on superflaring stars, and on other solar-type stars.
- The absence of an emergence-phase excess implies that decay-phase processes such as flux cancellation and diffusion are at least as important as flux emergence for producing flares, contrary to earlier solar results.
- The flare-energy distribution keeps its $E_{\rm flare}^{-2}$ form in every phase of spot evolution, so spot evolution changes the overall rate but not the relative share of large versus small flares.
Reading between the lines
- Beyond the paper, if the lifetime normalization holds, photometric spot tracking alone could provide probabilistic flare forecasts for solar-type stars, since the same profile predicts a window of elevated flare risk around spot maximum.
- Beyond the paper, the admitted free exponents in the lifetime scaling make the next decisive test a direct measurement of individual starspot lifetimes, which would sharpen or overturn the fitted $\alpha_{e,d}$ values.
- Beyond the paper, the claimed $\alpha_e > \alpha_d$ asymmetry gives magnetohydrodynamic models of spot emergence and decay a quantitative target to reproduce, connecting the statistical law to a physical mechanism.
- Beyond the paper, the stellar sample is limited to slowly rotating stars with $P_{\rm rot}\ge 10$ d, so the untested prediction is that faster rotators follow the same normalized curve only if the rotation exponent in the lifetime law is correct.
Signed reviews
Editorial analysis
A structured set of objections, weighed in public.
Referee Report
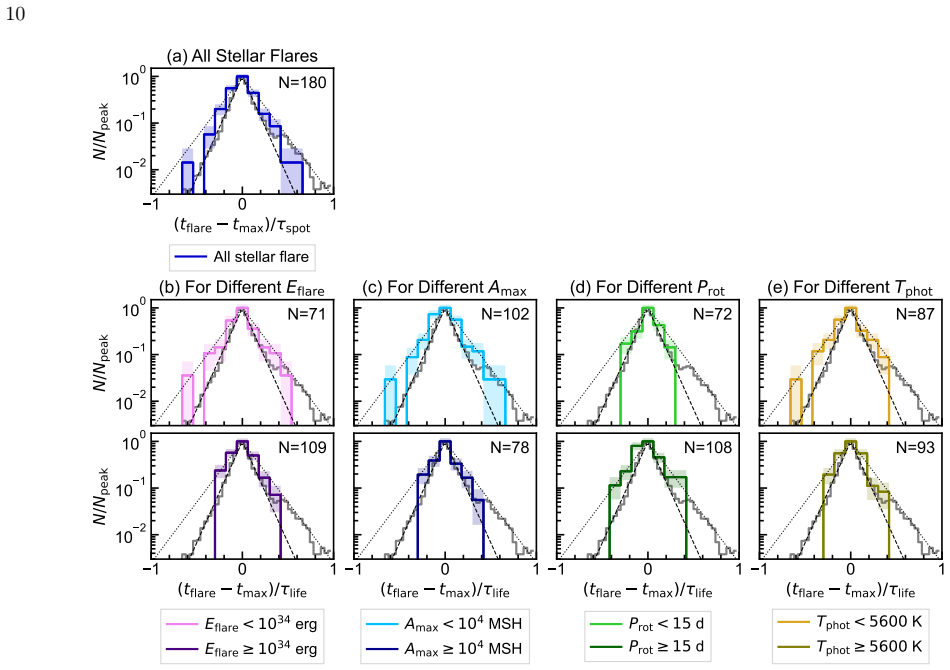
Summary. The paper investigates when flares occur relative to the time evolution of their source spots, using 24,124 solar flares with sunspot identifications from NOAA/GOES data (1996–2024) and 180 stellar flares from 89 solar-type stars observed by Kepler. For each flare, the authors compute t_flare - t_max, the time relative to the maximum area of the source spot, and normalize this by a spot lifetime tau_life taken from a power-law scaling with maximum spot area and rotation period (Eq. 3). They find that the normalized flare-timing histograms are similar across solar flare energy, spot size, and between the Sun and solar-type stars, and they propose an exponential profile (Eq. 4) with alpha_e ~ 10 (emergence) and alpha_d ~ 6 (decay), leading to a per-spot formula N(t, Amax, Eflare) ∝ Amax E_flare^{-1} exp(-alpha |t - t_max|/tau_life) (Eqs. 6 and 8). They also examine the relation between flare occurrence rate and normalized spot area, and the energy distribution of flares in different spot-evolution phases.
Significance. If the claimed common normalized profile is real, it offers a scale-independent, time-resolved description of spot-to-flare activity across roughly five decades of spot area, connecting solar and stellar data in a novel way. The solar sample is large and the authors are transparent about many uncertainties, including an explicit acknowledgment that the lifetime normalization has no clear physical support and a robustness test that perturbs spot parameters (Fig. 11). However, the central claim depends critically on the unvalidated lifetime scaling of Eq. (3), and the stellar analysis contains a procedure that biases t_flare - t_max toward zero for unclustered spots. The result is potentially important but needs stronger validation before the universality claim can be accepted.
major comments (4)
- [Section 2.3, Eq. (3) and Appendix A] The lifetime scaling tau_life = 0.5 (Amax/1 MSH)^0.7 (Prot/26 d)^0.8 d is load-bearing: it sets the x-axis of every histogram in Figs. 6 and 7, and the same tau_life,std is used in the recurrent-spot matching of Appendix A, so changing p or q would also change which sunspots are merged and hence tmax and Amax. The paper itself states that 'there is currently no clear support for specific values of p and q.' The existing robustness test (Fig. 11) perturbs Amax and tmax but does not vary p or q, so it cannot detect a normalization-driven collapse of the histograms. Please provide an explicit sensitivity sweep over p and q (e.g., p in 0.4-1.0, q in 0-1.2) and show whether the resemblance of the histograms and the fitted alpha_e,d = 6-10 survive.
- [Section 2.2 (unclustered local minima)] For unclustered local minima, the paper sets tmax equal to the observed local minimum and associates flares within +/- Prot/4 of that minimum. This mechanically places those events near (t_flare - t_max)/tau_life = 0, inflating the peak in Fig. 7(a) and biasing the comparison toward the proposed exponential profile. The perturbation test in Fig. 11 does not remove this bias because it preserves the assumption that the observed minimum is the maximum. Please report how many of the 180 stellar flares come from unclustered spots and repeat the analysis using only clustered recurrent spots, or with a simulated prior on tmax, to assess the robustness of the stellar histogram.
- [Section 3.2 and Eq. (4)] The range alpha_e,d = 6-10 is presented as a fitting result, but the dotted and dashed lines in Fig. 6 are eyeballed and no goodness-of-fit, likelihood, or parameter uncertainties are given. Moreover, the paper notes that the small-spot bins (Amax < 100 MSH) show 'moderate profiles' that deviate from the exponential shape; this is directly relevant to the claimed universality across spot size. Please provide a quantitative fitting procedure (e.g., Poisson maximum likelihood on the binned counts) and report parameter uncertainties, and explicitly quantify the deviation for the small-spot bins.
- [Section 4.1, Eq. (8)] The proposed per-spot formula relies on N(t_max, Amax, Eflare) proportional to Amax E_flare^{-1}, which is imported from Maehara et al. (2017). The consistency check in Section 3.4 and Fig. 9 is therefore not an independent test of Eq. (8), since the E^{-2} slope is taken from earlier work. In addition, the step from the per-star histogram shape to a per-spot rate assumes that the shape is independent of Amax and Eflare; this is stated but not tested. Please clarify which parts of Eqs. (6)-(8) are measured here and which are assumed or carried over from previous publications.
minor comments (5)
- [Section 3.4] The phase intervals are listed as [−1.0,−0.3], [−0.3,−0.1], [−0.3,−0.1], [−0.1,0.0], [0.0,0.1], [0.1,0.3], and [0.3,1.0] and are called 'phases 1-67'; the duplicate [−0.3,−0.1] is a typo and the phases should be the six intervals ending at 1.0, labeled 1-6.
- [Figure 8 caption] The caption says 'showing the blue ones are the results of solar flares and the blue ones are the results of stellar flare'; the colors are mixed up, since the figure uses orange for solar and blue for stellar.
- [Figure 6 caption] The caption describing the panel layout is garbled: 'each row, column, and color of panels represent the condition to divide sample... each row represents Amax ... from left to right ... and each row and color represent the GOES X-ray classes ... from top to bottom.' Please rewrite to unambiguously state which axis is Amax and which is flare class.
- [Section 2.1] The sentence 'we analyzed flares equal to or greater than the C1 class, which is not considered to be masked by background flux' should include a reference or a justification for this threshold.
- [Figure 3] The color bar is labeled 'log Prot [d]' and the symbol colors are said to correspond to Prot, but the caption should state explicitly that the colored lines for Eq. (3) follow the same color scale.
Circularity Check
Partial circularity: unclustered stellar flares are assigned tmax so that they land at the peak by construction, and the Section 4.1 E^-2 consistency check re-derives an E-dependence imported from prior co-authored work.
-
self definitional
[Section 2.2, Stellar Analysis (flare-productive starspot candidate selection and tmax assignment)]
"For the unclustered local minima, Amax and tmax were obtained, assuming that the observed point represents the maximum spot area. ... we label a starspot where there is only one local minimum that satisfies |tlm− tflare| < Prot/4 as the flare-productive starspot candidates."
For every unclustered stellar event, the selection requires the flare to lie within Prot/4 of the single observed local minimum, and the analysis then sets tmax equal to that minimum. Therefore |tflare−tmax| < Prot/4 is guaranteed by construction, not measured from spot evolution. After normalization by tau_life, these events are forced into the central bins, so part of the stellar histogram's peak at tmax—and the claimed common 'maximum at spot maximum' behavior—is an artifact of how tmax was defined rather than an independent empirical finding.
-
self citation load bearing
[Section 4.1, Temporal Variation of Flare Occurrence Rate per Spot (Equations 6 and 8, and the consistency check against Figure 9)]
"Maehara et al. (2017) ... shows that the relation dN/dEflare∝E−2 flare holds regardless of A(tflare) and its coefficient is roughly proportional to A(tflare). On this basis, we roughly derive the relation as N (t =tmax,A max,E flare)∝AmaxE−1 flare. (8) ... Thus, using Equations (6) and (8), it is easy to see that dN/dEflare maintains the dependence of∝E−2 flare for any time-integral range. This result is consistent with the result in Figure 9."
Equation (8) is not derived from the new flare-timing data; its energy dependence is transcribed from the E^-2 scaling and A-proportionality reported in Maehara et al. (2017), a paper sharing a co-author (H. Maehara). The subsequent consistency check then integrates or differentiates Equation (8) and recovers E^-2, so the check is an algebraic restatement of the assumed input rather than an independent confirmation of Figure 9. The proposed formula's energy dependence is thus imported from prior work by construction, not validated by the consistency exercise presented here.
full rationale
The core solar observational result—the collapse of (tflare−tmax)/tau_life histograms across spot size and flare energy—is not circular: tflare, tmax, Amax, and tau_life are separate observables, and the alpha_e,d = 6-10 values are openly fitted to those histograms rather than presented as independent predictions. The stellar comparison, however, is partially compromised by the unclustered-local-minimum rule: selecting flares within Prot/4 of the sole local minimum and then setting tmax to that minimum mechanically concentrates those events near zero. This definitional step inflates the peak and can also affect the emergence/decay symmetry claim. Separately, the energy dependence of the final formula (Eq. 8) is taken from Maehara et al. (2017), which shares a co-author, and the Section 4.1 'consistency check' merely re-derives the E^-2 scaling that was put into Equation (8), so it is a closed loop rather than independent evidence. The normalization exponents p and q in Equation (3) are explicitly admitted to lack clear physical support; that is a serious model-dependence and robustness risk, but not itself circular because the flare-timing collapse is not used to fit those exponents. Overall, the solar-only data and the shape away from the central bin retain independent content, so the circularity is partial rather than total, giving a score of 5.
Assumptions & free parameters
free parameters (7)
- Spot lifetime normalization coefficient in Equation (3) =
0.5 d
- Amax exponent p in tau_life scaling =
0.7
- Prot exponent q in tau_life scaling =
0.8
- alpha_e, exponential index in the emergence phase =
6 to 10, with best value near 10
- alpha_d, exponential index in the decaying phase =
6 to 10, with best value near 6
- gamma, power-law index in Equation (5) =
Solar: 1.8 (emergence) and 1.3 (decay); stellar: 4.0 and 1.9, each with large 1-sigma ranges
- beta in spot evolution model dA/dt proportional to A^beta =
0.3
assumptions (4)
- domain assumption Spot evolution is self-similar and follows dA/dt proportional to A^beta with beta = 0.3.
- domain assumption The local-minima tracing method isolates the dominant spot and estimates its area via Equations (1) and (2).
- ad hoc to paper The per-star flare occurrence rate can be treated as a per-spot rate because the normalized distribution is independent of Amax and Eflare.
- domain assumption Stellar flare association via a local minimum within Prot/4 of the flare time is correct, and unresolved or polar spots are rare.
Cite this review
Pith. "Pith review of Temporal Variation of Flare Occurrence Rates via the Spot Evolution on the Sun and Solar-type Stars." pith.science (2026). https://pith.science/paper/IJGWV6N7
@misc{pith2026250412761,
  author       = {Pith},
  title        = {Pith review of: Temporal Variation of Flare Occurrence Rates via the Spot Evolution on the Sun and Solar-type Stars},
  year         = {2026},
  howpublished = {\url{https://pith.science/paper/IJGWV6N7}},
  note         = {Machine review of arXiv:2504.12761}
}
abstract
The spot evolution on the Sun and solar-type stars is important for understanding the nature of consequential flaring activity. This study statistically investigates the variance of flare occurrence rate through the time evolution of spots on the Sun and solar-type stars. We have compiled the 28-year catalogs of solar flares and their source sunspots obtained from solar surface observations by NOAA and GOES for the Sun. Also, we combined the cataloged stellar flares with the time evolution of starspots estimated by light curves obtained by the 4-year Kepler mission for solar-type stars. For the obtained 24124 solar flares and 180 stellar flares, we calculate the flare occurrence distribution with respect to $t_\mathrm{flare}-t_\mathrm{max}$, which represents the timing of flare through the spot evolution, where $t_\mathrm{flare}$ is the flare occurrence time, and $t_\mathrm{max}$ is the time when the source spot takes its maximum area. When normalized by the spot lifetime, we found that the flare occurrence distribution for $t_\mathrm{flare}-t_\mathrm{max}$ shows a similar distribution regardless of spot size or flare energy, suggesting that the Sun and the solar-type star share the same physical process in the spot-to-flare activity. On this basis, we propose a formula for the time variation of the flare occurrence rate per spot. Also, the correlation between the temporal variation of flare occurrence rate and the time evolution of spot area and the lack of difference in flare occurrence rate between the emergence and decaying phases provide a milestone for the nature of flare-productive spots.
Figures


Figures from the paper (9 more)




Reference graph
Works this paper leans on
-
[1]
2016, Nature Geoscience, 9, 452, doi: 10.1038/ngeo2719
Danchi, W. 2016, Nature Geoscience, 9, 452, doi: 10.1038/ngeo2719
doi:10.1038/ngeo2719 2016
-
[2]
S., Barnes, R., Cohen, O., et al
Airapetian, V. S., Barnes, R., Cohen, O., et al. 2020, International Journal of Astrobiology, 19, 136, doi: 10.1017/S1473550419000132 Araújo, A., & Valio, A. 2023, MNRAS, 522, L16, doi: 10.1093/mnrasl/slad034
-
[3]
2008, Journal of Geophysical Research (Space Physics), 113, A03S04, doi: 10.1029/2007JA012422
Archontis, V. 2008, Journal of Geophysical Research (Space Physics), 113, A03S04, doi: 10.1029/2007JA012422
-
[4]
Balona, L. A., & Abedigamba, O. P. 2016, MNRAS, 461, 497, doi: 10.1093/mnras/stw1443
-
[5]
Benomar, O., Bazot, M., Nielsen, M. B., et al. 2018, Science, 361, 1231, doi: 10.1126/science.aao6571
-
[6]
Berdyugina, S. V. 2005, Living Reviews in Solar Physics, 2, 8, doi: 10.12942/lrsp-2005-8
-
[7]
A., Huber, D., Gaidos, E., & van Saders, J
Berger, T. A., Huber, D., Gaidos, E., & van Saders, J. L. 2018, ApJ, 866, 99, doi: 10.3847/1538-4357/aada83
-
[8]
Bornmann, P. L., & Shaw, D. 1994, SoPh, 150, 127, doi: 10.1007/BF00712882
Show all 98 references
-
[9]
J., Koch, D., Basri, G., et al
Borucki, W. J., Koch, D., Basri, G., et al. 2010, Science, 327, 977, doi: 10.1126/science.1185402
2010 doi
-
[10]
J., & Hartigan, P
Bradshaw, S. J., & Hartigan, P. 2014, ApJ, 795, 79, doi: 10.1088/0004-637X/795/1/79
2014 doi
-
[11]
N., Lanza, A
Breton, S. N., Lanza, A. F., Messina, S., et al. 2024, A&A, 689, A229, doi: 10.1051/0004-6361/202449893
2024 doi
-
[12]
S., Strugarek, A., Noraz, Q., et al
Brun, A. S., Strugarek, A., Noraz, Q., et al. 2022, ApJ, 926, 21, doi: 10.3847/1538-4357/ac469b
2022 doi
-
[13]
Chen, P. F. 2011, Living Reviews in Solar Physics, 8, 1, doi: 10.12942/lrsp-2011-1
2011 doi
-
[14]
Cheung, M. C. M., & Isobe, H. 2014, Living Reviews in Solar Physics, 11, 3, doi: 10.12942/lrsp-2014-3 9 ftp://ftp.pmodwrc.ch/pub/data/irradiance/virgo/TSI/
2014 doi
-
[15]
W., Schrijver, C
Cliver, E. W., Schrijver, C. J., Shibata, K., & Usoskin, I. G. 2022, Living Reviews in Solar Physics, 19, 2, doi: 10.1007/s41116-022-00033-8
2022 doi
-
[16]
2006, PASP, 118, 1351, doi: 10.1086/507773
Croll, B. 2006, PASP, 118, 1351, doi: 10.1086/507773
2006 doi
-
[17]
B., Aschwanden, M
Crosby, N. B., Aschwanden, M. J., & Dennis, B. R. 1993, SoPh, 143, 275, doi: 10.1007/BF00646488
1993 doi
-
[18]
2015, PhD thesis, University of Washington, Seattle
Davenport, J. 2015, PhD thesis, University of Washington, Seattle
2015
-
[19]
F., Howarth, I
Donati, J. F., Howarth, I. D., Jardine, M. M., et al. 2006, MNRAS, 370, 629, doi: 10.1111/j.1365-2966.2006.10558.x
2006
-
[20]
Doyle, L., Ramsay, G., & Doyle, J. G. 2020, MNRAS, 494, 3596, doi: 10.1093/mnras/staa923
2020 doi
-
[21]
G., Wu, K., & Scullion, E
Doyle, L., Ramsay, G., Doyle, J. G., Wu, K., & Scullion, E. 2018, MNRAS, 480, 2153, doi: 10.1093/mnras/sty1963
2018 doi
-
[22]
G., Dennis, B
Emslie, A. G., Dennis, B. R., Shih, A. Y., et al. 2012, ApJ, 759, 71, doi: 10.1088/0004-637X/759/1/71
2012 doi
-
[23]
D., Montet, B
Feinstein, A. D., Montet, B. T., Ansdell, M., et al. 2020, AJ, 160, 219, doi: 10.3847/1538-3881/abac0a
2020 doi
-
[24]
P., Schmutz, W., et al
Finsterle, W., Montillet, J. P., Schmutz, W., et al. 2021, Scientific reports, 11, 7835 Fröhlich, C., Romero, J., Roth, H., et al. 1995, SoPh, 162, 101, doi: 10.1007/BF00733428 Gaia Collaboration, Brown, A. G. A., Vallenari, A., et al. 2018, A&A, 616, A1, doi: 10.1051/0004-636...
2021 doi
-
[25]
Giovanelli, R. G. 1939, ApJ, 89, 555, doi: 10.1086/144081
1939 doi
-
[26]
Gizon, L., & Solanki, S. K. 2003, ApJ, 589, 1009, doi: 10.1086/374715 —. 2004, SoPh, 220, 169, doi: 10.1023/B:SOLA.0000031378.29215.0c
2003
-
[27]
Gnevyshev, M. N. 1938, Izvestiya Glavnoj Astronomicheskoj Observatorii v Pulkove, 16, 36
1938
-
[28]
Greatrix, G. R. 1963, MNRAS, 126, 123, doi: 10.1093/mnras/126.2.123
1963 doi
-
[29]
S., & Henry, G
Hall, D. S., & Henry, G. W. 1994, International Amateur-Professional Photoelectric Photometry Communications, 55, 51 20
1994
-
[30]
Hathaway, D. H. 2015, Living Reviews in Solar Physics, 12, 4, doi: 10.1007/lrsp-2015-4
2015 doi
-
[31]
L., Davenport, J
Hawley, S. L., Davenport, J. R. A., Kowalski, A. F., et al. 2014, ApJ, 797, 121, doi: 10.1088/0004-637X/797/2/121
2014 doi
-
[32]
W., Eaton, J
Henry, G. W., Eaton, J. A., Hamer, J., & Hall, D. S. 1995, ApJS, 97, 513, doi: 10.1086/192149
1995 doi
-
[33]
C., & Willis, D
Henwood, R., Chapman, S. C., & Willis, D. M. 2010, SoPh, 262, 299, doi: 10.1007/s11207-009-9419-5
2010 doi
-
[34]
2011, ApJ, 740, 12, doi: 10.1088/0004-637X/740/1/12 Işik, E., Schüssler, M., & Solanki, S
Hotta, H., & Yokoyama, T. 2011, ApJ, 740, 12, doi: 10.1088/0004-637X/740/1/12 Işik, E., Schüssler, M., & Solanki, S. K. 2007, A&A, 464, 1049, doi: 10.1051/0004-6361:20066623
2011 doi
-
[35]
2023, ApJ, 948, 64, doi: 10.3847/1538-4357/acbd36
Ikuta, K., Namekata, K., Notsu, Y., et al. 2023, ApJ, 948, 64, doi: 10.3847/1538-4357/acbd36
2023 doi
-
[36]
2020, ApJ, 902, 73, doi: 10.3847/1538-4357/abae5f
Ikuta, K., Maehara, H., Notsu, Y., et al. 2020, ApJ, 902, 73, doi: 10.3847/1538-4357/abae5f
2020 doi
-
[37]
2018, MNRAS, 479, 391, doi: 10.1093/mnras/sty1358
Kamiaka, S., Benomar, O., & Suto, Y. 2018, MNRAS, 479, 391, doi: 10.1093/mnras/sty1358
2018 doi
-
[38]
1975, SoPh, 42, 107, doi: 10.1007/BF00153288
Krause, F., & Ruediger, G. 1975, SoPh, 42, 107, doi: 10.1007/BF00153288
1975 doi
-
[39]
W., Shimizu, T., & Ichimoto, K
Kubo, M., Lites, B. W., Shimizu, T., & Ichimoto, K. 2008, ApJ, 686, 1447, doi: 10.1086/592064 Künzel, H. 1960, Astronomische Nachrichten, 285, 271, doi: 10.1002/asna.19592850516
2008 doi
-
[40]
J., Lee, J.-Y., Lee, K.-S., & Na, H
Lee, K., Moon, Y. J., Lee, J.-Y., Lee, K.-S., & Na, H. 2012, SoPh, 281, 639, doi: 10.1007/s11207-012-0091-9
2012 doi
-
[41]
J., & Nakariakov, V
Lee, K., Moon, Y. J., & Nakariakov, V. M. 2016, ApJ, 831, 131, doi: 10.3847/0004-637X/831/2/131
2016 doi
-
[42]
2024, ApJL, 976, L2, doi: 10.3847/2041-8213/ad8c37
Li, F., Rao, C., Wang, H., et al. 2024, ApJL, 976, L2, doi: 10.3847/2041-8213/ad8c37
2024 doi
-
[43]
2017, PASJ, 69, 41, doi: 10.1093/pasj/psx013
Maehara, H., Notsu, Y., Notsu, S., et al. 2017, PASJ, 69, 41, doi: 10.1093/pasj/psx013
2017 doi
-
[44]
2015, Earth, Planets and Space, 67, 59, doi: 10.1186/s40623-015-0217-z
Maehara, H., Shibayama, T., Notsu, Y., et al. 2015, Earth, Planets and Space, 67, 59, doi: 10.1186/s40623-015-0217-z
2015 doi
-
[45]
2012, Nature, 485, 478, doi: 10.1038/nature11063
Maehara, H., Shibayama, T., Notsu, S., et al. 2012, Nature, 485, 478, doi: 10.1038/nature11063
2012 doi
-
[46]
F., Livi, S
Martin, S. F., Livi, S. H. B., & Wang, J. 1985, Australian Journal of Physics, 38, 929, doi: 10.1071/PH850929 Martinez Pillet, V., Moreno-Insertis, F., & Vazquez, M. 1993, A&A, 274, 521
1985 doi
-
[47]
M., et al
Mathur, S., Huber, D., Batalha, N. M., et al. 2017, ApJS, 229, 30, doi: 10.3847/1538-4365/229/2/30
2017 doi
-
[48]
2014, ApJS, 211, 24, doi: 10.1088/0067-0049/211/2/24
McQuillan, A., Mazeh, T., & Aigrain, S. 2014, ApJS, 211, 24, doi: 10.1088/0067-0049/211/2/24
2014 doi
-
[49]
U., Weiss, N
Meyer, F., Schmidt, H. U., Weiss, N. O., & Wilson, P. R. 1974, MNRAS, 169, 35, doi: 10.1093/mnras/169.1.35
1974 doi
-
[50]
2012, Nature, 486, 240, doi: 10.1038/nature11123
Miyake, F., Nagaya, K., Masuda, K., & Nakamura, T. 2012, Nature, 486, 240, doi: 10.1038/nature11123
2012 doi
-
[51]
A., Pevtsov, A
Nagovitsyn, Y. A., Pevtsov, A. A., & Osipova, A. A. 2018, Astronomy Letters, 44, 202, doi: 10.1134/S1063773718020056
2018 doi
-
[52]
2017, ApJ, 851, 91, doi: 10.3847/1538-4357/aa9b34
Namekata, K., Sakaue, T., Watanabe, K., et al. 2017, ApJ, 851, 91, doi: 10.3847/1538-4357/aa9b34
2017 doi
-
[53]
2019, ApJ, 871, 187, doi: 10.3847/1538-4357/aaf471
Namekata, K., Maehara, H., Notsu, Y., et al. 2019, ApJ, 871, 187, doi: 10.3847/1538-4357/aaf471
2019 doi
-
[54]
Namekata, K., Davenport, J. R. A., Morris, B. M., et al. 2020, ApJ, 891, 103, doi: 10.3847/1538-4357/ab7384
2020 doi
-
[55]
S., Petit, P., et al
Namekata, K., Airapetian, V. S., Petit, P., et al. 2024a, ApJ, 961, 23, doi: 10.3847/1538-4357/ad0b7c
-
[56]
2024b, ApJ, 976, 255, doi: 10.3847/1538-4357/ad85df
Namekata, K., Ikuta, K., Petit, P., et al. 2024b, ApJ, 976, 255, doi: 10.3847/1538-4357/ad85df
-
[57]
2015, PASJ, 67, 33, doi: 10.1093/pasj/psv002
Notsu, Y., Honda, S., Maehara, H., et al. 2015, PASJ, 67, 33, doi: 10.1093/pasj/psv002
2015 doi
-
[58]
2013, ApJ, 771, 127, doi: 10.1088/0004-637X/771/2/127
Notsu, Y., Shibayama, T., Maehara, H., et al. 2013, ApJ, 771, 127, doi: 10.1088/0004-637X/771/2/127
2013 doi
-
[59]
2019, ApJ, 876, 58, doi: 10.3847/1538-4357/ab14e6
Notsu, Y., Maehara, H., Honda, S., et al. 2019, ApJ, 876, 58, doi: 10.3847/1538-4357/ab14e6
2019 doi
-
[60]
2025, ApJ, 978, 142, doi: 10.3847/1538-4357/ad9919
Obase, T., Bajo, K.-i., Otsuki, Y., & Yurimoto, H. 2025, ApJ, 978, 142, doi: 10.3847/1538-4357/ad9919
2025 doi
-
[61]
2021, ApJ, 906, 72, doi: 10.3847/1538-4357/abc8f5
Okamoto, S., Notsu, Y., Maehara, H., et al. 2021, ApJ, 906, 72, doi: 10.3847/1538-4357/abc8f5
2021 doi
-
[62]
Parker, E. N. 1955, ApJ, 121, 491, doi: 10.1086/146010
1955 doi
- [63]
-
[64]
1997, SoPh, 176, 249, doi: 10.1023/A:1004988123265
Petrovay, K., & van Driel-Gesztelyi, L. 1997, SoPh, 176, 249, doi: 10.1023/A:1004988123265
1997 doi
-
[65]
H., An, D., Molenda-Żakowicz, J., et al
Pinsonneault, M. H., An, D., Molenda-Żakowicz, J., et al. 2012, ApJS, 199, 30, doi: 10.1088/0067-0049/199/2/30
2012 doi
-
[66]
R., & Forbes, T
Priest, E. R., & Forbes, T. G. 2002, A&A Rv, 10, 313, doi: 10.1007/s001590100013
2002 doi
-
[67]
2014, Experimental Astronomy, 38, 249, doi: 10.1007/s10686-014-9383-4
Rauer, H., Catala, C., Aerts, C., et al. 2014, Experimental Astronomy, 38, 249, doi: 10.1007/s10686-014-9383-4
2014 doi
- [68]
-
[69]
2015, A&A, 583, A65, doi: 10.1051/0004-6361/201526216
Reinhold, T., & Gizon, L. 2015, A&A, 583, A65, doi: 10.1051/0004-6361/201526216
2015 doi
-
[70]
I., Solanki, S
Reinhold, T., Shapiro, A. I., Solanki, S. K., et al. 2020, Science, 368, 518, doi: 10.1126/science.aay3821
2020 doi
-
[71]
2015, ApJ, 814, 125, doi: 10.1088/0004-637X/814/2/125
Rempel, M. 2015, ApJ, 814, 125, doi: 10.1088/0004-637X/814/2/125
2015 doi
-
[72]
Rempel, M., & Cheung, M. C. M. 2014, ApJ, 785, 90, doi: 10.1088/0004-637X/785/2/90 21
2014 doi
-
[73]
R., Winn, J
Ricker, G. R., Winn, J. N., Vanderspek, R., et al. 2014, in Society of Photo-Optical Instrumentation Engineers (SPIE) Conference Series, Vol. 9143, Space Telescopes and Instrumentation 2014: Optical, Infrared, and Millimeter Wave, ed. J. Oschmann, Jacobus M., M. Clampin, G. G....
2014 doi
-
[74]
M., & Vida, K
Roettenbacher, R. M., & Vida, K. 2018, ApJ, 868, 3, doi: 10.3847/1538-4357/aae77e
2018 doi
-
[75]
2000, ApJ, 540, 583, doi: 10.1086/309303
Sammis, I., Tang, F., & Zirin, H. 2000, ApJ, 540, 583, doi: 10.1086/309303
2000 doi
-
[76]
J., Title, A
Schrijver, C. J., Title, A. M., Harvey, K. L., et al. 1998, Nature, 394, 152, doi: 10.1038/28108
1998 doi
-
[77]
2011, Living Reviews in Solar Physics, 8, 6, doi: 10.12942/lrsp-2011-6
Shibata, K., & Magara, T. 2011, Living Reviews in Solar Physics, 8, 6, doi: 10.12942/lrsp-2011-6
2011 doi
-
[78]
2013, PASJ, 65, 49, doi: 10.1093/pasj/65.3.49
Shibata, K., Isobe, H., Hillier, A., et al. 2013, PASJ, 65, 49, doi: 10.1093/pasj/65.3.49
2013 doi
-
[79]
2013, ApJS, 209, 5, doi: 10.1088/0067-0049/209/1/5
Shibayama, T., Maehara, H., Notsu, S., et al. 2013, ApJS, 209, 5, doi: 10.1088/0067-0049/209/1/5
2013 doi
-
[80]
1995, PASJ, 47, 251
Shimizu, T. 1995, PASJ, 47, 251
1995
-
[81]
W., & Leighton, R
Simon, G. W., & Leighton, R. B. 1964, ApJ, 140, 1120, doi: 10.1086/148010
1964 doi
- [82]
-
[83]
G., & Bopp, B
Strassmeier, K. G., & Bopp, B. W. 1992, A&A, 259, 183
1992
-
[84]
2021, Living Reviews in Solar Physics, 18, 4, doi: 10.1007/s41116-021-00030-3
Temmer, M. 2021, Living Reviews in Solar Physics, 18, 4, doi: 10.1007/s41116-021-00030-3
2021 doi
-
[85]
E., Caldwell, D
Thompson, S. E., Caldwell, D. A., Jenkins, J. M., et al. 2016, Kepler Data Release 25 Notes, Kepler Science Document KSCI-19065-002, id.3. Edited by Jon Jenkins and Michael R. Haas
2016
-
[86]
2017, ApJ, 834, 56, doi: 10.3847/1538-4357/834/1/56
Nagashima, K. 2017, ApJ, 834, 56, doi: 10.3847/1538-4357/834/1/56
2017 doi
-
[87]
2017, ApJ, 850, 39, doi: 10.3847/1538-4357/aa95c2
Toriumi, S., & Takasao, S. 2017, ApJ, 850, 39, doi: 10.3847/1538-4357/aa95c2
2017 doi
-
[88]
2019, Living Reviews in Solar Physics, 16, 3, doi: 10.1007/s41116-019-0019-7
Toriumi, S., & Wang, H. 2019, Living Reviews in Solar Physics, 16, 3, doi: 10.1007/s41116-019-0019-7
2019 doi
-
[89]
F., & Wang, F
Tu, Z.-L., Yang, M., Wang, H. F., & Wang, F. Y. 2021, ApJS, 253, 35, doi: 10.3847/1538-4365/abda3c
2021 doi
-
[90]
J., & Wang, F
Tu, Z.-L., Yang, M., Zhang, Z. J., & Wang, F. Y. 2020, ApJ, 890, 46, doi: 10.3847/1538-4357/ab6606
2020 doi
-
[91]
2023, SSRv, 219, 73, doi: 10.1007/s11214-023-01018-1 van Ballegooijen, A
Usoskin, I., Miyake, F., Baroni, M., et al. 2023, SSRv, 219, 73, doi: 10.1007/s11214-023-01018-1 van Ballegooijen, A. A., & Martens, P. C. H. 1989, ApJ, 343, 971, doi: 10.1086/167766 van Driel-Gesztelyi, L., & Green, L. M. 2015, Living Reviews in Solar Physics, 12, 1, doi: 10....
2023 doi
-
[92]
I., et al
Vasilyev, V., Reinhold, T., Shapiro, A. I., et al. 2024, Science, 386, 1301, doi: 10.1126/science.adl5441
2024 doi
-
[93]
E., et al
Virtanen, P., Gommers, R., Oliphant, T. E., et al. 2020, Nature Methods, 17, 261, doi: 10.1038/s41592-019-0686-2
2020 doi
- [94]
-
[95]
1955, Ergebnisse und Probleme der Sonnenforschung
Waldmeier, M. 1955, Ergebnisse und Probleme der Sonnenforschung. (Leipzig, Geest & Portig)
1955
-
[96]
F., & Howard, T
Webb, D. F., & Howard, T. A. 2012, Living Reviews in Solar Physics, 9, 3, doi: 10.12942/lrsp-2012-3
2012 doi
-
[97]
Welsch, B. T. 2006, ApJ, 638, 1101, doi: 10.1086/498638
2006 doi
-
[98]
A., Maehara, H., Airapetian, V., et al
Yamashiki, Y. A., Maehara, H., Airapetian, V., et al. 2019, ApJ, 881, 114, doi: 10.3847/1538-4357/ab2a71
2019 doi
Reviewed August 16, 2026 · model on record in the stance chip above.
Discussion (0). Continue with ORCID to comment.