REVIEW 4 major objections 6 minor 2 references
Modeling Solar Spectral Irradiance (SSI) from Iron lines using the COronal DEnsity and Temperature (CODET) model version 1.1
T0 review · 4 major / 6 minor · reviewed 2026-08-16 · deepseek-v4-flash
Pith's one-line read The CODET model version 1.1 claims that daily EUV irradiance in two iron lines can be estimated from photospheric magnetograms alone, bridging the gap left when the SDO/EVE MEGS-A detector failed in 2014.
desk verdict CODET v1.1 is a useful incremental update with a real external check at 28.4 nm, but the 'reliable estimate' claim overreaches; deserves peer review with revisions. read the letter →
The pith
A machine-rendered reading of the paper's core claim, the machinery that carries it, and where it could break.
The reading
What carries the argument
The load-bearing object is the pair of power-law scalings $N(B)=N_o(B/B_s)^\gamma$ and $T(B)=T_o(B/B_s)^\alpha$ (with a floor temperature $T_o$ for weak-field regions), where $B$ is the magnitude of the magnetic field from a potential-field source-surface extrapolation of the observed photospheric magnetogram. These scalings convert each magnetic map into a three-dimensional coronal density and temperature structure; the emission-measure integral $I(\lambda)=\iint R(\lambda)\,G(\lambda,T)\,d\lambda\,N^2\,ds$, with the contribution function $G$ from the CHIANTI atomic database, converts that structure into full-disc intensities. An evolutionary optimizer selects the five free parameters by minimizing the $\chi^2$ difference between modeled and observed daily irradiance. Version 1.1's changes are the use of actual SDO/EVE irradiance as the fitting target instead of model-filled TIMED/SEE data, the addition of the 28.4 nm line alongside 21.1 nm, and line-of-sight integration of intensity maps from $1.0\,R_\odot$ to $2.5\,R_\odot$.
What would settle it
Refit the five scaling parameters using only GOES/EUVS 28.4 nm data from June 2017 to October 2024 and compare them with the EVE-fit values $\gamma=1.3077$, $\alpha=-0.2781$, $N_o=8.2819\times10^8\,\mathrm{cm^{-3}}$, $T_o=1.8558\times10^6\,\mathrm{K}$, $B_s=7.9966\,\mathrm{G}$; if the refit parameters drift by more than their fitting uncertainties, the time-invariance premise is falsified. A simpler check is to split the 2017-2024 GOES comparison into quiet-Sun and active-region days: a systematic error pattern that grows with magnetic complexity would show that the fixed power laws miss a state-dependent factor rather than a constant offset.
Extended reading notes
Core claim
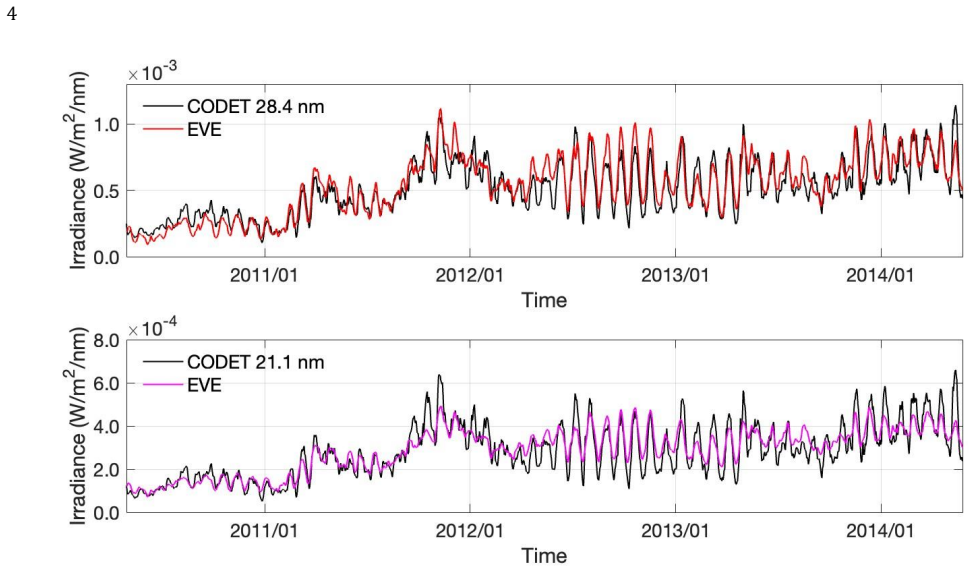
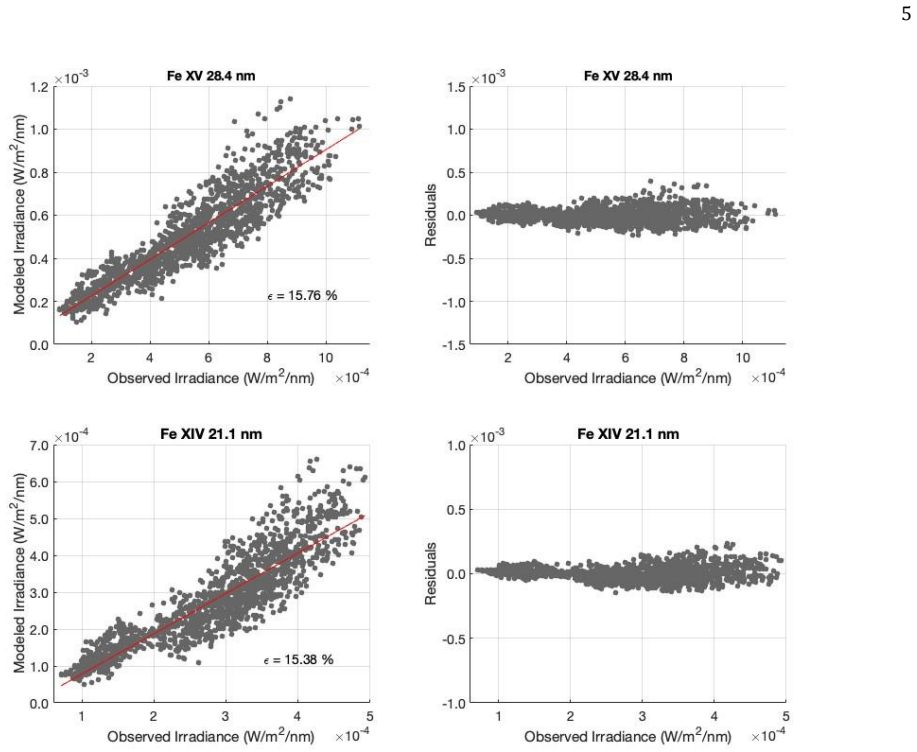
On its own terms, the paper establishes that the chain magnetogram → potential-field extrapolation → power-law density and temperature scalings → emission-measure synthesis preserves enough information to reproduce daily full-disk irradiance in two coronal lines. Simultaneously fitting Fe XV 28.4 nm and Fe XIV 21.1 nm to SDO/EVE MEGS-A observations from 2010 to 2014 yields mean absolute percentage errors near 15% for both lines ($R^2 = 0.849$ and $0.796$), with the fitted parameters $\gamma = 1.3077$, $\alpha = -0.2781$, $N_o = 8.2819\times10^8\,\mathrm{cm^{-3}}$, $T_o = 1.8558\times10^6\,\mathrm{K}$, and $B_s = 7.9966\,\mathrm{G}$. Applied forward to every day with SOHO/MDI or SDO/HMI magnetograms, the same parameters produce daily SSI from July 1996 to October 2024, including the post-2014 MEGS-A gap; out-of-sample comparisons give errors of about 26% at 28.4 nm against GOES/EUVS and about 42% at 21.1 nm against AIA daily means. The paper therefore claims that a reliable EUV irradiance time series can be maintained where direct observations no longer exist.
Load-bearing premise
The entire prediction rests on the premise that coronal density and temperature at each height are set by the local magnetic field strength through fixed power-law relationships, with parameters learned from 2010-2014 and then applied unchanged to 1996-2024; if that relationship drifts across solar cycles or depends on active-region complexity, the gap-filling irradiance inherits the drift.
Editorial extensions
If this is right
- A continuous daily SSI record at 28.4 nm and 21.1 nm now exists from July 1996 to October 2024, covering solar cycles 23 and 24 plus the rising phase of cycle 25, wherever MDI or HMI magnetograms are available.
- The post-2014 gap left by the MEGS-A detector failure can be filled with model output, and the paper's GOES/EUVS comparison suggests the 28.4 nm channel carries about 26% error there.
- Full-disc intensity maps and density maps are generated for any date with magnetogram coverage, giving EUV imagers a synthetic comparison product in wavelengths where observations may be missing.
- The same parameter set reproduces the 21.1 nm line against AIA daily means to about 42% error, so users of the predicted record should carry that uncertainty into any derived product.
- Because the two fitted lines form at nearly the same temperature ($\log_{10}T \approx 6.3$ K), the simultaneous fit is well constrained, which supports the model's use of a single density-temperature relation for both lines.
Reading between the lines
- If the fixed power laws hold across cycles, the same two-line fitting strategy could be extended to other iron lines with formation temperatures near $\log_{10}T\approx6.3$ K, widening the synthetic EUV spectrum without new calibration data.
- A natural test of time invariance would be to refit the five parameters on post-2014 GOES/EUVS data alone; any drift in the best-fit values would quantify the cycle dependence that the single-fit approach hides.
- Users of these irradiance series for ionosphere-thermosphere modeling should treat the reported 26% and 42% out-of-sample errors as a floor, because the current comparisons cannot separate instrumental bandpass mismatch from true coronal change.
- The empirical factor of $7\times10^5$ used to scale SDO/AIA data into irradiance units is a candidate for independent cross-calibration on MEGS-A-era days; replacing it with a measured conversion would sharpen the 21.1 nm validation.
Signed reviews
Editorial analysis
A structured set of objections, weighed in public.
Referee Report
Summary. The manuscript presents CODET v1.1, a physics-based model that derives coronal density and temperature from PFSS magnetic-field magnitude via power-law scalings (Appendix A, Eqs. A2-A4), computes EUV solar spectral irradiance (SSI) at Fe XV 28.4 nm and Fe XIV 21.1 nm using CHIANTI 10.0.2, fits five free parameters to SDO/EVE MEGS-A observations from April 30, 2010 to May 26, 2014, and then predicts daily SSI from July 1996 to October 2024. The in-sample fit achieves R2 = 0.849 at 28.4 nm and R2 = 0.796 at 21.1 nm, with MAPE of about 15% in both lines. Out-of-sample comparisons give MAPE of about 26% versus GOES/EUVS at 28.4 nm (2017-2024) and about 42% versus SDO/AIA at 21.1 nm after applying an empirical scaling factor of 7e5. The paper concludes that CODET v1.1 provides a reliable estimate of SSI in EUV wavelengths where no observational data exist, particularly after the SDO/EVE MEGS-A era.
Significance. If the predictive claims survive scrutiny, the model would provide a continuous, physically motivated daily SSI record at two coronal lines across nearly three solar cycles, with associated full-disc intensity and density maps, useful for ionosphere-thermosphere and planetary aeronomy studies. The paper has clear strengths: it uses openly available magnetogram and EVE data, a transparent optimization over a small parameter set, and a genuinely external validation against GOES/EUVS after the fitting interval. The in-sample fit is good, and the modeling ingredients (optically thin emission, CHIANTI contribution functions, PFSS extrapolations) are standard. However, the central claim of reliable estimates in unobserved periods is not yet established because the validation errors are not stratified by activity level, the 21.1 nm comparison rests on a post-hoc empirical scaling, and the model's own acknowledged failure on complex active regions coincides with the high-activity epochs that dominate the post-2014 gap.
major comments (4)
- [Section 3.2 and Section 4 (Figs. 4 and 9)] The claim that CODET v1.1 provides reliable SSI estimates in unobserved periods (abstract and Section 4) is not supported by the presented validation because the errors are reported only as period averages and are not stratified by solar activity. The paper itself identifies days with large, complex active regions as poorly reproduced (Section 4, Figure 4), attributing this to the PFSS extrapolation's inability to describe such regions. Since the post-MEGS-A gap includes the rise to cycle 25 maximum and the 1996-2024 interval includes cycle 23 maximum, the model's known failure mode is concentrated exactly in the epochs targeted by the central claim. A period-averaged MAPE of about 26% at 28.4 nm can mask a systematic bias at solar maximum. The authors should provide validation metrics stratified by activity level (e.g., bins in F10.7 or sunspot number) and discuss whether the out-of-sample error is stable across the cycle.
- [Section 3.2 (Figure 9)] The AIA-based validation at 21.1 nm is not an independent test of model accuracy because the comparison requires dividing AIA full-disc daily mean DN values by an empirical factor of 7e5, chosen to make the two time series comparable. With the scaling factor selected post hoc, the reported MAPE of about 42% conflates model error with the uncertainty in the AIA-to-irradiance conversion. To support a quantitative error claim, the scaling should be fixed independently, for example from a contemporaneous EVE/AIA overlap, or the 21.1 nm comparison should be explicitly labeled as qualitative. As it stands, the abstract's error figure for 21.1 nm rests on a non-independent calibration.
- [Abstract and Section 3 (Figures 2 and 3)] The statement that the model 'described well observational data ... with less than 20% error' during 2010-2014 refers to the training period used to fit the five free parameters, so the reported R2 values and MAPE of about 15% measure in-sample agreement rather than predictive skill. This distinction should be made explicit in the abstract. The only genuinely external benchmark is the GOES/EUVS comparison at 28.4 nm (2017-2024, MAPE about 26%), and the 'reliable estimate' conclusion should be based primarily on that benchmark. Please revise the wording so that the abstract does not present training-data performance as evidence for predictive reliability.
- [Appendix A (Eqs. A2-A4) and Section 4] The model assumes that coronal density and temperature are stationary power-law functions of the local PFSS magnetic-field magnitude, with one set of parameters fitted to 2010-2014 applied to 1996-2024. The paper provides no test of this stationarity, and its own admission that complex active regions are poorly reproduced suggests the assumption is fragile at high activity. A concrete and feasible test is to compare model density and temperature profiles against independent coronal diagnostics at different phases of the cycle, for example Hinode/EIS or Metis/SoLO, as the paper lists as future work. Without at least a basic check of parameter stability across activity levels, the extrapolation to unobserved periods carries an unquantified bias risk that directly affects the paper's core claim.
minor comments (6)
- [Section 3.2, Figure 9 caption] The caption states 'October 27, 202' with an incomplete year; it should read 'October 27, 2024'.
- [Throughout] The author name appears as both 'Rodrí guez-Go mez' and 'Rodrí guez Go mez'; please standardize the spelling and spacing.
- [Table 1 and Appendix A, Eq. A4] In Table 1, the units for the power-law indices gamma and alpha are listed as '...' but these are dimensionless; also, the units in Equation A4 for temperature are given as [cm^-3] but should be [K].
- [Section 2] The statement that the mean intensity ratios EVE28.4/TIMED28.5 and EVE21.1/TIMED21.5 are about 9 and 3 lacks a figure or table; please provide the comparison period and data versions, or a citation, so that the claim can be verified.
- [Section 3, Figure 4] The notation '2sigma^2 = +/- 41.35%' is confusing because the standard expression for a 95% interval would be written as '+/- 2sigma'. Please clarify how the error interval was constructed.
- [Appendix A, Eq. A5] Equation A5 includes an integral over wavelength with an instrumental response R(lambda), but the text sets R(lambda) = 1; this simplification should be stated more prominently, because it means the modeled intensity neglects instrumental bandpass effects and this may matter when comparing with broadband or filtered observations.
Circularity Check
CODET v1.1's central predictive claim is not circular: the GOES/EUVS out-of-sample comparison provides independent support, though the AIA validation uses an ad hoc scaling constant and the scaling-law ansatz is inherited from prior self-cited work.
-
other
[Section 3.2, Figure 9; Section 4, fourth bullet]
"Although the primary goal of using daily mean SDO/AIA values was to make a qualitative comparison between observed daily mean SSI and the model prediction performance, an error analysis was performed. The Mean Absolute Percentage Error correspond to ϵ ∼ 26% and 42% for 28.4 nm and 21.1 nm, respectively. ... to compare SSI from CODET version 1.1 and AIA was required to divide AIA full disc daily mean values by an empirical value of 7 × 10^5 to scale with the SSI at 21.1 nm."
The quoted 42% MAPE for the 21.1 nm prediction is computed only after applying an empirical multiplicative constant to the observed AIA data. Because MAPE depends on this chosen divisor, the validation metric is partly constructed by the scaling choice rather than being a parameter-free test of the model's absolute irradiance. This affects the less central AIA comparison; the GOES/EUVS 28.4 nm comparison is not similarly scaled and remains an independent benchmark.
full rationale
The paper's main predictive claim (reliable SSI after the SDO/EVE MEGS-A era) does not reduce to its inputs. The CODET v1.1 parameters (γ, α, N0, T0, Bs) are fitted to SDO/EVE data from 2010–2014, and the paper explicitly describes the <20% agreement in that interval as goodness-of-fit obtained using those data, not as an out-of-sample prediction. The genuinely predictive claim is supported by the GOES/EUVS comparison in 2017–2024, data that were not used in fitting. Self-citations to Rodríguez-Gómez et al. (2018) supply the scaling-law ansatz and model history, but the present version refits its free parameters to EVE data, so the central derivation is not forced by those citations. The AIA 21.1 nm validation is weakened by the ad hoc 7×10^5 scaling and is acknowledged as partly qualitative; this is a validation limitation, not a construction of the central result. The paper also candidly notes failure on complex active regions, supporting the view that the in-sample statistics are not overclaimed. Overall, no step of the derivation is equivalent by definition to its inputs; the minor scaling and self-citation issues warrant a low score only.
Assumptions & free parameters
free parameters (6)
- Density power-law index gamma =
1.3077
- Temperature power-law index alpha =
-0.2781
- Background density No =
8.2819e8 cm-3
- Background temperature To =
1.8558e6 K
- Magnetic field constant Bs =
7.9966 G
- AIA empirical scaling factor =
7e5
assumptions (5)
- domain assumption PFSS extrapolation of photospheric magnetograms represents the coronal magnetic field from 1.0 to 2.5 R_sun.
- ad hoc to paper Density and temperature are power-law functions of the local magnetic field magnitude.
- domain assumption Emission lines are optically thin and intensity follows the emission measure formalism with CHIANTI contribution functions.
- domain assumption The scaling law parameters fitted to 2010 to 2014 remain valid for 1996 to 2024.
- domain assumption Surface flux transport maps from Schrijver (2001) are accurate for the full 1996 to 2024 period.
Cite this review
Pith. "Pith review of Modeling Solar Spectral Irradiance (SSI) from Iron lines using the COronal DEnsity and Temperature (CODET) model version 1.1." pith.science (2026). https://pith.science/paper/VHAKUHFZ
@misc{pith2026250417072,
  author       = {Pith},
  title        = {Pith review of: Modeling Solar Spectral Irradiance (SSI) from Iron lines using the COronal DEnsity and Temperature (CODET) model version 1.1},
  year         = {2026},
  howpublished = {\url{https://pith.science/paper/VHAKUHFZ}},
  note         = {Machine review of arXiv:2504.17072}
}
abstract
The COronal DEnsity and Temperature (CODET) model is a physics-based model (Rodr\'iguez-G\'omez et al. 2018; Rodr\'iguez-G\'omez 2017) . This model uses the relationship between the magnetic field, density, temperature, and EUV emission. This model provides mean daily Solar Spectral Irradiance time series in EUV wavelengths in long time scales from days to solar cycles. The current manuscript presents the updated/new CODET model version 1.1. It uses observational datasets from SDO/EVE MEGS-A at $28.4 \ \mathrm{nm}$ and $21.1 \ \mathrm{nm}$ wavelengths to obtain the goodness-of-fit between them and the modeled SSI from April 30, 2010, to May 26, 2014. The model described well observational data during that period, with less than $20\%$ error in both wavelengths. Additionally, SSI predictions are provided using the new model parameters from July 1996 to October 2024, where SOHO/MDI and SDO/HMI photospheric magnetic field data are available. These predictions were compared with GOES/EUVS at $28.4 \ \mathrm{nm}$ and mean daily values of SDO/AIA at $21.1 \ \mathrm{nm}$ data, with errors of $\sim 26\%$ and $42\%$ for $28.4 \ \mathrm{nm}$ and $21.1 \ \mathrm{nm}$, respectively. The error analysis for model fitting and predictions shows how accurate the model predictions are. Thus, the CODET model provides a reliable estimate of the Solar Spectral Irradiance time series in EUV wavelengths where no observational data is available, e.g., after the SDO/EVE MEGS-A era.
Figures

Figures from the paper (6 more)


Reference graph
Works this paper leans on
-
[1]
Anderson, P . C., & Hawkins, J. M. 2016, Journal of Geophysical Research (Space Physics), 121, 1518, doi: 10.1002/2015JA021202 Bekker, S., Milligan, R. O., & Ryakhovsky, I. A. 2024, ApJ, 971, 188, doi: 10.3847/1538-4357/ad631d Cander, L. 2019, Ionospheric Space Weather. (Springer Geophysics) Carlesso, F., Rodrí guez Go mez, J., Barbosa, A., Antunes Vieira...
-
[10]
7 https://www.chiantidatabase.org/ 5194/acp-13-3945-201310.5194/acpd-12-24557-2012 Floyd, L., Newmark, J., Cook, J., Herring, L., & McMullin, D. 2005, Journal of Atmospheric and Solar-Terrestrial Physics, 67, 3, doi: 10.1016/j.jastp.2004.07.013 Fludra, A., Del Zanna, G., Alexander, D., & Bromage, B. J. I. 1999, J. Geophys. Res., 104, 9709, doi: 10.1029/19...
arXiv 2012
Reviewed August 16, 2026 · model on record in the stance chip above.
Discussion (0). Continue with ORCID to comment.