REVIEW 3 major objections 5 minor 11 references
PyScrew: A Comprehensive Dataset Collection from Industrial Screw Driving Experiments
T0 review · 3 major / 5 minor · reviewed 2026-08-15 · deepseek-v4-flash
Pith's one-line read This paper introduces PyScrew, a public collection of six screw-driving datasets with more than 34,000 operations, aiming to give industrial process-monitoring research a standardized, reproducible resource.
desk verdict PyScrew is a genuinely useful open dataset for screw-driving research, but its headline count and DOI citations do not add up and need fixing before anyone cites it. read the letter →
The pith
A machine-rendered reading of the paper's core claim, the machinery that carries it, and where it could break.
The reading
What carries the argument
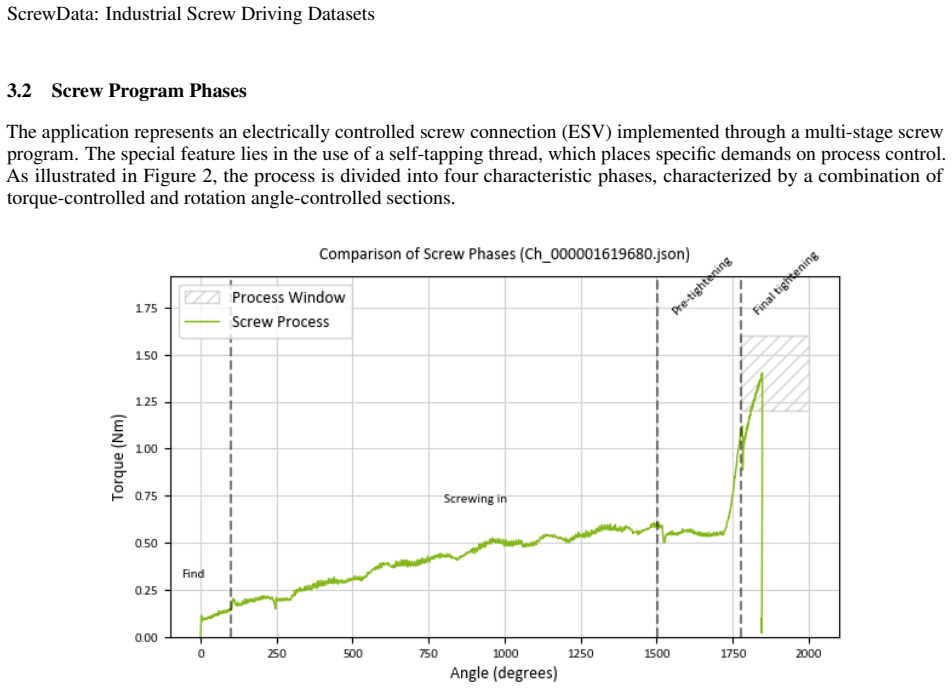
The load-bearing artifact is the standardized experimental setup combined with a hierarchical data model. Each screw drive is a multivariate time series of torque, angle, and gradient sampled at 833.33 Hz over four phases—finding, driving in, pre-tightening, and final tightening—organized by scenario, class, and operation ID, with metadata including usage count and outcome labels. This structure is what lets the same measurements serve anomaly detection, classification, feature-extraction evaluation, and process-monitoring research.
What would settle it
Train a fault classifier on the PyScrew s04 assembly-fault data and evaluate it on screw-driving traces recorded from a different automatic station with the same screw and housing; if performance on held-out industrial data falls to near chance while within-collection cross-validation stays high, the claim that the collection generalizes as a general benchmark is falsified. A lighter check: recompute the s03 control-group separability from the March 2023 and February 2024 recordings and see whether method rankings shift across recording times.
Extended reading notes
Core claim
The central claim is that PyScrew is a comprehensive open collection of screw driving data that addresses the scarcity of standardized industrial datasets. It comprises six scenarios: natural thread degradation from repeated use (s01, 5,000 runs), surface friction variations including contamination and treatments (s02, 12,500 runs), two assembly-fault collections with up to 26 and 25 error classes (s03 with 1,700 runs and s04 with 5,000 runs), and injection-molding parameter variations for the upper and lower workpieces (s05 with 2,400 runs and s06 with 7,482 runs). Every operation is captured as time series of torque, angle, and gradient at 833.33 Hz across four process phases, with metadata such as workpiece usage count and OK/NOK outcome labels. The authors provide both raw data through a persistent DOI and a purpose-built Python library that handles loading, validation, and preprocessing, so that researchers can reproduce analyses and compare methodologies fairly.
Load-bearing premise
The collection's usefulness as a general benchmark depends on one laboratory station, one screw type, and one plastic housing material capturing enough of real production variability that methods validated on it transfer to industrial practice—a limitation the authors state in Section 6.
Editorial extensions
If this is right
- The same 34,182 operations can serve as a common benchmark, so anomaly-detection and classification results from different research groups become directly comparable.
- Each scenario isolates one family of influences—thread wear (s01), surface friction (s02), assembly faults (s03-s04), fabrication parameters (s05-s06)—letting researchers attribute performance differences to a specific physical factor.
- The s05 and s06 fabrication datasets, with mostly OK outcomes, allow studies of how process parameters alter torque and angle traces before quality limits are exceeded.
- The hierarchical data model and filtering options let users focus on specific phases, measurements, or classes, supporting both exploratory analysis and machine-learning pipelines.
- Open access reduces the need for proprietary factory data, which the authors argue is a barrier to reproducible research in manufacturing quality control.
Reading between the lines
- An implied next step the authors do not spell out: the usage-count metadata in s01 could support remaining-useful-life models for plastic threads, turning the degradation dataset into a prognosis benchmark rather than just a classification one.
- Because everything was recorded on one station with one screw type and one plastic housing material, the collection is best read as a controlled testbed; whether insights transfer to other geometries, materials, or screw types is an open empirical question not settled by this paper.
- The paired error conditions in s02 (water versus oil lubricant, coarse versus fine sanding) invite studies of error-severity or signature similarity, a comparison the authors mention but do not perform.
- A testable extension would be to measure how stable feature-extraction rankings remain across the repeated control groups recorded months apart, which would quantify the collection's temporal consistency.
Signed reviews
Editorial analysis
A structured set of objections, weighed in public.
Referee Report
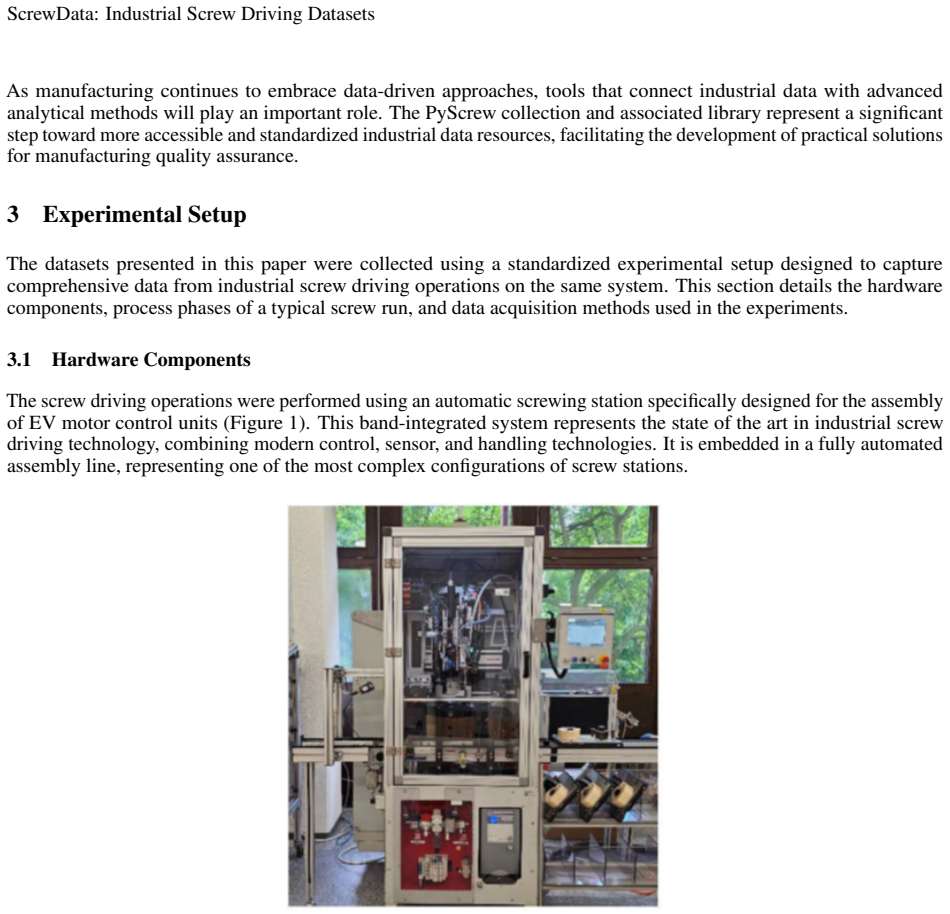
Summary. This paper describes PyScrew, a collection of six industrial screw driving datasets (s01-s06) with a claimed total of 34,182 operations. It documents the automated screwing station, the four process phases, the acquisition system (torque, angle, gradient at 833.33 Hz), the OK/NOK classification criteria, and each scenario's experimental design: thread degradation, surface friction, two assembly-fault sets, and upper/lower workpiece injection-molding variations. Access is via a Zenodo DOI and a PyPI/GitHub Python library, with code examples for loading and filtering data. The paper closes with limitations (controlled laboratory setting, single screw type and plastic housing) and future work.
Significance. PyScrew's intended contribution is a large, standardized public resource for screw driving process data. The experimental design is documented in unusual detail: a single automatic station with Bosch Rexroth components, four torque- and angle-controlled phases, 833.33 Hz acquisition, and explicit OK/NOK criteria. The six scenarios cover thread degradation, surface conditions, assembly faults, and injection-molding parameter variations, at a scale an order of magnitude beyond AURSAD. The companion Python library and persistent repository are concrete reproducibility artifacts. If the stated counts and access metadata are corrected, this is a strong contribution to reproducible manufacturing research; the paper is also honest about the controlled-laboratory limitation and its implications for transfer to real production environments.
major comments (3)
- [Section 4, Table 1] Section 4 states that 'the collection contains 34,182 individual screw driving operations' immediately before Table 1, but the Table 1 entries (5,000 + 12,500 + 1,700 + 5,000 + 2,400 + 7,482) sum to 34,082. The 100-operation discrepancy is unexplained anywhere in the manuscript. I verified that the per-scenario class tables for s02, s03, s04, s05, and s06 sum to their claimed scenario totals, so the arithmetic error is localized to the collection-level total. Because the scale of the collection is a central claim, please correct the count in the abstract, introduction, Section 4, and conclusion, or reconcile the table entries. I did not download the repository, so I cannot determine which number is correct; the manuscript as written is not self-consistent on its headline figure.
- [Section 5.1, References [4]] The data access section identifies https://doi.org/10.5281/zenodo.14729547 as the persistent DOI and states that the current version is v1.2.2, but the recommended citation in the same subsection cites v1.2.1 with DOI https://doi.org/10.5281/zenodo.15273503, while reference [4] cites v1.2.2 under the persistent DOI. A reader following the printed citation will reference a different version and DOI than the one the text calls persistent. Please make the version number and DOI consistent among Section 5.1, the recommended citation, and the reference list, and confirm which DOI is the concept DOI that tracks the latest version.
- [Section 3.3] The text says that the 833.33 Hz sampling rate results in approximately 3-4 data points per degree of rotation. At the stated spindle speeds (finding 150 rpm, screw-in 600 rpm, pre-tightening 200 rpm, final tightening 40 rpm), the corresponding densities are about 0.93, 0.23, 0.69, and 3.47 samples per degree, so the '3-4 per degree' statement holds only for the final tightening phase. The claim of 5,000-7,000 data points per operation also appears hard to reconcile with the phase angles and speeds. Please clarify whether the controller records at fixed angular increments (with 0.25 degree resolution) or fixed time intervals, and correct the derived estimates accordingly.
minor comments (5)
- [References [9]] Reference [9] contains a typo in the title, 'Machien Leanring'; it should read 'Machine Learning'.
- [Section 3.3] The phrase 'data completeness above 95%' is used repeatedly but never defined; please state how completeness is measured (for example, the fraction of expected measurement points present after validation).
- [Section 5.2] The first code example reads `data["torque values"]`, while the configuration example passes `return_measurements=["torque", "angle"]`; please clarify the actual key names returned by `get_data` so the examples are internally consistent.
- [Table 4] The row for `003_control-group-from-s01` says it uses 'first cycles from s01 control group' without specifying whether the 200 samples are the first cycle of each of 100 workpieces at two locations; please state the selection rule to make the row unambiguous.
- [Section 2.2] The description of West et al. [2] mentions an imbalanced dataset with 50,000 normal and 96 anomalous samples; since no PyScrew scenario has 50,000 samples, please state explicitly that this was a separate industrial dataset so that readers do not confuse it with the collection presented here.
Circularity Check
No circular derivation: the dataset's availability and content claims are self-contained and externally verifiable, and the paper's self-citations are applications of the data rather than load-bearing inputs.
full rationale
The paper's central claim is the existence, content, and accessibility of a collected dataset, not a derived prediction or fitted result. The collection is anchored by an external comparison to the AURSAD dataset [9], and the data is deposited on Zenodo with a persistent DOI, making the core claims independently checkable. The numerous self-citations in Sections 2 and 5.2 refer to prior analyses performed on these same datasets (e.g., [5], [7], [8]); they illustrate possible use cases but are not used as premises to derive any claim in this paper, so they do not render the dataset contribution circular. No fitted parameter is renamed as a prediction, no uniqueness theorem is imported from the authors' prior work, and no ansatz is smuggled in via citation. Section 6 explicitly limits the claim by acknowledging that the controlled laboratory setting may not fully represent industrial variability, which is an honest scope limitation rather than a circular step. The internal inconsistencies noted by the skeptic, such as the operation count discrepancy between Section 4 (34,182) and the sum of Table 1 (34,082) and the version/DOI mismatch in Section 5.1, are correctness and metadata issues, not circularity; they concern the reliability of the access instructions, not the logical structure of the derivation. Overall, the paper makes no claim that reduces by construction to its own inputs, so the circularity score is 0.
Assumptions & free parameters
assumptions (3)
- domain assumption The controlled laboratory setup represents realistic industrial screw driving conditions for the target component.
- domain assumption The OK/NOK classification criteria in Section 3.3 correctly identify connection quality.
- domain assumption The BS350 controller measurements at 833.33 Hz capture the dynamics needed to distinguish the documented fault classes.
Cite this review
Pith. "Pith review of PyScrew: A Comprehensive Dataset Collection from Industrial Screw Driving Experiments." pith.science (2026). https://pith.science/paper/BBT7PZOX
@misc{pith2026250511925,
  author       = {Pith},
  title        = {Pith review of: PyScrew: A Comprehensive Dataset Collection from Industrial Screw Driving Experiments},
  year         = {2026},
  howpublished = {\url{https://pith.science/paper/BBT7PZOX}},
  note         = {Machine review of arXiv:2505.11925}
}
read the original abstract
This paper presents a comprehensive collection of industrial screw driving datasets designed to advance research in manufacturing process monitoring and quality control. The collection comprises six distinct datasets with over 34,000 individual screw driving operations conducted under controlled experimental conditions, capturing the multifaceted nature of screw driving processes in plastic components. Each dataset systematically investigates specific aspects: natural thread degradation patterns through repeated use (s01), variations in surface friction conditions including contamination and surface treatments (s02), diverse assembly faults with up to 27 error types (s03-s04), and fabrication parameter variations in both upper and lower workpieces through modified injection molding settings (s05-s06). We detail the standardized experimental setup used across all datasets, including hardware specifications, process phases, and data acquisition methods. The hierarchical data model preserves the temporal and operational structure of screw driving processes, facilitating both exploratory analysis and the development of machine learning models. To maximize accessibility, we provide dual access pathways: raw data through Zenodo with a persistent DOI, and a purpose-built Python library (PyScrew) that offers consistent interfaces for data loading, preprocessing, and integration with common analysis workflows. These datasets serve diverse research applications including anomaly detection, predictive maintenance, quality control system development, feature extraction methodology evaluation, and classification of specific error conditions. By addressing the scarcity of standardized, comprehensive datasets in industrial manufacturing, this collection enables reproducible research and fair comparison of analytical approaches in an area of growing importance for industrial automation.
Figures
Reference graph
Works this paper leans on
-
[4]
West, N., & Deuse, J. (2025). Industrial screw driving dataset collection: Time series data for process monitoring and anomaly detection (v1.2.2) [Data set]. Nikolai West. https://doi.org/10.5281/zenodo.14729547
-
[2]
West, N., Schlegl, T., & Deuse, J. (2021). Feature extraction for time series classification using univariate descriptive statistics and dynamic time warping in a manufacturing environment. Proceedings of the 2nd IEEE International Conference on Big Data, Artificial Intelligence and Internet of Things Engineering (ICBAIE), 762-768. https://doi.org/10.1109...
arXiv 2021
-
[3]
Schlegl, T., Schlegl, S., Sciberras, A., West, N., & Deuse, J. (2021). Margin-based greedy shapelet search for robust time series classification of imbalanced data. Proceedings of the IEEE International Conference on Big Data (Big Data), 5266-5274. https://doi.org/10.1109/BigData52589.2021.9671952
arXiv 2021
-
[5]
West, N., & Deuse, J. (2024). A comparative study of machine learning approaches for anomaly detection in industrial screw driving data. Proceedings of the 57th Hawaii International Conference on System Sciences (HICSS), 1050-1059. https://hdl.handle.net/10125/106504
work page 2024
-
[6]
West, N., Trianni, A., & Deuse, J. (2024). Detection of surface-based anomalies for self-tapping screws in plastic housings using supervised machine learning. Proceedings of the 51st International Conference on Computers and Industrial Engineering (CIE51), 1-10
work page 2024
-
[7]
Henkies, M., West, N., & Deuse, J. (2025). Comparison of feature extraction methods for time series data in fault classification of screw connections. Proceedings of the 10th Changeable, Agile, Reconfigurable and Virtual Production Conference (CARV25), 1-8
work page 2025
-
[8]
West, N., & Deuse, J. (2025). Multi-class error detection in industrial screw driving operations using machine learning. Proceedings of the 11th International Conference on Time Series and Forecasting (ITISE), 1-10
work page 2025
-
[9]
Leporowski, T., Hansen, E. B., Nielson, C. K., & Bøgh, S. (2021). AURSAD: Universal Robot Screwdriving Anomaly Detection Dataset. Computer Science > Machien Leanring. (arXiv), 1-27. https://arxiv.org/abs/ 2102.01409
arXiv 2021
Show all 11 references
-
[10]
Schlegl, T., Tomaselli, D., Schlegl, S., West, N., & Deuse, J. (2022). Automated search of process control limits for fault detection in time series data. Journal of Process Control, 117, 52-64. https://doi.org/10.1016/j. jprocont.2022.07.002
2022 doi
-
[11]
& Woods, E
Tavenard, R., Faouzi, J., Vandewiele, G., Divo, F., Androz, G., Holtz, C., ... & Woods, E. (2020). Tslearn, a machine learning toolkit for time series data. Journal of Machine Learning Research, 21(118), 1-6. http: //jmlr.org/papers/v21/20-091.html
2020
-
[12]
Schlegl, H., West, N., Schlegl, S., & Deuse, J. (2023). Adaptive similarity search in time series databases. Applied Ergonomics, 108, 103992. https://doi.org/10.1016/j.aei.2022.101629 18
2023
Reviewed August 15, 2026 · model on record in the stance chip above.
Discussion (0). Continue with ORCID to comment.