REVIEW 3 major objections 5 minor 22 references
CanadaFireSat: Toward high-resolution wildfire forecasting with multiple modalities
T0 review · 3 major / 5 minor · reviewed 2026-08-07 · deepseek-v4-flash
Pith's one-line read This paper claims that fusing high-resolution Sentinel-2 time series with coarse environmental drivers yields the most accurate 100-meter wildfire probability forecasts across Canada, reaching a peak F1 of 60.3% on the 2023 test season.
desk verdict Valuable dataset with real leakage in label construction; the headline forecasting numbers should be read as partly detection until positives are filtered to new ignitions. read the letter →
The pith
A machine-rendered reading of the paper's core claim, the machinery that carries it, and where it could break.
The reading
What carries the argument
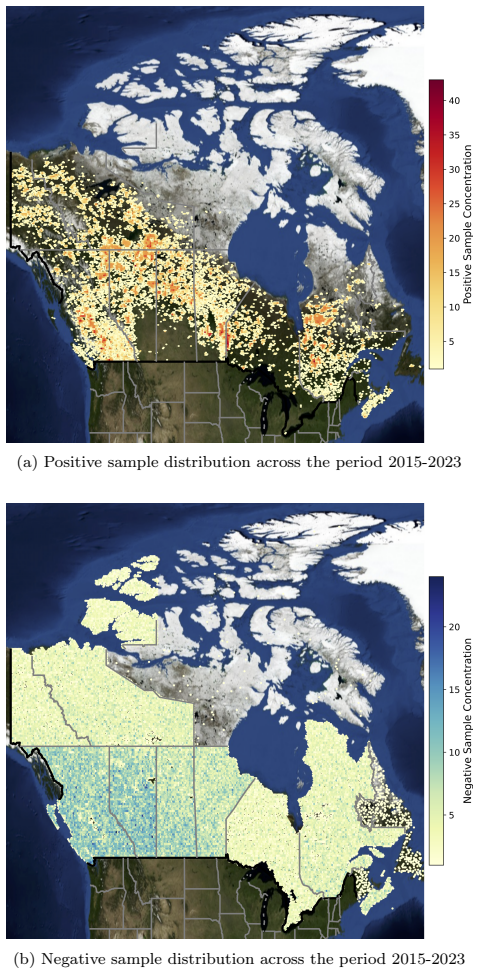
The load-bearing object is CanadaFireSat itself: a spatio-temporal benchmark built from National Burned Area Composite fire polygons sampled on a 2.8-kilometer grid, with 2.64-kilometer Sentinel-2 L1C tiles at 10-meter resolution, MODIS, ERA5-Land, and CEMS environmental predictors, an 8-day forecasting horizon, and two negative-sampling schemes including an adversarial Test Hard set. The modeling machinery is a factorized fusion design: each satellite time step is encoded independently by a pretrained ResNet-50 or DINOv2 ViT-S, temporally aggregated with ConvLSTM, while tabular environmental series are projected and encoded by an LSTM, then fused with the spatial features before patch classification at the 100-meter output resolution. This design allows coarse and high-resolution modalities to be combined while keeping the final probability map at the fine spatial scale.
What would settle it
Recompute F1 and PRAUC on the subset of test samples whose National Burned Area Composite fire start date falls inside the 8-day forecast window; if performance drops substantially relative to the full test set, part of the reported skill is detection of ongoing fires rather than prediction of new ignitions.
Extended reading notes
Core claim
The central claim is that multi-modal temporal inputs—Sentinel-2 image time series combined with environmental predictors—give the most accurate 100-meter wildfire probability forecasts, beating both satellite-only and environmental-only settings across validation, test, and adversarial test sets, with a peak F1 of 60.3% and PRAUC of 57.0 on the 2023 test set. The paper also establishes that both a ResNet-50 and a ViT-S benefit from fusion, with average gains of +1.8% and +1.1% in PRAUC and +1.3% and +1.7% in F1 over single-modality models, and that both deep models outperform the FWI baseline by double-digit margins. The authors interpret the Test Hard set, sampled adversarially to balance FWI, as revealing a lower-bound performance in which ignition rather than flammability is the discriminating factor.
Load-bearing premise
The load-bearing premise is that a label at time t means a new fire starts in the next eight days, but the dataset actually labels any fire overlapping that window, so a fire already burning in the input imagery still counts as a positive.
Editorial extensions
If this is right
- Multi-modal temporal inputs (Sentinel-2 plus environmental predictors) should be the default configuration for high-resolution wildfire forecasting on CanadaFireSat, since they outperform both single-modality settings in every metric on average.
- Deep learning models beat the knowledge-driven Fire Weather Index baseline by double-digit margins on the 2023 test set, indicating that learned multi-modal models can serve as a stronger fire-danger signal than the standard index.
- The adversarial Test Hard evaluation, where negative samples are matched to positives by FWI, yields much lower performance, so models trained and evaluated on standard negative sampling overestimate skill in extreme seasons like 2023.
- Using the full Sentinel-2 time series rather than a single recent image improves validation performance for both architectures, so temporal dynamics carry predictive information beyond a static snapshot.
- The land-cover breakdown shows weakest performance on wetland and cropland fires, so operational maps from this benchmark are most reliable for forested areas and should be supplemented by specialized models for peatland and agricultural ignitions.
Reading between the lines
- Beyond the paper, a clean stress test would split the test set by whether the fire started before or after the prediction time; the current 8-day aggregation labels any overlapping fire as positive, so this split would quantify how much of the 60.3% F1 is forecasting versus detecting an already-visible fire or burn scar.
- Beyond the paper, the open-access input recipe suggests direct transfer to other fire-prone regions such as the pan-Arctic and tropics, with local burned-area composites and local fire-weather indices as the main adaptations.
- Beyond the paper, the land-cover results imply that adding radar (Sentinel-1) or soil-moisture-specific predictors, rather than more optical bands, is the most promising next step for wetland and peatland fire forecasting; the paper names SAR as future work, and its own analysis of weak wetland performance supports this.
Editorial analysis
A structured set of objections, weighed in public.
Referee Report
Summary. The paper introduces CanadaFireSat, a benchmark dataset and set of baseline models for 8-day wildfire forecasting at 100 m resolution over Canada, using multi-modal inputs: Sentinel-2 image time series, MODIS products, ERA5-Land reanalysis, and CEMS fire indices. The authors benchmark a ResNet-50-based CNN and a DINOv2-based ViT in three modality settings (satellite only, environmental only, multi-modal), compare against a knowledge-driven FWI baseline, and additionally construct an adversarially sampled Test Hard set. The central claim is that multi-modal temporal inputs outperform single-modal inputs across all metrics, with a peak test F1 of 60.3% on the 2023 season.
Significance. If the results are sound, the dataset is a valuable community resource: it raises the target resolution from the typical ~0.1 deg to 100 m, covers continental Canada, includes a temporal dimension for the high-resolution optical modality, and provides code and data publicly on GitHub and HuggingFace. The adversarial Test Hard set is a thoughtful contribution to studying the difficult ignition-dominated regime. The paper also honestly discusses limitations related to ignition modeling and wetland fires. However, the headline claims currently rest on a label-construction choice that may let models detect ongoing fires or burn scars rather than forecast new ignitions, and the abstract overstates the multi-modal advantage relative to the paper's own Table 4. These issues are fixable but require re-analysis of the benchmark construction and the reported conclusions.
major comments (3)
- [Section 2.1.1] The label construction appears to allow already-burning fires to be labeled as positive at time t, which creates a leakage path through the Sentinel-2 inputs. The temporal aggregation merges all fires overlapping a grid cell into a single event from first start to last end, and every 8-day MODIS window overlapping that event is labeled positive. Thus, for a fire whose start date s is before t and whose end date is after t, the window [t, t+7] is positive even though no new fire starts in that window. Because the model uses Sentinel-2 images from t-64 to t-1, those inputs may contain the active fire or burn scar, allowing the model to solve the task partly as detection rather than forecasting. The paper does not quantify the fraction of positive labels whose NBAC start date precedes t, does not filter such samples, and the Limitations section does not mention this issue. I request a re-analysis with positives defined by fire start dates inside [t, t+7] (or an explicit treatment of ongoing fires), and a comparison of the headline results with and without such samples.
- [Abstract; Section 4.1, Table 4] The abstract states that multi-modal temporal inputs outperform single-modal inputs 'across all metrics,' but Table 4 contradicts this. For ViT-S, the multi-modal model has lower Val PRAUC (43.9 vs 45.2), lower Val F1 (50.0 vs 50.6), and lower Test Hard PRAUC (25.1 vs 25.7) than the satellite-only model. The later text in Section 4.1 correctly phrases the comparison as 'on average,' but the abstract and the concluding sentence need to be revised so that the claim matches the reported per-split results, or explicit qualification should be added that the multi-modal advantage is an average effect and not uniform across metrics and splits.
- [Section 4.1, Table 4] The multi-modal gains over satellite-only inputs are small (e.g., CNN average PRAUC +1.8 and average F1 +1.3; ViT average PRAUC +1.1 and average F1 +1.7), and all reported results appear to come from a single run per configuration. No standard deviations, repeated seeds, or significance tests are provided. Given that the ViT multi-modal model is worse than satellite-only on several individual metrics, the claimed multi-modal advantage is not robustly established without some measure of run-to-run variability. I request either multiple seeds with error bars or a statistical comparison, or a clearly softened conclusion.
minor comments (5)
- [Title page] There is a typographical error in the affiliation: 'Earth Science Division„' should be 'Earth Science Division'.
- [Section 2.1.2] The word 'distriminative' in 'the main distriminative factor' should be 'discriminative'.
- [Section 2.2.1] The sentence introducing Sentinel-2 processing says 'This represents 13 images' after describing the average revisit time; this appears to refer to the nominal number of images in a 64-day window, but the relationship could be stated more clearly, especially since later filtering allows variable temporal lengths.
- [Table 3] The layout of Table 3 is unclear: the two blocks of rows are not labeled with the modality setting they correspond to, making it hard to see which rows describe 'satellite images only' versus 'satellite and environmental data.'
- [Section 4.1] The weighted F1 definition in the text is introduced in the caption of Figure 9 rather than in the main text; moving this definition into the main text would improve readability.
Circularity Check
No significant circularity: the reported results are held-out empirical evaluations, the FWI baseline is external and controlled by the Test Hard set, and the few self-citations are not load-bearing.
full rationale
This paper does not present a first-principles derivation chain; its central claims are empirical benchmark comparisons. Models are trained on 2016-2021 and evaluated on held-out 2022/2023 sets (Table 4), so the reported F1 and PRAUC values are genuine out-of-sample measurements rather than quantities fitted to the test labels. The FWI baseline is external to the trained models: its threshold is tuned on the validation year and then applied to the test year, and the Test Hard set was explicitly constructed so that FWI is no longer class-discriminative (Eq. 4, Section 2.1.2), which makes the deep-learning-versus-FWI comparison conservative rather than circular. The negative sampling strategy uses FWI as a stratification variable, but this is a dataset-design choice that removes FWI's discriminative power in Test Hard; it does not define the model's predictions in terms of its inputs. The few self-citations (Porta et al. 2025a,b; Sumbul et al. 2025) appear only as illustrative examples in the limitations and future-work discussion and do not carry the load of any result. One validity concern is that the Section 2.1.1 temporal aggregation labels any 8-day window overlapping a merged fire event as positive, so a fire that started before t may be visible in the Sentinel-2 input window [t-64, t-1]; this is potential target leakage that could inflate absolute F1, but it is not a circular derivation because the predictions are not defined in terms of the inputs and the empirical comparisons remain independent of that issue. Overall, no load-bearing step reduces to its own inputs by construction.
Assumptions & free parameters
free parameters (5)
- class weights (w_fire, w_no-fire) =
0.87 / 0.13
- FWI baseline threshold =
6
- number of Sentinel-2 timesteps =
5
- cloud cover exclusion threshold =
40%
- F1 decision threshold =
not stated
assumptions (4)
- domain assumption NBAC burned-area polygons are accurate and complete labels
- domain assumption A positive sample can be an ongoing fire that started before the forecast window
- domain assumption Sentinel-2 L1C top-of-atmosphere reflectance is a usable proxy for surface conditions
- domain assumption ERA5-Land, MODIS, and CEMS products are reliable environmental drivers
Cite this review
Pith. "Pith review of CanadaFireSat: Toward high-resolution wildfire forecasting with multiple modalities." pith.science (2026). https://pith.science/paper/RST3FCZB
@misc{pith2026250608690,
  author       = {Pith},
  title        = {Pith review of: CanadaFireSat: Toward high-resolution wildfire forecasting with multiple modalities},
  year         = {2026},
  howpublished = {\url{https://pith.science/paper/RST3FCZB}},
  note         = {Machine review of arXiv:2506.08690}
}
abstract
Canada experienced in 2023 one of the most severe wildfire seasons in recent history, causing damage across ecosystems, destroying communities, and emitting large quantities of CO2. This extreme wildfire season is symptomatic of a climate-change-induced increase in the length and severity of the fire season that affects the boreal ecosystem. Therefore, it is critical to empower wildfire management in boreal communities with better mitigation solutions. Wildfire probability maps represent an important tool for understanding the likelihood of wildfire occurrence and the potential severity of future wildfires. The massive increase in the availability of Earth observation data has enabled the development of deep learning-based wildfire forecasting models, aiming at providing precise wildfire probability maps at different spatial and temporal scales. A main limitation of such methods is their reliance on coarse-resolution environmental drivers and satellite products, leading to wildfire occurrence prediction of reduced resolution, typically around $\sim 0.1${\deg}. This paper presents a benchmark dataset: CanadaFireSat, and baseline methods for high-resolution: 100 m wildfire forecasting across Canada, leveraging multi-modal data from high-resolution multi-spectral satellite images (Sentinel-2 L1C), mid-resolution satellite products (MODIS), and environmental factors (ERA5 reanalysis data). Our experiments consider two major deep learning architectures. We observe that using multi-modal temporal inputs outperforms single-modal temporal inputs across all metrics, achieving a peak performance of 60.3% in F1 score for the 2023 wildfire season, a season never seen during model training. This demonstrates the potential of multi-modal deep learning models for wildfire forecasting at high-resolution and continental scale.
Figures


Figures from the paper (8 more)


Reference graph
Works this paper leans on
-
[1]
Guillaume Astruc, Nicolas Gonthier, Clement Mallet, and Loic Landrieu. Anysat: Anearthobservationmodelforanyresolutions, scales, andmodal- ities.arXiv preprint arXiv:2412.14123,
-
[3]
Carbon emissions from the 2023 canadian wildfires.Nature, 633(8031):835–839,
35 Brendan Byrne, Junjie Liu, Kevin W Bowman, Madeleine Pascolini- Campbell, Abhishek Chatterjee, Sudhanshu Pandey, Kazuyuki Miyazaki, Guido R van der Werf, Debra Wunch, Paul O Wennberg, et al. Carbon emissions from the 2023 canadian wildfires.Nature, 633(8031):835–839,
work page 2023
-
[8]
Wildfire Forecasting with Satellite Images and Deep Generative Model
Thai-Nam Hoang, Sang Truong, and Chris Schmidt. Wildfire forecast- ing with satellite images and deep generative model.arXiv preprint arXiv:2208.09411,
-
[9]
Fantine Huot, R Lily Hu, Matthias Ihme, Qing Wang, John Burge, Tianjian Lu, Jason Hickey, Yi-Fan Chen, and John Anderson. Deep learning models for predicting wildfires from historical remote-sensing data.arXiv preprint arXiv:2010.07445,
arXiv 2010
-
[10]
Piyush Jain, Quinn E Barber, Stephen W Taylor, Ellen Whitman, Dante Castellanos Acuna, Yan Boulanger, Raphaël D Chavardès, Jack Chen, Peter Englefield, Mike Flannigan, et al. Drivers and impacts of the record- breaking 2023 wildfire season in canada.Nature Communications, 15(1): 6764,
work page 2023
-
[11]
Foundation models for generalist geospatial artificial intelligence.arXiv preprint arXiv:2310.18660,
Johannes Jakubik, Sujit Roy, CE Phillips, Paolo Fraccaro, Denys Godwin, Bianca Zadrozny, Daniela Szwarcman, Carlos Gomes, Gabby Nyirjesy, Blair Edwards, et al. Foundation models for generalist geospatial artificial intelligence.arXiv preprint arXiv:2310.18660,
-
[15]
Multi- scale grouped prototypes for interpretable semantic segmentation
Hugo Porta, Emanuele Dalsasso, Diego Marcos, and Devis Tuia. Multi- scale grouped prototypes for interpretable semantic segmentation. In 2025 IEEE/CVF Winter Conference on Applications of Computer Vision (WACV), pages 2869–2880. IEEE, 2025a. Hugo Porta, Ines Kamoun, and Devis Tuia. Interpretable by-design wildfire forecasting via prototypes. Technical rep...
arXiv 2025
-
[16]
Deep Learning for Global Wildfire Forecasting
Ioannis Prapas, Akanksha Ahuja, Spyros Kondylatos, Ilektra Karasante, Eleanna Panagiotou, Lazaro Alonso, Charalampos Davalas, Dimitrios Michail, Nuno Carvalhais, and Ioannis Papoutsis. Deep learning for global wildfire forecasting.arXiv preprint arXiv:2211.00534,
Show all 22 references
-
[17]
As- sessing the performance of various fire weather indices for wildfire occur- rence in northern switzerland.EGUsphere, 2022:1–23,
Daniel Steinfeld, Adrian Peter, Olivia Martius, and Stefan Brönnimann. As- sessing the performance of various fire weather indices for wildfire occur- rence in northern switzerland.EGUsphere, 2022:1–23,
2022
-
[19]
Global trends of forest loss due to fire from 2001 to 2019.Frontiers in Remote Sensing, 3:825190,
Alexandra Tyukavina, Peter Potapov, Matthew C Hansen, Amy H Pickens, Stephen V Stehman, Svetlana Turubanova, Diana Parker, Viviana Zalles, André Lima, Indrani Kommareddy, et al. Global trends of forest loss due to fire from 2001 to 2019.Frontiers in Remote Sensing, 3:825190,
2001
-
[20]
Unsupervised wildfire change detection based on contrastive learning.arXiv preprint arXiv:2211.14654,
Beichen Zhang, Huiqi Wang, Amani Alabri, Karol Bot, Cole McCall, Dale Hamilton, and Vít Růžička. Unsupervised wildfire change detection based on contrastive learning.arXiv preprint arXiv:2211.14654,
-
[22]
The circle, square, and triangle represent the maximum value for each set
51 0.1 0.2 0.3 0.4 0.5 0.6 0.7 0.8 0.9 Probability Threshold 0.2 0.3 0.4 0.5 0.6F1 Score T est: 2023 T est Hard: 2023 Val: 2022 Figure D.16: Analysis of the F1 score performance as a function of the probability thresh- old across all evaluation sets. The circle, square, and tr...
2023
-
[384]
CNN Training Parameters The CNN models are trained using the combined weighted cross-entropy and dice loss
Appendix B.3. CNN Training Parameters The CNN models are trained using the combined weighted cross-entropy and dice loss. The positive class (fire) weight is0.87and the negative class (no fire) is0.13, found experimentally. Training is run over20epochs with a batch size of24sa...
2023
-
[1989]
Reviews & syntheses: arctic fire regimes and emissions in the 21st century.Biogeosciences Discussions, 2021:1–59,
Jessica L McCarty, Juha Aalto, Ville-Veikko Paunu, Steve R Arnold, Sabine Eckhardt, Zbigniew Klimont, Justin J Fain, Nikolaos Evangeliou, Ari Venäläinen, Nadezhda M Tchebakova, et al. Reviews & syntheses: arctic fire regimes and emissions in the 21st century.Biogeosciences Dis...
2021
-
[2016]
An image is worth 16x16 words: Transformers for image recognition at scale.arXiv preprint arXiv:2010.11929,
Alexey Dosovitskiy. An image is worth 16x16 words: Transformers for image recognition at scale.arXiv preprint arXiv:2010.11929,
2010 arXiv
-
[2018]
Satclip: Global, general-purpose location embeddings with satellite imagery.arXiv preprint arXiv:2311.17179,
Konstantin Klemmer, Esther Rolf, Caleb Robinson, Lester Mackey, and Marc Rußwurm. Satclip: Global, general-purpose location embeddings with satellite imagery.arXiv preprint arXiv:2311.17179,
-
[2019]
Multi-modal prototype learning for interpretable multivariable time series classification.arXiv preprint arXiv:2106.09636,
Gaurav R Ghosal and Reza Abbasi-Asl. Multi-modal prototype learning for interpretable multivariable time series classification.arXiv preprint arXiv:2106.09636,
-
[2020]
Explaining multimodal data fusion: Oc- clusion analysis for wilderness mapping
Burak Ekim and Michael Schmitt. Explaining multimodal data fusion: Oc- clusion analysis for wilderness mapping. InIGARSS 2023-2023 IEEE In- ternational Geoscience and Remote Sensing Symposium, pages 962–965. IEEE,
2023
-
[2021]
Dinov2: Learning robust visual fea- tures without supervision.arXiv preprint arXiv:2304.07193,
Maxime Oquab, Timothée Darcet, Théo Moutakanni, Huy Vo, Marc Szafraniec, Vasil Khalidov, Pierre Fernandez, Daniel Haziza, Francisco Massa, Alaaeldin El-Nouby, et al. Dinov2: Learning robust visual fea- tures without supervision.arXiv preprint arXiv:2304.07193,
-
[2022]
Smar- ties: Spectrum-aware multi-sensor auto-encoder for remote sensing images
Gencer Sumbul, Chang Xu, Emanuele Dalsasso, and Devis Tuia. Smar- ties: Spectrum-aware multi-sensor auto-encoder for remote sensing images. arXiv preprint arXiv:2506.19585,
-
[2023]
Prediction of boreal peatland fires in canada using spatio-temporal methods
Shreya Bali, Sydney Zheng, Akshina Gupta, Yue Wu, Blair Chen, Anirban Chowdhury, and Justin Khim. Prediction of boreal peatland fires in canada using spatio-temporal methods. InClimate Change AI. ICML 2021 Work- shop on Tackling Climate Change with Machine Learning. Climate Ch...
2021
-
[2024]
Human influences on wildfire in alaska from 1988 through 2005: an analysis of the spatial patterns of human impacts.Earth Interactions, 12(1):1–17,
MP Calef, AD McGuire, and FS Chapin III. Human influences on wildfire in alaska from 1988 through 2005: an analysis of the spatial patterns of human impacts.Earth Interactions, 12(1):1–17,
1988
Reviewed August 7, 2026 · model on record in the stance chip above.
Discussion (0). Sign in to comment.