REVIEW 5 major objections 6 minor 12 references
ChartReasoner: Code-Driven Modality Bridging for Long-Chain Reasoning in Chart Question Answering
T0 review · 5 major / 6 minor · reviewed 2026-08-07 · deepseek-v4-flash
Pith's one-line read A 7B model, trained on ECharts code, answers chart questions at GPT-4o level.
desk verdict Promising code-driven chart reasoning pipeline, but the evaluation's split provenance is unverified and the OOD claim is contradicted by the paper's own data construction. read the letter →
The pith
A machine-rendered reading of the paper's core claim, the machinery that carries it, and where it could break.
The reading
What carries the argument
The ECharts code representation is the load-bearing object: it is an executable, structured symbolic form of the chart that preserves both visual layout (titles, axes, colors, legends) and underlying data values, and can be rendered back into the chart. Reasoning happens over this code rather than over raw pixels or lossy image captions. The two-stage pipeline is Chart2Code for image-to-code translation, then code-driven reasoning trace generation to build the ChartThink dataset, then SFT and GRPO training of the final model.
What would settle it
Re-run ChartReasoner's Chart2Code on EvoChart-QA and evaluate whether reasoning accuracy on scatter and line chart questions improves when the chart-to-code reconstruction similarity (as measured by GPT-4V scores) exceeds 5.0 for those types; if accuracy does not improve despite high reconstruction fidelity, the central claim that code-driven reasoning transfers to visual inputs fails.
Extended reading notes
Core claim
The central claim is that code is a lossless bridge between chart pixels and symbolic reasoning. The paper shows that a 7B multimodal model can reach state-of-the-art open-source ChartQA accuracy on four benchmarks and approach GPT-4o in out-of-domain settings, by (1) training a chart-to-code model that converts chart images into structured ECharts code that preserves layout and data semantics, then (2) using that code as the substrate for generating long-chain reasoning traces, and (3) training the final model on those traces with supervised fine-tuning followed by GRPO reinforcement learning.
Load-bearing premise
The method assumes that converting a chart image into ECharts code preserves enough of the chart's content that reasoning over the code transfers to reasoning over the original image, especially for scatter and line charts where the reported reconstruction similarity is low.
Editorial extensions
If this is right
- Open-source 7B chart reasoning can match or surpass far larger generalist models when the training data is code-driven and answer-verified.
- Long-chain reasoning can be transferred from text LLMs to visual domains without relying on the visual encoder to carry the burden of precise extraction.
- GRPO after SFT improves accuracy and reduces over-reasoning, suggesting that rule-based reinforcement learning is an effective last stage for chart reasoning.
- The Chart2Code reconstruction quality predicts downstream reasoning quality, so improving chart-to-code fidelity, especially for scatter and line charts, should directly raise ChartQA performance.
Reading between the lines
- The paper's approach suggests a general recipe for other structured visual domains (diagrams, maps, scientific figures): convert pixels into an executable specification language, then reason over that specification.
- Table 2's low similarity scores for scatter and line charts imply that the ceiling for reasoning on those chart types is set by the code reconstruction step; a dedicated effort to improve reconstruction of dense or multi-series charts could yield outsized gains.
- Because the reasoning LLM used to generate ChartThink traces is DeepSeek-R1, the paper implicitly connects the success of long-chain reasoning in text LLMs to chart QA; if the reasoning generator were weaker, the dataset quality filter might not suffice.
- The finding that charts reconstructed from ECharts code outperform charts from Python-generated code suggests that the fidelity of the symbolic representation, not just the training data size, is what matters for downstream reasoning.
Editorial analysis
A structured set of objections, weighed in public.
Referee Report
Summary. The paper proposes ChartReasoner, a two-stage framework for chart question answering. In stage one, a Chart2Code model is trained on a synthetic dataset of 110K image–ECharts-code pairs to convert chart images into executable ECharts code while preserving layout and data semantics. In stage two, the authors build ChartThink, a dataset of over 140K multi-step reasoning traces, by applying Chart2Code to existing chart QA datasets (ChartQA, EvoChart, ChartBench, PlotQA), prompting an LLM to generate reasoning paths over the code, and retaining only samples where the LLM's predicted answer exactly matches the ground-truth answer. A Qwen2.5-VL-7B model is then fine-tuned on ChartThink with SFT followed by GRPO-based reinforcement learning. The model is evaluated on ChartQA, EvoChart-QA, ChartBench, and ChartQAPro, reporting state-of-the-art results among open-source 7B models and claiming performance approaching GPT-4o in out-of-domain settings.
Significance. If the empirical claims were substantiated, the code-driven modality bridging idea would be a useful contribution: representing charts as executable code provides an interpretable, compositional intermediate format that could support long-chain reasoning. The ChartThink dataset of 140K reasoning traces is also potentially a valuable resource. However, the current evaluation has a serious data-provenance problem: the training data for ChartThink is drawn from the same benchmarks used for evaluation, and the paper never states that evaluation test splits were excluded. This makes the headline performance numbers and the generalization claims impossible to interpret as evidence of true capability. The paper would be strengthened by a transparent split-provenance statement, a re-analysis of the out-of-domain claims, and a more conservative characterization of the chart-to-code fidelity given the low similarity scores reported in Table 2. Because the central contribution is an empirical performance claim, these issues are load-bearing.
major comments (5)
- [Section 3.2 and Section 4.1] Section 3.2 states that ChartThink is constructed by aggregating and cleaning ChartQA, EvoChart, ChartBench, and PlotQA, yielding over 140K examples. Section 4.1 then evaluates ChartReasoner on ChartQA, EvoChart-QA, ChartBench, and ChartQAPro. The paper never states that the evaluation test splits were excluded from ChartThink. Table 3 reinforces this concern: training on ChartQA, EvoChart, or ChartBench gives the best result on the corresponding benchmark, which is exactly the pattern expected if the training data includes the test set. The authors must report the exact provenance of each source dataset's splits used in ChartThink and confirm that there is no overlap with the evaluation sets. Without this, the state-of-the-art and generalization claims in Table 1 are unsubstantiated.
- [Section 4.2] EvoChart-QA is described as an out-of-domain evaluation set, but EvoChart is one of the four source datasets used to construct ChartThink (Section 3.2). This is internally inconsistent. The claim that ChartReasoner 'approaches GPT-4o in out-of-domain settings' is therefore not supported by the EvoChart-QA results; the only truly out-of-domain benchmark in Table 1 appears to be ChartQAPro, which is not part of the ChartThink sources. The generalization claim should be restricted to ChartQAPro, or an additional out-of-domain evaluation from a held-out source should be provided.
- [Section 4.3, Table 2] The paper characterizes Chart2Code as 'high-fidelity' and the code representation as 'lossless,' but the GPT-4V similarity scores in Table 2 are low: 3.77 for scatter, 4.21 for line, and 4.34 overall out of 10. Section 4.3 acknowledges that reconstruction accuracy declines for scatter and line charts and that reconstruction quality directly influences downstream reasoning performance. Because ChartThink reasoning traces are generated over the code produced by Chart2Code, errors in code reconstruction will propagate into the reasoning traces; the exact-match filter only checks whether the LLM's code-based answer matches the ground-truth label, not whether the code faithfully represents the chart. Please provide a more detailed analysis of how code conversion errors affect the validity of the synthesized reasoning traces, or temper the lossless claim.
- [Appendix A] The description of the reinforcement learning stage does not match GRPO as defined by Shao et al. (2024). The appendix says the model generates 8 completions per input with 'reward-weighted selection based on accuracy, format correctness, and length suitability,' which sounds like filtering or weighted sampling, not the group-relative advantage update of GRPO. If a variant of GRPO is used, the exact objective, advantage computation, clipping, and KL penalty should be specified. This is necessary to support the claim in Section 4.2 that GRPO contributes to the observed improvements.
- [Section 4.2] No error bars or repeated-seed variance are reported for any of the benchmark numbers. The differences between ChartReasoner-SFT and ChartReasoner-GRPO are small (e.g., 86.76 vs. 86.93 on ChartQA, 55.10 vs. 55.20 on ChartBench), so without confidence intervals the claim that GRPO 'consistently outperforms' SFT is not statistically supported. I would like to see at least standard deviations across multiple runs or a statement about the significance of these differences.
minor comments (6)
- [Section 3.2, Eq. (3)] In Eq. (3), the reasoning generator is conditioned on Prompt(Chart2Code(x_k), q_k), but it is not explicitly stated that the chart image itself is not shown to the LLM; please clarify that the reasoning is generated over the code representation, not the visual chart.
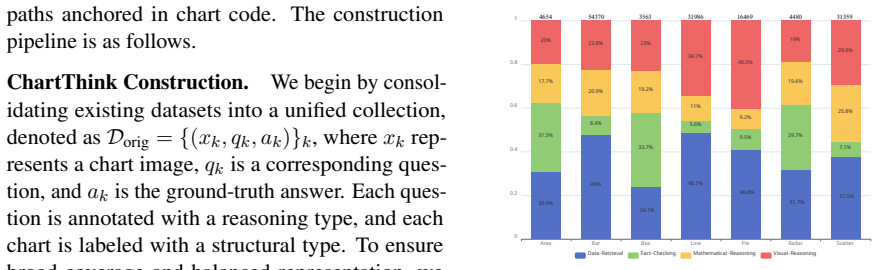
- [Figure 3] The stacked bars in Figure 3 are difficult to interpret because the legend and the numerical counts are not clearly mapped to the chart types; consider adding explicit labels or a table.
- [Table 1] The table uses '–' with inconsistent meanings (not all entries are available for all benchmarks), and it would be helpful to state whether missing baseline numbers are from the original papers or re-evaluated in this work.
- [Appendix A] The images are resized to 512×512 pixels, which may be low for charts containing dense labels or small text; please justify this resolution choice and discuss its potential impact on chart-to-code and reasoning performance.
- [Section 4.1] The paper does not mention whether the ChartThink and Chart2Code datasets or the trained models will be released; a statement about release would improve reproducibility and the utility of the proposed resource.
- [Abstract] The phrase 'lossless as possible' is internally hedged, but the main text uses the stronger term 'lossless' (e.g., in Section 3); please align the terminology with the actual measured fidelity.
Circularity Check
Benchmark overlap between ChartThink construction and evaluation makes the SOTA and out-of-domain claims unverified.
-
fitted input called prediction
[Section 3.2 (ChartThink Construction and Collection) vs. Section 4.1/4.2 (Experimental Setup and Main Results)]
"To evaluate the performance of our proposed ChartReasoner on ChartQA, we conducted experiments on four representative benchmarks: ChartQA (Masry et al., 2022), EvoChart-QA (Huang et al., 2025a), ChartQAPro (Masry et al., 2025a), and ChartBench (Xu et al., 2023). [...] We construct the ChartThink dataset by aggregating and cleaning a wide range of existing ChartQA datasets, including ChartQA (Masry et al., 2022), EvoChart (Huang et al., 2025a), ChartBench (Xu et al., 2023), and PlotQA (Methani et al., 2020)."
Three of the four evaluation benchmarks are also explicit sources for the ChartThink training data. The construction pipeline retains samples only when the LLM's predicted answer exactly matches the ground-truth answer, so the answer labels of those benchmarks are directly used as training targets. The paper never states that the official evaluation/test splits of ChartQA, EvoChart-QA, or ChartBench were excluded from ChartThink. As written, the Table 1 numbers on those benchmarks are therefore not independent predictions but in-distribution fits to the same benchmarks, and Table 3 even shows that per-benchmark training data yields the best score on the corresponding benchmark. The claimed state-of-the-art result is consequently not supported as a generalization result.
-
self definitional
[Section 4.2, first paragraph]
"Among them, ChartQA and ChartBench are in-domain datasets, while ChartQAPro and EvoChart-QA serve as out-of-domain evaluations to test generalization performance."
This sentence defines EvoChart-QA as out-of-domain, but Section 3.2 lists EvoChart as one of the datasets from which ChartThink is aggregated. Thus the 'out-of-domain' label is asserted rather than derived from the actual training/evaluation split. The paper's conclusion that ChartReasoner 'approaches the performance of proprietary systems like GPT-4o in out-of-domain settings' relies on EvoChart-QA, yet by the paper's own construction EvoChart-QA is in-distribution. The only evaluation benchmark outside the ChartThink source list is ChartQAPro, so the out-of-domain generalization claim is definitionally unsupported.
full rationale
The Chart2Code and ChartThink synthesis pipeline itself is not circular: Chart2Code is trained on independently generated synthetic ECharts image-code pairs, and the ChartThink reasoning traces are produced by an LLM over code and filtered by exact answer matching. The circularity is at the benchmark level. The paper builds ChartThink from ChartQA, EvoChart, ChartBench, and PlotQA, then evaluates on ChartQA, EvoChart-QA, ChartBench, and ChartQAPro. No sentence in the paper states that the official test splits of these source benchmarks were removed before training. Table 3 confirms the mechanism: training on data from a given benchmark maximizes that benchmark's score. Therefore the headline improvements on three of the four benchmarks are plausibly explained by in-distribution training rather than by the code bridge. The separate 'out-of-domain' claim is self-definitional because EvoChart-QA is explicitly one of the source datasets. Chart2Code's fidelity evaluation on EvoChart-QA is more independent, since Chart2Code was trained on synthetic data rather than EvoChart images, which is why the overall circularity is partial rather than total. The central empirical claims remain unsubstantiated until split provenance is reported.
Assumptions & free parameters
assumptions (4)
- domain assumption ECharts code is a lossless, executable representation of chart data semantics and layout, such that reasoning over code preserves all information needed for ChartQA.
- ad hoc to paper Exact match between the LLM-predicted answer over code and the ground-truth answer is a sufficient filter for reasoning trace quality.
- domain assumption GPT-4V visual similarity scores are a valid proxy for chart-to-code reconstruction fidelity.
- domain assumption DeepSeek-R1 generated reasoning chains over code are valid chains of reasoning that can be distilled into a visual model.
Cite this review
Pith. "Pith review of ChartReasoner: Code-Driven Modality Bridging for Long-Chain Reasoning in Chart Question Answering." pith.science (2026). https://pith.science/paper/JSARBNPP
@misc{pith2026250610116,
  author       = {Pith},
  title        = {Pith review of: ChartReasoner: Code-Driven Modality Bridging for Long-Chain Reasoning in Chart Question Answering},
  year         = {2026},
  howpublished = {\url{https://pith.science/paper/JSARBNPP}},
  note         = {Machine review of arXiv:2506.10116}
}
read the original abstract
Recently, large language models have shown remarkable reasoning capabilities through long-chain reasoning before responding. However, how to extend this capability to visual reasoning tasks remains an open challenge. Existing multimodal reasoning approaches transfer such visual reasoning task into textual reasoning task via several image-to-text conversions, which often lose critical structural and semantic information embedded in visualizations, especially for tasks like chart question answering that require a large amount of visual details. To bridge this gap, we propose ChartReasoner, a code-driven novel two-stage framework designed to enable precise, interpretable reasoning over charts. We first train a high-fidelity model to convert diverse chart images into structured ECharts codes, preserving both layout and data semantics as lossless as possible. Then, we design a general chart reasoning data synthesis pipeline, which leverages this pretrained transport model to automatically and scalably generate chart reasoning trajectories and utilizes a code validator to filter out low-quality samples. Finally, we train the final multimodal model using a combination of supervised fine-tuning and reinforcement learning on our synthesized chart reasoning dataset and experimental results on four public benchmarks clearly demonstrate the effectiveness of our proposed ChartReasoner. It can preserve the original details of the charts as much as possible and perform comparably with state-of-the-art open-source models while using fewer parameters, approaching the performance of proprietary systems like GPT-4o in out-of-domain settings.
Figures


Figures from the paper (12 more)


Reference graph
Works this paper leans on
-
[1]
Replace the chart data with a different but coherent dataset
-
[2]
The data distribution and trends should be as complex as possible a nd not too monotonous
-
[3]
Change the topic or theme accordingly
-
[4]
In Proceedings of the ACL, pages 12756–12770
Matcha: Enhancing visual language pretrain- ing with math reasoning and chart derendering. In Proceedings of the ACL, pages 12756–12770. Haotian Liu, Chunyuan Li, Yuheng Li, and Yong Jae Lee. 2024. Improved baselines with visual instruc- tion tuning. InProceedings of the CVPR, pages 26286–26296. Ilya Loshchilov and Frank Hutter. 2019. Decoupled weight dec...
arXiv 2024
-
[5]
Keep the original chart type
-
[6]
You can use your imagination to change the style and color at wil l
-
[7]
Return only the full HTML code—no explanations or comments. Figure 1: QA generation prompt for multi-hop questions in te mplate-prompted strategy. 1 Figure 11: ECharts Code Generation Prompt. <html lang="en"> <head> <meta charset="UTF-8"> <title>Climate Anomalies Heatmap</title> <style> #main { width: 100%; max-width: 1200px; height: 700px; margin: 20px a...
work page 2023
-
[9]
Add the main title and subtitle related to the new topic and let yo ur imagination run wild
Show all 12 references
-
[2020]
InProceedings of the WACV, pages 3501–3510
Leaf-qa: Locate, encode & attend for figure question answering. InProceedings of the WACV, pages 3501–3510. Liang Chen, Lei Li, Haozhe Zhao, Yifan Song, and Vinci. 2025. R1-v: Reinforcing super generaliza- tion ability in vision-language models with less than $3. https://githu...
2025 arXiv
-
[2023]
InProceedings of the ICCV, pages 22145– 22156
Chartreader: A unified framework for chart derendering and comprehension without heuristic rules. InProceedings of the ICCV, pages 22145– 22156. Huilin Deng, Ding Zou, Rui Ma, Hongchen Luo, Yang Cao, and Yu Kang. 2025. Boosting the general- ization and reasoning of vision lang...
2025 arXiv
-
[2024]
Daya Guo, Dejian Yang, Haowei Zhang, Junxiao Song, Ruoyu Zhang, Runxin Xu, Qihao Zhu, Shirong Ma, Peiyi Wang, Xiao Bi, and 1 others
Internlm-xcomposer2: Mastering free-form text-image composition and comprehension in vision- language large model.Preprint, arXiv:2401.16420. Daya Guo, Dejian Yang, Haowei Zhang, Junxiao Song, Ruoyu Zhang, Runxin Xu, Qihao Zhu, Shirong Ma, Peiyi Wang, Xiao Bi, and 1 others. 20...
2025 arXiv
-
[2025]
aha moment
Plot2code: A comprehensive benchmark for evaluating multi-modal large language models in code generation from scientific plots. InFindings of the NACCL, pages 3006–3028. Renqiu Xia, Bo Zhang, Hancheng Ye, Xiangchao Yan, Qi Liu, Hongbin Zhou, Zijun Chen, Peng Ye, Min Dou, Botia...
2024 arXiv
Reviewed August 7, 2026 · model on record in the stance chip above.
Discussion (0). Sign in to comment.