REVIEW 3 major objections 6 minor 1 cited by
Temporal evolution of quasi-periodic oscillations in an accreting black hole Swift J1727.8-1613: coevolution of the disk-corona during the state transition
T0 review · 3 major / 6 minor · reviewed 2026-08-06 · deepseek-v4-flash
Pith's one-line read This paper reports the first clear negative correlation between the unscattered disk luminosity and the low-frequency quasi-periodic oscillation (QPO) frequency in the black hole X-ray binary Swift J1727.8-1613, and shows the correlation…
desk verdict The two-branch ν–L_us-disk correlation is a plausible new result, but the break statistics are overclaimed and the opposite Compton trend is model-dependent. read the letter →
The pith
A machine-rendered reading of the paper's core claim, the machinery that carries it, and where it could break.
The reading
What carries the argument
The load-bearing object is the covering fraction c_f, the fraction of thin-disk seed photons that are Comptonized by the inner hot flow in the thcomp convolution model; the unscattered disk luminosity is (1 - c_f) L_disk and the Compton luminosity is L_thcomp - (1 - c_f) L_disk. The paper shows that ν versus c_f has the same two-branch shape with a breakpoint at 2.92 ± 0.03 Hz, which is what ties the luminosity correlations to a geometric quantity. The interpretive engine is the Lense-Thirring precession of the hot flow, where the QPO frequency is set by the outer radius R_o of the precessing flow; the paper reads the sign flip near 3 Hz as the point where the geometry changes from inward truncation of the disk to contraction of the hot flow.
What would settle it
A model comparison that fits a single power law or smooth curve to the full ν–L_us-disk data and finds it statistically preferred over the piecewise fit, or a permutation test over breakpoint choices that fails to exceed the reported significances, would falsify the claimed two-branch structure.
Extended reading notes
Core claim
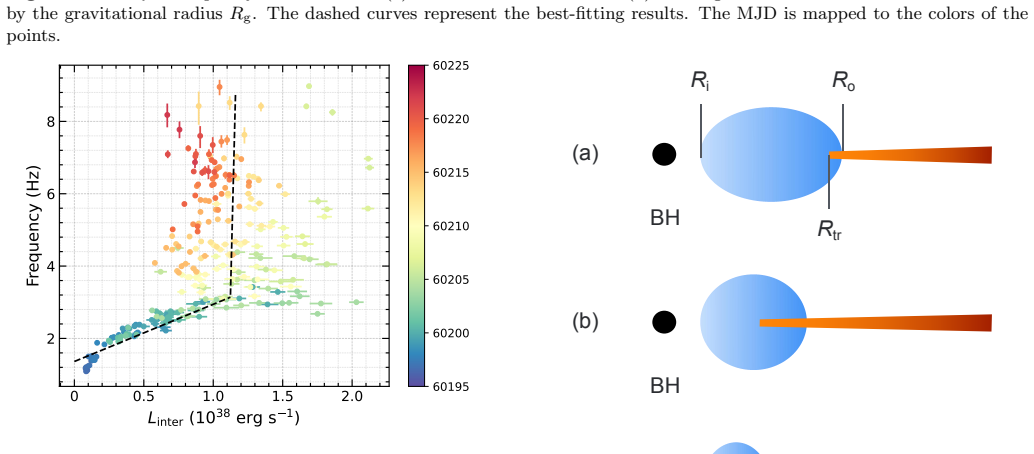
On the paper's own terms, the central discovery is a two-branch correlation between the QPO centroid frequency ν and the unscattered disk luminosity L_us-disk = (1 - c_f) L_disk, defined so that only disk photons that escape without Compton scattering are counted. For ν below 3.03 ± 0.03 Hz the relation is negative (Spearman r_S = -0.794, 4.4σ); above that frequency it is positive (r_S = 0.910, 8.7σ). The Compton luminosity L_Comp shows the mirror-image pattern, positive below 2.97 ± 0.09 Hz and negative above, with the same ~3 Hz break. The intrinsic disk luminosity is essentially flat below ~1.7 Hz and then rises nearly linearly with ν (exponent 0.967 ± 0.023). The paper ties these to a coevolution of the thin disk and the inner hot flow within the Lense-Thirring precession picture: at low frequencies the hot flow's outer radius shrinks as the disk truncation radius moves inward, raising the covering fraction and suppressing the unscattered disk emission; at high frequencies the truncation radius stays roughly constant and the hot flow contracts under enhanced cooling, so disk luminosity rises with frequency while the Compton luminosity decouples.
Load-bearing premise
The two-branch structure is treated as real based on a piecewise linear fit with a free breakpoint near 3 Hz; the paper does not test whether a single monotonic or smoothly curved relation describes the same data equally well.
Editorial extensions
If this is right
- Below about 3 Hz, the QPO frequency tracks the Compton luminosity positively and the unscattered disk luminosity negatively, so the QPO frequency cannot be used as a simple monotonic tracer of disk accretion rate in this source.
- Above about 3 Hz, the near-linear ν ∝ L_disk^0.967 scaling provides a quantitative coupling between disk photon flux and QPO frequency, consistent with the hot flow contracting under enhanced Compton cooling.
- The shared breakpoint near 3 Hz across ν–L_us-disk, ν–L_Comp, and ν–c_f suggests the covering fraction is the physical variable that controls the correlation signs, giving a timing-based probe of disk-corona geometry changes during state transitions.
- The energy-dependence of the fractional rms — flat above 15 keV, rising below, with a slope that steepens as the spectrum softens — implies that the high-energy hot flow emission is relatively stable while the low-energy variability is governed by the softer disk component.
Reading between the lines
- If the ~3 Hz breakpoint is a generic feature rather than specific to Swift J1727.8-1613, some of the scatter in previously reported QPO-disk correlations across sources could reflect sources sampled on only one side of the break.
- A re-analysis that compares the piecewise linear fit against a single power law or smooth curve, or that locates the breakpoint by cross-validation rather than by eye, would test whether the two branches are discrete states or a continuous rollover.
- X-ray polarimetry of the same source during a future outburst could test the geometric interpretation directly: the Lense-Thirring picture predicts that the polarization angle and its phase-resolved modulation should change as the source crosses the ~3 Hz transition.
Editorial analysis
A structured set of objections, weighed in public.
Referee Report
Summary. The paper presents a timing and spectral analysis of the black hole X-ray binary Swift J1727.8-1613 using Insight-HXMT observations from the 2023 outburst. The authors report a two-branch correlation between the low-frequency QPO centroid frequency and the unscattered disk luminosity, with a transition near 3 Hz: negative at lower frequencies and positive at higher frequencies. They also report an opposite two-branch trend for the Compton luminosity, which is positive at lower frequencies and negative at higher ones. These correlations are interpreted as evidence for coevolution of the inner hot flow and the thin disk within a Lense-Thirring precession framework. In addition, the paper analyzes the energy dependence of the QPO fractional rms during the flare state, finding a roughly constant rms above 15 keV and a rising rms with energy below that threshold.
Significance. If the two-branch ν-L_us-disk correlation is real, it is a novel observational constraint that challenges the single positive correlation seen in other BHXRBs and provides a potential test for geometric QPO models. The paper makes good use of public data and includes an alternative spectral model (diskbb+xillver) as a robustness check, which is commendable. The rms-energy analysis is a useful addition. However, the statistical evidence for the two-branch structure is not currently convincing, and the opposite trend for the Compton luminosity is not reproduced by the alternative model. These issues must be addressed before the central claims can be accepted as established.
major comments (3)
- [§4.1, Eq. (1)] The existence of the two-branch correlation is not statistically demonstrated. The breakpoint ν_tr is a free parameter fitted to the same data used to define the two subsets, and the reported Spearman significances are computed after the split, conditional on the fitted breakpoint. The manuscript never compares Eq. (1) against a single linear or smoothly varying relation, so the apparent sign change could reflect overfitting of a monotonic curve or noise. Please provide a formal model comparison (e.g., an F-test or information criterion) between the piecewise model and a single-relation model, and quantify the uncertainty in the breakpoint and in the slope change. In addition, the data in Fig. 1 are a time series with strong autocorrelation; the effective number of independent epochs is much smaller than the total number of points, so the reported significances (4.4σ, 8.7σ) are likely overestimated. Please account for time-series autocorrelation or justify the independence of the epochs.
- [§4.1, Eq. (3) and Appendix B, Eq. (B2)] The claimed opposite trend for the Compton luminosity is not robust to the choice of spectral model. With the alternative diskbb+xillver model, Eq. (B2) gives a positive slope (1.10±0.13) for the high-frequency branch, whereas the primary model gives a negative slope (-7.48±1.46) in Eq. (3). The abstract and conclusion state that ν-L_Comp is positive at lower frequencies and negative at higher ones, but the alternative model does not reproduce this sign change; the Appendix text saying the correlations 'generally align' is inconsistent with the reversed sign of the high-frequency slope. Please address this discrepancy directly, either by explaining why the sign is model-dependent or by removing the opposite-trend claim from the abstract and conclusion.
- [§4.2, Fig. 3(a) and Section 4.2] The geometric interpretation in terms of coevolution of the inner hot flow and thin disk rests on the two-branch correlations. Since the statistical case for the break is incomplete (see the first comment), the scenario in Fig. 5 should be presented as a qualitative suggestion rather than a firm conclusion. In particular, the statement that at high QPO frequencies 'the disk truncation radius remains approximately constant' is based on visual inspection and is not quantified; please provide a quantitative analysis or explicitly label this as an observational impression without a formal correlation claim.
minor comments (6)
- [§4.2] There are typos in this section: 'two-banch' should be 'two-branch' and 'simlar' should be 'similar'.
- [§4.1] The notation is inconsistent: the text uses 'L_us-disk' and 'L_Comp' while equations use subscripts; please unify the notation throughout the manuscript.
- [§4.1, Eq. (1)] Equation (1) is written with L as a function of ν, but Eqs. (2)-(4) are written with ν as a function of L; please clarify which variable is treated as independent in the fits and why this choice was made.
- [§3.1] The free parameters in the spectral fit are not fully specified: the text states the photon index and electron temperature in relxillCp were tied to thcomp, and later lists Tin, cf, log ξ, and the normalization of relxillCp as free; please provide a complete list of all free parameters and their allowed ranges.
- [§4.3] The analysis of the energy dependence of the fractional rms is based on only three selected observations; while the trend is plausible, the small sample size and the selection of specific peaks and dips should be acknowledged as a limitation.
- [Figures 2 and 11] The two-branch fits are shown as dashed curves, but the location of the fitted breakpoint is not marked; adding a vertical line at the fitted ν_tr would help the reader evaluate the two branches visually.
Circularity Check
No significant circularity: the two-branch ν–luminosity correlations are empirical and cross-checked with an alternate spectral model; the only self-citation (He et al. 2025) supplies spectral fits but does not by itself force the central claim.
full rationale
The paper's central correlation is between QPO centroid frequencies measured by timing analysis and luminosities derived from independent spectral fits. The QPO frequency is not an input to either spectral model, and the luminosities are not fitted to the QPO frequency. The unscattered disk luminosity is defined as L_us-disk = (1-c_f)L_disk, so the interpretation that the covering fraction 'plays a key role' is partly a restatement of that construction, but the paper does not use the definition to derive the QPO frequency; it reports an empirical two-branch relation. The self-citation to He et al. (2025) provides the spectral fitting parameters, which is load-bearing for the luminosity values, but the paper independently repeats the analysis with an alternate spectral model (diskbb+xillver) in Appendix B and finds the same two-branch shapes, so the central correlation is not forced by the self-citation chain. The free-breakpoint piecewise fit and post-split Spearman significances are a model-selection and autocorrelation concern, not a circular reduction: no equation in the paper is equivalent by construction to its own input. Overall circularity is therefore low, with a minor score adjustment for the close coupling between the c_f-based luminosity decomposition and the interpretive narrative.
Assumptions & free parameters
free parameters (1)
- breakpoint frequency ν_tr =
3.03 ± 0.03 Hz (ν-L_us-disk); 2.97 ± 0.09 Hz (ν-L_Comp)
assumptions (4)
- domain assumption The spectral decomposition into disk, Compton, and reflection components using constant*tbabs*(thcomp⊗diskbb+relxillCp) with tied photon index and kTe is physically meaningful.
- domain assumption The distance to the source is 3.7 kpc (Mata Sánchez et al. 2025); luminosities scale as distance squared.
- domain assumption The QPO frequency measured in the LE band (2-10 keV) is representative; QPO frequencies are nearly identical across bands.
- domain assumption Fixed spectral parameters (N_H, inclination 40°, iron abundance 1.0, reflection fraction -1) are correct.
Cite this review
Pith. "Pith review of Temporal evolution of quasi-periodic oscillations in an accreting black hole Swift J1727.8-1613: coevolution of the disk-corona during the state transition." pith.science (2026). https://pith.science/paper/SWJCMSRK
@misc{pith2026250621131,
  author       = {Pith},
  title        = {Pith review of: Temporal evolution of quasi-periodic oscillations in an accreting black hole Swift J1727.8-1613: coevolution of the disk-corona during the state transition},
  year         = {2026},
  howpublished = {\url{https://pith.science/paper/SWJCMSRK}},
  note         = {Machine review of arXiv:2506.21131}
}
read the original abstract
Low-frequency quasi-periodic oscillations (QPOs) are commonly observed in black hole X-ray binaries, and their frequency has been found to correlate with various spectral properties. In this work, we present a detailed timing analysis of Swift J1727.8-1613, revealing a novel two-branch correlation between the QPO frequency and the observed disk emission, which differs from previous findings of a single correlation. Specifically, at QPO frequencies below 3 Hz, the QPO frequency is negatively correlated with the observed disk emission. This negative relation transitions to a positive one, as the QPO frequency exceeds approximately 3 Hz. The correlation between QPO frequency and Compton flux exhibits an opposite trend, with a positive correlation at lower frequencies and a negative correlation at higher ones. We interpret these behaviors as signatures of an evolving disk-corona geometry, within the framework of a Lense-Thirring precessing hot flow. Additionally, we find that during the flare state, the QPO fractional root-mean-square (rms) remains nearly constant above 15 keV, but increases with energy below this threshold. The slope of the rms-energy relation increases as the energy spectrum softens.
Figures


Figures from the paper (7 more)


Forward citations
Cited by 1 Pith paper
-
Energy-dependent Optical/Near-infrared and X-ray Correlations in Swift J1727.8-1613
For Swift J1727.8–1613, the optical–X-ray correlation flips sign with X-ray energy, and the QPO lag is flat (~60–80 ms) from 2 to 150 keV.
Reference graph
Works this paper leans on
-
[1]
Arnaud, K. A. 1996, in Astronomical Society of the Pacific Conference Series, Vol. 101, Astronomical Data Analysis Software and Systems V, ed. G. H. Jacoby & J. Barnes, 17
1996
-
[2]
2022, MNRAS, 515, 2099, doi: 10.1093/mnras/stac1922
Bellavita, C., Garc ´ ıa, F., M´ endez, M., & Karpouzas, K. 2022, MNRAS, 515, 2099, doi: 10.1093/mnras/stac1922
-
[3]
2002, ApJ, 572, 392, doi: 10.1086/340290
Belloni, T., Psaltis, D., & van der Klis, M. 2002, ApJ, 572, 392, doi: 10.1086/340290
doi:10.1086/340290 2002
-
[4]
Belloni, T. M., & Motta, S. E. 2016, in Astrophysics and Space Science Library, Vol. 440, Astrophysics of Black Holes: From Fundamental Aspects to Latest Developments, ed. C. Bambi, 61, doi: 10.1007/978-3-662-52859-4 2
- [5]
-
[6]
2025, MNRAS, 540, 1394, doi: 10.1093/mnras/staf750
Bollemeijer, N., Uttley, P., & You, B. 2025, MNRAS, 540, 1394, doi: 10.1093/mnras/staf750
-
[7]
Bu, Q. C., Zhang, S. N., Santangelo, A., et al. 2021, ApJ, 919, 92, doi: 10.3847/1538-4357/ac11f5
- [8]
Show all 69 references
- [9]
-
[10]
Agrawal, V. K. 2022, ApJ, 933, 69, doi: 10.3847/1538-4357/ac7154
2022 doi
-
[11]
Connors, R. M. T., Garc ´ ıa, J. A., Tomsick, J., et al. 2021, ApJ, 909, 146, doi: 10.3847/1538-4357/abdd2c
2021 doi
- [12]
-
[13]
J., et al
Dauser, T., Garc ´ ıa, J., Walton, D. J., et al. 2016, A&A, 590, A76, doi: 10.1051/0004-6361/201628135 De Marco, B., Zdziarski, A. A., Ponti, G., et al. 2021, A&A, 654, A14, doi: 10.1051/0004-6361/202140567
2016 doi
-
[14]
A., Kallman, T
Ding, Y., Garcıa, J. A., Kallman, T. R., et al. 2024, ApJ, 974, 280, doi: 10.3847/1538-4357/ad76a1
2024 doi
-
[15]
2007, A&A Rv, 15, 1, doi: 10.1007/s00159-007-0006-1
Done, C., Gierli´ nski, M., & Kubota, A. 2007, A&A Rv, 15, 1, doi: 10.1007/s00159-007-0006-1
2007 doi
-
[16]
A., Miller, J
Draghis, P. A., Miller, J. M., Homan, J., et al. 2023, The Astronomer’s Telegram, 16219, 1
2023
-
[17]
A., McClintock, J
Esin, A. A., McClintock, J. E., & Narayan, R. 1997, ApJ, 489, 865, doi: 10.1086/304829
1997 doi
-
[18]
2023, MNRAS, 520, 5544, doi: 10.1093/mnras/stad434 Garc ´ ıa, J., Dauser, T., Lohfink, A., et al
Gao, C., Yan, Z., & Yu, W. 2023, MNRAS, 520, 5544, doi: 10.1093/mnras/stad434 Garc ´ ıa, J., Dauser, T., Lohfink, A., et al. 2014, ApJ, 782, 76, doi: 10.1088/0004-637X/782/2/76
2023 doi
-
[19]
2025, Daily fluctuations propagate damply through a black hole accretion disk
He, H., Long, Y., You, B., et al. 2025, Daily fluctuations propagate damply through a black hole accretion disk. https://arxiv.org/abs/2508.01384
2025 arXiv
-
[20]
2001, ApJS, 132, 377, doi: 10.1086/318954
Homan, J., Wijnands, R., van der Klis, M., et al. 2001, ApJS, 132, 377, doi: 10.1086/318954
2001 doi
-
[21]
Ingram, A., Done, C., & Fragile, P. C. 2009, MNRAS, 397, L101, doi: 10.1111/j.1745-3933.2009.00693.x
2009
-
[22]
2024, ApJ, 968, 76, doi: 10.3847/1538-4357/ad3faf
Ingram, A., Bollemeijer, N., Veledina, A., et al. 2024, ApJ, 968, 76, doi: 10.3847/1538-4357/ad3faf
2024 doi
-
[23]
R., & Motta, S
Ingram, A. R., & Motta, S. E. 2019, NewAR, 85, 101524, doi: 10.1016/j.newar.2020.101524
2019
-
[24]
Kalemci, E., Kara, E., & Tomsick, J. A. 2022, in Handbook of X-ray and Gamma-ray Astrophysics, ed. C. Bambi & A. Sangangelo, 9, doi: 10.1007/978-981-16-4544-0 100-1
2022 doi
-
[25]
F., Fabian, A
Kara, E., Steiner, J. F., Fabian, A. C., et al. 2019, Nature, 565, 198, doi: 10.1038/s41586-018-0803-x
2019 doi
-
[26]
M., et al
Karpouzas, K., M´ endez, M., Ribeiro, E. M., et al. 2020, MNRAS, 492, 1399, doi: 10.1093/mnras/stz3502
2020 doi
-
[27]
1998, Publications of the Astronomical Society of Japan, 50, 667, doi: 10.1093/pasj/50.6.667
Kubota, A., Tanaka, Y., Makishima, K., et al. 1998, Publications of the Astronomical Society of Japan, 50, 667, doi: 10.1093/pasj/50.6.667
1998 doi
-
[28]
2021, Research in Astronomy and Astrophysics, 21, 070, doi: 10.1088/1674-4527/21/3/70
Liu, H.-X., Huang, Y., Xiao, G.-C., et al. 2021, Research in Astronomy and Astrophysics, 21, 070, doi: 10.1088/1674-4527/21/3/70
2021 doi
-
[29]
Lyubarskii, Y. E. 1997, MNRAS, 292, 679, doi: 10.1093/mnras/292.3.679
1997 doi
-
[30]
2023, MNRAS, 525, 854, doi: 10.1093/mnras/stad2284
Ma, R., M´ endez, M., Garc ´ ıa, F., et al. 2023, MNRAS, 525, 854, doi: 10.1093/mnras/stad2284
2023 doi
-
[31]
2021, Nature Astronomy, 5, 94, doi: 10.1038/s41550-020-1192-2
Ma, X., Tao, L., Zhang, S.-N., et al. 2021, Nature Astronomy, 5, 94, doi: 10.1038/s41550-020-1192-2
2021 doi
-
[32]
B., Swank, J
Markwardt, C. B., Swank, J. H., & Taam, R. E. 1999, ApJL, 513, L37, doi: 10.1086/311899 Mata S´ anchez, D., Torres, M. A. P., Casares, J., et al. 2025, A&A, 693, A129, doi: 10.1051/0004-6361/202451960
1999 doi
- [33]
-
[34]
J., Eikenberry, S
Mikles, V. J., Eikenberry, S. S., & Rothstein, D. M. 2006, ApJ, 637, 978, doi: 10.1086/498494
2006 doi
-
[35]
1984, PASJ, 36, 741
Mitsuda, K., Inoue, H., Koyama, K., et al. 1984, PASJ, 36, 741
1984
-
[36]
1991, ApJ, 383, 784, doi: 10.1086/170837
Ebisawa, K. 1991, ApJ, 383, 784, doi: 10.1086/170837
1991 doi
-
[37]
2011, MNRAS, 418, 2292, doi: 10.1111/j.1365-2966.2011.19566.x
Homan, J. 2011, MNRAS, 418, 2292, doi: 10.1111/j.1365-2966.2011.19566.x
2011
-
[38]
E., Casella, P., Henze, M., et al
Motta, S. E., Casella, P., Henze, M., et al. 2015, MNRAS, 447, 2059, doi: 10.1093/mnras/stu2579 17
2015 doi
-
[39]
P., Morgan, E
Muno, M. P., Morgan, E. H., & Remillard, R. A. 1999, ApJ, 527, 321, doi: 10.1086/308063
1999 doi
-
[40]
P., Remillard, R
Muno, M. P., Remillard, R. A., Morgan, E. H., et al. 2001, ApJ, 556, 515, doi: 10.1086/321604
2001 doi
-
[41]
2023, The Astronomer’s Telegram, 16205, 1
Negoro, H., Serino, M., Nakajima, M., et al. 2023, The Astronomer’s Telegram, 16205, 1
2023
-
[42]
B., & Ingargiola, A
Newville, M., Stensitzki, T., Allen, D. B., & Ingargiola, A. 2014, LMFIT: Non-Linear Least-Square Minimization and Curve-Fitting for Python, 0.8.0, Zenodo, doi: 10.5281/zenodo.11813 O’Connor, B., Hare, J., Younes, G., et al. 2023, The Astronomer’s Telegram, 16207, 1
2014 doi
-
[43]
2024, ApJL, 960, L17, doi: 10.3847/2041-8213/ad17ca
Peng, J.-Q., Zhang, S., Shui, Q.-C., et al. 2024, ApJL, 960, L17, doi: 10.3847/2041-8213/ad17ca
2024 doi
-
[44]
N., & Li, T
Rao, F., Belloni, T., Stella, L., Zhang, S. N., & Li, T. 2010, ApJ, 714, 1065, doi: 10.1088/0004-637X/714/2/1065
2010 doi
-
[45]
A., & McClintock, J
Remillard, R. A., & McClintock, J. E. 2006, ARA&A, 44, 49, doi: 10.1146/annurev.astro.44.051905.092532
2006 arXiv
-
[46]
McClintock, J. E. 2002a, ApJ, 564, 962, doi: 10.1086/324276 —. 2002b, ApJ, 564, 962, doi: 10.1086/324276
-
[47]
1995, ApJ, 445, 780, doi: 10.1086/175740
Shimura, T., & Takahara, F. 1995, ApJ, 445, 780, doi: 10.1086/175740
1995 doi
-
[48]
C., Yin, H
Shui, Q. C., Yin, H. X., Zhang, S., et al. 2021, MNRAS, 508, 287, doi: 10.1093/mnras/stab2521
2021 doi
-
[49]
2024, ApJ, 973, 59, doi: 10.3847/1538-4357/ad676a
Shui, Q.-C., Zhang, S., Peng, J.-Q., et al. 2024, ApJ, 973, 59, doi: 10.3847/1538-4357/ad676a
2024 doi
-
[50]
J., McClintock, J
Sobczak, G. J., McClintock, J. E., Remillard, R. A., et al. 2000, ApJ, 531, 537, doi: 10.1086/308463
2000 doi
-
[51]
A., & ˙Zycki, P
Sobolewska, M. A., & ˙Zycki, P. T. 2006, MNRAS, 370, 405, doi: 10.1111/j.1365-2966.2006.10489.x van den Eijnden, J., Ingram, A., Uttley, P., et al. 2017, MNRAS, 464, 2643, doi: 10.1093/mnras/stw2634
2006
-
[52]
2023, ApJL, 958, L16, doi: 10.3847/2041-8213/ad0781
Veledina, A., Muleri, F., Dovˇ ciak, M., et al. 2023, ApJL, 958, L16, doi: 10.3847/2041-8213/ad0781
2023 doi
-
[53]
2024, ApJ, 969, 152, doi: 10.3847/1538-4357/ad58d1
Wang, X.-L., Yan, Z., Xie, F.-G., Wang, J.-F., & Ma, R.-Y. 2024, ApJ, 969, 152, doi: 10.3847/1538-4357/ad58d1
2024 doi
-
[54]
D., & Bellm, E
Wang, Y. D., & Bellm, E. C. 2023, The Astronomer’s Telegram, 16209, 1
2023
-
[55]
1999, ApJL, 526, L33, doi: 10.1086/312365
Wijnands, R., Homan, J., & van der Klis, M. 1999, ApJL, 526, L33, doi: 10.1086/312365
1999 doi
-
[56]
2009, MNRAS, 397, 666, doi: 10.1111/j.1365-2966.2009.15008.x
Wilkinson, T., & Uttley, P. 2009, MNRAS, 397, 666, doi: 10.1111/j.1365-2966.2009.15008.x
2009
-
[57]
You, B., Bursa, M., & ˙Zycki, P. T. 2018, ApJ, 858, 82, doi: 10.3847/1538-4357/aabd33
2018 doi
-
[58]
T., Ingram, A., Bursa, M., & Wang, W
You, B., ˙Zycki, P. T., Ingram, A., Bursa, M., & Wang, W. 2020, ApJ, 897, 27, doi: 10.3847/1538-4357/ab9838
2020 doi
-
[59]
2021, Nature Communications, 12, 1025, doi: 10.1038/s41467-021-21169-5
You, B., Tuo, Y., Li, C., et al. 2021, Nature Communications, 12, 1025, doi: 10.1038/s41467-021-21169-5
2021 doi
-
[60]
2023, Science, 381, 961, doi: 10.1126/science.abo4504
You, B., Cao, X., Yan, Z., et al. 2023, Science, 381, 961, doi: 10.1126/science.abo4504
2023 doi
-
[61]
2024, MNRAS, 529, 4624, doi: 10.1093/mnras/stae835
Yu, W., Bu, Q.-C., Zhang, S.-N., et al. 2024, MNRAS, 529, 4624, doi: 10.1093/mnras/stae835
2024 doi
-
[62]
A., & Gierli´ nski, M
Zdziarski, A. A., & Gierli´ nski, M. 2004, Progress of Theoretical Physics Supplement, 155, 99, doi: 10.1143/PTPS.155.99
2004 doi
-
[63]
2025, arXiv e-prints, arXiv:2506.00623, doi: 10.48550/arXiv.2506.00623
Lancova, D. 2025, arXiv e-prints, arXiv:2506.00623, doi: 10.48550/arXiv.2506.00623
2025 doi
-
[64]
A., Szanecki, M., Poutanen, J., Gierli´ nski, M., & Biernacki, P
Zdziarski, A. A., Szanecki, M., Poutanen, J., Gierli´ nski, M., & Biernacki, P. 2020, MNRAS, 492, 5234, doi: 10.1093/mnras/staa159
2020 doi
-
[65]
2025, ApJ, 985, 258, doi: 10.3847/1538-4357/adcf1d
Zhan, Y., You, B., Ingram, A., Jiang, W., & Wang, F. 2025, ApJ, 985, 258, doi: 10.3847/1538-4357/adcf1d
2025 doi
-
[66]
2023a, MNRAS, 526, 3944, doi: 10.1093/mnras/stad3062
Zhang, L., M´ endez, M., Garc ´ ıa, F., et al. 2023a, MNRAS, 526, 3944, doi: 10.1093/mnras/stad3062
-
[67]
2022, MNRAS, 512, 2686, doi: 10.1093/mnras/stac690 —
Zhang, Y., M´ endez, M., Garc ´ ıa, F., et al. 2022, MNRAS, 512, 2686, doi: 10.1093/mnras/stac690 —. 2023b, MNRAS, 520, 5144, doi: 10.1093/mnras/stad460
2022 doi
-
[68]
2024, ApJL, 961, L42, doi: 10.3847/2041-8213/ad1e6c
Zhao, Q.-C., Tao, L., Li, H.-C., et al. 2024, ApJL, 961, L42, doi: 10.3847/2041-8213/ad1e6c
2024 doi
-
[69]
2024, ApJ, 968, 106, doi: 10.3847/1538-4357/ad4ce4
Zhu, H., & Wang, W. 2024, ApJ, 968, 106, doi: 10.3847/1538-4357/ad4ce4
2024 doi
Reviewed August 6, 2026 · model on record in the stance chip above.
Discussion (0). Continue with ORCID to comment.