REVIEW 3 major objections 5 minor 10 references
Graph Neural Networks in Wind Power Forecasting
T0 review · 3 major / 5 minor · reviewed 2026-08-06 · deepseek-v4-flash
Pith's one-line read This paper shows that message-passing graph neural networks match a strong convolutional baseline in 24–36 hour wind power forecasting, with mean absolute errors within 0.08 percentage points on three wind farms.
desk verdict A thin but honest empirical note: GNNs match CNNs on wind farm forecasting in five tests, but the input-map mismatch and missing error bars mean the architecture claim is not yet established. read the letter →
The pith
A machine-rendered reading of the paper's core claim, the machinery that carries it, and where it could break.
The reading
What carries the argument
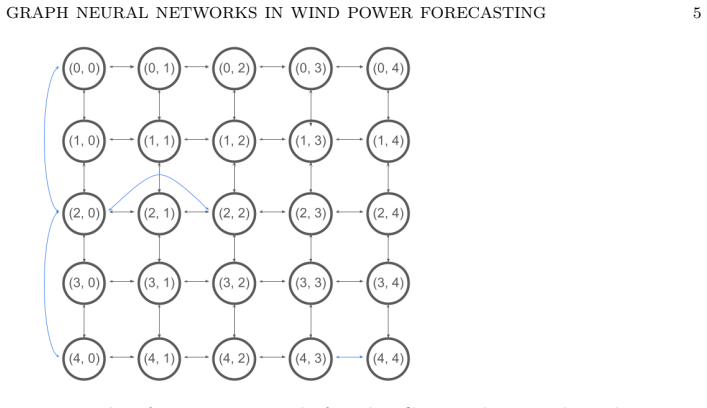
The carrying object is a custom message-passing GNN layer. Each directed edge between two grid nodes computes a message vector from the source node features, target node features, and edge features via a two-layer MLP with SiLU activations; each node sums incoming messages and updates its representation through another two-layer MLP. The input graph is a 20 by 20 grid of wind components at 100 meters, with edges to row and column neighbors plus edges skipping a fixed distance, and each edge carries the row offset, column offset, and Euclidean distance between endpoints. The final layer compresses each node to one feature and a dense regressor sums them into a power prediction. This design does the work of letting the network learn spatial weather interactions without relying on convolutional translational invariance, on a map one quarter the area of the CNN's input.
What would settle it
Retrain the best GNN and the CNN on the same data 10 or more times with different random seeds and compare the distributions of MAE; if the within-model spread reaches or exceeds the Table 1 gaps of 0.02–0.08 percentage points, the claimed parity could be reproduced by noise alone.
Extended reading notes
Core claim
The central claim, stated in the paper's conclusions, is that GNNs can be as accurate as CNNs for short- and medium-term wind energy production forecasting. The evidence is a table of mean absolute errors on three anonymized wind farms in Romania: for test years 2021, 2022, and 2023, the GNN's MAE is 8.10 versus 8.16, 8.23 versus 8.15, 11.49 versus 11.55, 12.12 versus 12.14, and 10.83 versus 10.90; the largest gap is 0.08 and the sign alternates between models. The authors describe the CNN as a strong, previously optimized baseline and the GNN hyperparameters as tuned on a separate validation farm. Because the direction of the advantage changes from farm to farm, the paper concludes the two architectures perform quite similarly.
Load-bearing premise
The conclusion rests on assuming the 0.02-to-0.08 percentage-point MAE differences in Table 1 are outside run-to-run or seed-to-seed noise, since the paper reports no variance, confidence intervals, or significance tests and each farm's two partitions share most of their training years.
Editorial extensions
If this is right
- Wind forecasters can treat graph networks as a drop-in alternative to CNNs for 24–36 hour ahead production forecasts, with no expected loss in mean absolute error.
- Because comparable accuracy was reached with a 20 by 20 GNN input versus a 40 by 40 CNN input, graph architectures may need less spatial context, cutting input size and per-epoch compute by roughly a factor of four.
- The mixed, small sign of the MAE gap across farms suggests the comparison is not dominated by a particular site, so the parity result is not an artifact of one geography.
- The paper's own outlook is that the approach can still be refined, so the announced parity is a floor rather than a ceiling for graph-network performance.
Reading between the lines
- If the parity holds under repeated retraining, the natural next comparison is whether a GNN using the same 40 by 40 input as the CNN, or a multi-farm graph with farm nodes, widens or narrows the gap; the paper leaves these runs unstated.
- A proper significance test would likely decide the matter: because the reported gaps are one or two orders of magnitude smaller than the MAE itself, seed-to-seed variation could easily straddle zero.
- The edge-feature design, direction plus distance, makes the model non-translation-invariant in a controlled way; this could be adapted to other gridded renewable forecasting tasks, for example solar irradiance, where the relevant spatial relations are also local but not translation-invariant.
- One practical extension would be to report ensemble spread instead of the average of two runs; that would give operators a forecast uncertainty estimate for free, something the current evaluation does not provide.
Signed reviews
Editorial analysis
A structured set of objections, weighed in public.
Referee Report
Summary. The paper reports a comparison between a message-passing Graph Neural Network (GNN) and a Convolutional Neural Network (CNN) baseline for wind power forecasting. The models are trained on NWP wind components and evaluated on three wind farms in Romania over five train/test scenarios (Table 1), with a forecasting horizon of 24 to 36 hours. The GNN uses a 20×20 map at 1° resolution, while the CNN uses a 40×40 map at 2° resolution. Hyperparameters for the GNN were selected on a separate validation wind farm. The central claim, stated in Section 5, is that GNNs can be as accurate as CNNs for this task, supported by MAE differences of 0.02 to 0.08 percentage points in either direction.
Significance. If rigorously established, the claim would be of practical value: GNNs are a more flexible modeling framework than CNNs for weather-related forecasting, and demonstrating parity with a strong CNN baseline on real operational data is a meaningful result. The paper's strengths include evaluation on held-out test years, hyperparameter selection on a separate validation farm, and averaging of two runs to reduce variance. However, the evidence as presented does not support the architectural conclusion: the comparison is confounded by different input map sizes, and no uncertainty quantification is provided for the small MAE gaps. The paper is more of a short technical report than a fully controlled study, and the central claim needs additional experimental support.
major comments (3)
- [§3.2 and Table 1] The comparison does not isolate the architecture: the GNN is fed a 1°×1° (20×20) NWP map, while the CNN is fed a 2°×2° (40×40) map, as stated in Section 3.2. Table 1 therefore compares two systems that differ in both the architecture and the input spatial footprint/resolution. The observed MAE parity could be a consequence of the different input fields rather than of the GNN versus CNN architecture. To support the conclusion in Section 5 that 'GNNs can be as accurate as CNNs,' a matched-input experiment (same map size and resolution for both models) or an ablation that varies input size within each architecture is required. Without such a control, the claim is not established.
- [§2 and Table 1] The reported MAE differences (0.02 to 0.08 percentage points) are presented without any measure of uncertainty. The paper states that predictions are the average of two identical runs, but it does not report the variance between runs, nor does it provide confidence intervals or significance tests. Moreover, the two train/test partitions for each farm share most of the training years, so the effective number of independent comparisons is small. The conclusion of 'comparable accuracy' rests on the implicit assumption that the observed gaps are larger than run-to-run or seed-to-seed noise; this assumption is not tested. At minimum, the authors should report per-run MAEs, standard deviations, or confidence intervals, and ideally repeat training with multiple seeds and apply a paired significance test.
- [§2 and §4] The CNN baseline is not described. The paper refers to 'our best CNN baseline' and says its hyperparameters were 'pre-established based on previous research,' but it gives no architectural details, training procedure, or reference to a prior publication where the baseline is specified. Because the central claim is explicitly a parity claim against this CNN, the reader cannot assess whether the baseline is actually strong or reproduce the comparison. A description of the CNN architecture and training configuration, or a citation to a public source, is necessary.
minor comments (5)
- [§4.2] The graph construction uses a fixed skip distance x, but no value for x is reported in Section 4.2, and x is not listed among the explored hyperparameters in Section 4.4. Please state the selected value or clarify how x was chosen, so the architecture is reproducible.
- [§4.3] The paper states that the number of GNN layers can range between 2 and 10, and Section 4.4 lists the number of layers as a hyperparameter, but the final architecture's specific hyperparameter values (number of layers, latent dimensions, L1 rate, dropout, learning rate schedule, and edge skip distance) are not given. A table with the chosen configuration would improve reproducibility.
- [§4.2] The sentence 'It is important to note that if eij = eji, the model would treat messages sent in both directions identically (see 2)' should reference the aggregation equation as 'Equation (2)' and could benefit from a brief explanation of why this would limit expressive capacity in this setting.
- [Abstract and §3.1] The abstract and Section 3.1 state the test horizon is 24 to 36 hours, but it is not explained how the models produce predictions at this horizon (e.g., direct multi-step output, autoregressive generation, or separate models per lead time). Clarifying this would aid interpretation of the MAE values.
- [§5] The conclusion 'We have shown that GNNs can be as accurate as CNNs' is stronger than what the current evidence supports; the wording should be conditional on the limitations identified above.
Circularity Check
No circularity: the GNN-vs-CNN comparison is an empirical evaluation on held-out test years with hyperparameters tuned on a separate validation wind farm.
full rationale
The paper makes no claimed derivation or first-principles prediction that could reduce to its inputs. Its central claim is that GNNs match CNN accuracy, supported by Table 1, which reports MAE on fifth-year test data from three wind farms. Reported MAE values come from held-out test years, and GNN hyperparameters were selected using a validation wind farm different from those in Table 1 (Section 4.4). The CNN baseline is fixed from earlier research and is not fitted to the test data. No parameter fitted to the target quantity is renamed as a prediction, no self-citation is load-bearing, and no uniqueness theorem or ansatz is imported to force the conclusion. The differing input-map sizes (1°×1° for GNN versus 2°×2° for CNN, Section 3.2) is a possible methodological confound for isolating architecture, but a confound is a validity threat, not a circularity: the comparison is not defined in terms of its own outcome. Under the requirement that circularity be exhibited as a specific reduction, no circular step is present.
Assumptions & free parameters
free parameters (3)
- GNN hyperparameters (number of layers, latent dimensions, L1 rate, dropout, learning schedule) =
Not specified
- Edge skip distance x =
Not specified
- CNN baseline hyperparameters =
Pre-established, not reported
assumptions (4)
- domain assumption NWP wind components u and v at 100 m are sufficient predictors of aggregate wind farm power
- domain assumption Grid row/column edges with skip connections capture the spatial dependencies needed for forecasting
- domain assumption ECMWF HRES forecasts are accurate enough at 0.1 degree for the task
- domain assumption The two train-test partitions per farm provide independent evidence
Cite this review
Pith. "Pith review of Graph Neural Networks in Wind Power Forecasting." pith.science (2026). https://pith.science/paper/RN3CCFW7
@misc{pith2026250700105,
  author       = {Pith},
  title        = {Pith review of: Graph Neural Networks in Wind Power Forecasting},
  year         = {2026},
  howpublished = {\url{https://pith.science/paper/RN3CCFW7}},
  note         = {Machine review of arXiv:2507.00105}
}
read the original abstract
We study the applicability of GNNs to the problem of wind energy forecasting. We find that certain architectures achieve performance comparable to our best CNN-based benchmark. The study is conducted on three wind power facilities using five years of historical data. Numerical Weather Prediction (NWP) variables were used as predictors, and models were evaluated on a 24 to 36 hour ahead test horizon.
Figures

Reference graph
Works this paper leans on
-
[1]
Wang, Y., Zou, R., Liu, F., Zhang, L., & Liu, Q. (2021). A review of wind speed and wind power forecasting with deep neural networks. Applied Energy, 304, 117766
work page 2021
-
[2]
Liu, H., & Zhang, Z. (2024). Development and trending of deep learning methods for wind power predictions. Artificial Intelligence Review, 57(5), 112
work page 2024
-
[3]
R. Lam et al. ,Learning skillful medium-range global weather forecasting.Science382,1416- 1421(2023).DOI:10.1126/science.adi2336
-
[4]
Sanchez-Gonzalez, A., Godwin, J., Pfaff, T., Ying, R., Leskovec, J., & Battaglia, P. W. (2020). Learning to Simulate Complex Physics with Graph Networks. *Proceedings of the 37th International Conference on Machine Learning (ICML)*, 103, 8469-8479
work page 2020
-
[5]
Daenens, S., Verstraeten, T., Daems, P. J., Nowé, A., & Helsen, J. (2024). Spatio-Temporal Graph Neural Networks for Power Prediction in Offshore Wind Farms Using SCADA Data. Wind Energy Science Discussions, 2024, 1-19
work page 2024
-
[6]
& Liu, T
Ke, G., Meng, Q., Finley, T., Wang, T., Chen, W., Ma, W., ... & Liu, T. Y. (2017). Lightgbm: A highly efficient gradient boosting decision tree. Advances in neural information processing systems, 30
2017
-
[7]
Hechtlinger, Y., Chakravarti, P., & Qin, J. (2017). A generalization of convolutional neural networks to graph-structured data. arXiv preprint arXiv:1704.08165
work page Pith review arXiv 2017
-
[8]
Kipf, T. N., & Welling, M. (2016). Semi-supervised classification with graph convolutional networks. arXiv preprint arXiv:1609.02907
arXiv 2016
Show all 10 references
-
[9]
Brody, S., Alon, U., & Yahav, E. (2021). How attentive are graph attention networks?. arXiv preprint arXiv:2105.14491
2021 arXiv
-
[10]
Veličković, P., Cucurull, G., Casanova, A., Romero, A., Lio, P., & Bengio, Y. (2017). Graph attention networks. arXiv preprint arXiv:1710.10903. Ra venwits Email address: javier.castellano@ravenwits.com Ra venwits & Departamento de Análisis Matemático, F acultad de Matemáticas...
2017 arXiv
Reviewed August 6, 2026 · model on record in the stance chip above.
Discussion (0). Continue with ORCID to comment.