REVIEW 3 major objections 6 minor 67 references
Helveg: Diagrams for Software Documentation
T0 review · 3 major / 6 minor · reviewed 2026-08-06 · deepseek-v4-flash
Pith's one-line read An interactive diagram can give developers a high-level view of an unfamiliar C# codebase that a typical API reference cannot.
desk verdict A genuinely useful design and evaluation of an interactive diagram tool for API docs, held back by a same-participant evaluation that cannot yet support the comparative claim. read the letter →
The pith
A machine-rendered reading of the paper's core claim, the machinery that carries it, and where it could break.
The reading
What carries the argument
The load-bearing mechanism is the glyph-node: a circular node that fuses entity kind, static/instance status, member-count ratio, accessibility, abstract/sealed modifiers, collapse state, and compiler diagnostics into a single recognizable visual mark. Glyph-nodes are the unit the reader must parse, so their redesign is what moves the second study's satisfaction and readability scores; without them, the diagram degenerates into an unreadable hairball and the paper's claim loses its evidence base. Supporting machinery includes the declares, inheritsFrom, typeOf, and dependsOn edge relations; the filter builder that replaces JavaScript search; and the TidyTree-then-ForceAtlas2 layout pipeline that arranges the graph after each expansion.
What would settle it
A controlled study with fresh developers who have never used Helveg, comparing time and accuracy on orientation tasks (identifying project purposes, key dependencies, and refactoring candidates) against a conventional API reference for the same unfamiliar codebase, would settle whether Helveg truly provides insight a typical API reference cannot; a null or negative result would refute the paper's central claim.
Extended reading notes
Core claim
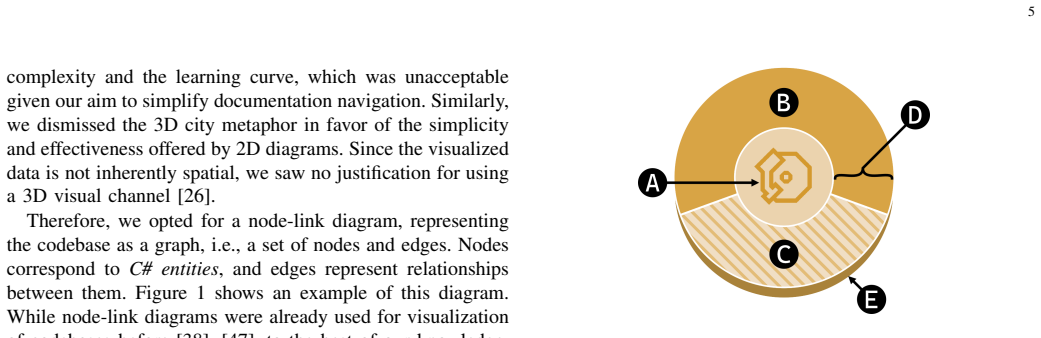
On the paper's own terms, the discovery is that a codebase's documentation can be organised around a single interactive diagram instead of a tree of text pages, and that this diagram can be made legible by encoding C# semantics directly into compound circular glyphs. Each glyph's icon marks the entity or type kind, a filled versus stroked icon marks static versus instance, a surrounding donut shows the static-to-instance member ratio and total member count, corner locks mark accessibility, hexagon and octagon contours mark abstract and sealed, fire and smoke mark compiler errors and warnings, and shadows mark collapsed expandable nodes. Edges separately render declaration containment, type inheritance, member types, and project dependencies, each with its own color and toggleable visibility. The user studies are offered as evidence that, after the redesign, testers recognised 93.33% of the icons on average, answered 95% of glyph-reading questions correctly, and rated the tool as a considerable improvement, supporting the conclusion that Helveg offers insight into a codebase that would be hard to achieve with a typical API reference.
Load-bearing premise
The evaluation's positive results assume that the five developers, who had critiqued the earlier version and were interviewed by someone involved in the sample project, rated the redesign on its merits rather than out of a wish to confirm their earlier complaints or please the interviewer.
Editorial extensions
If this is right
- A newcomer to an unfamiliar C# codebase can start from a diagram that shows the whole solution and drill down to a single method, getting both orientation and details without reading a sequence of documentation pages.
- Because filtering no longer requires writing JavaScript, a wider range of developers can isolate relevant nodes, so the documentation's usefulness no longer depends on scripting comfort.
- Compiler errors and warnings become part of the documentation itself, surfacing code health alongside structure in a way a conventional API reference does not offer.
- The diagram can be generated automatically and embedded in a website, making it a practical drop-in for or supplement to a web-hosted API reference rather than a manual drawing task.
- If the redesigned glyphs are as readable as the second study suggests, the same encoding template could be reused for other object-oriented languages with comparable type systems.
Reading between the lines
- Editorial extension: the strongest test of the paper's conclusion would be a controlled comparison in which fresh participants, not the five who criticised the first version, solve identical orientation tasks with Helveg versus a conventional API reference while measuring time and correctness; the current studies do not contain that direct comparison.
- Editorial extension: the finding that programmers preferred a structured filter builder over writing JavaScript is a general design lesson: even expert developers may reject flexible scripting interfaces in tools they use for browsing, favouring simpler query construction.
- Editorial extension: because the second study used the same five developers and an interviewer familiar with the sample project, the positive ratings should be treated as a signal to investigate rather than a settled measure of usability; a replication with strangers would raise confidence.
- Editorial extension: if layout performance were improved, for example through GPU-accelerated rendering, the same diagram-first documentation model could scale to solutions with hundreds of projects, where the current prototype slows and the readability gains would be most valuable.
Signed reviews
Editorial analysis
A structured set of objections, weighed in public.
Referee Report
Summary. Helveg is an automatically generated interactive node-link diagram intended to complement or replace API reference documentation for C# codebases. The paper motivates the design with requirements R1-R7, then describes the glyph vocabulary (entity-kind icons, static/instance donut charts, accessibility corner icons, abstract/sealed contours, compiler-diagnostic animations), edge relations, filtering mechanisms (full-text, regex, JavaScript, and a filter builder), interaction and layout, and the user interface including a tree view, tutorial, and cheat sheet. It reports a first qualitative study from the prior VISSOFT version, a second user study with the same five professional developers after a redesign, and two glyph-recognition tests. The paper claims the redesign improved readability, intuitiveness, and interactivity, and concludes that Helveg is functional and can provide insight into a codebase that would be hard to achieve with a typical API reference.
Significance. The main contribution is a concrete, open-source prototype with a thoughtful design space exploration and unusually honest reporting of qualitative feedback. The paper also contributes useful lessons: tutorial/cheat-sheet features are essential for configurable tools, filter builders can replace programming-based filters, and custom icons inspired by existing iconography can outperform copied icons. The objective icon-recognition data, although confounded, provides a useful signal. If the comparative insight claim were established, Helveg would be a useful onboarding aid for unfamiliar C# codebases. However, the evidence as presented is exploratory: five participants, no control condition, the same participants in both studies, and no direct comparison against an API reference on equivalent tasks. The conclusion therefore goes beyond what the current evaluation can support, despite the authors' commendable acknowledgment of several threats in Section VI.C.
major comments (3)
- [Section VI.B and Fig. 5] The paper's central claim that the redesign improved usability and that Helveg enables codebase insight not achievable with a typical API reference rests on the second user study, which used the same five participants who had previously criticized the tool and an interviewer who is one of KAFE's developers and a co-creator of that project. Because the second study was explicitly intended to validate fixes to the participants' own complaints, the Likert gains and supportive quotes in Fig. 5 are vulnerable to demand characteristics and confirmation bias. Section VI.C acknowledges the lack of a direct API-reference comparison and the small sample, but the conclusion in Section VIII still states the comparative claim as established. Please either soften the conclusion to describe exploratory evidence, or add an independent evaluation, such as a between-subjects or within-subjects comparison with a conventional API reference on equivalent comprehension tasks.
- [Section VI.B, glyph tests] The improvement from 68.52% to 93.33% in icon recognition is not a clean measure of the new icon set, because the two tests differed in participants, icons, and task context: the first tested recall of Visual Studio icons that participants had seen for years, while the second tested recognition of Helveg's new icons immediately after a session in which participants had used those icons. The authors themselves note this difference in Section VI.C, yet the text still states that 'this result shows a great improvement in the glyphs' readability.' Please present this as a descriptive, non-comparative result, or conduct a matched test with a pre-exposure baseline.
- [Section VII.A and Section VIII] The discussion claims that Helveg 'can be used to gain knowledge about a codebase that a typical API reference can hardly provide,' supported by examples such as the oversized ProjectService node and the visualization of compiler diagnostics. These are plausible illustrations of what the diagram can show, but they are anecdotal observations from five participants, with no task-based or controlled comparison against a conventional API reference. The claims about relative difficulty ('only with great difficulty,' 'would be hard to achieve') are therefore not empirically established. Please reframe these statements as design rationale or hypotheses, or provide comparative task data.
minor comments (6)
- [Section V.A] The phrase 'color perception deficiencies' should be 'color vision deficiencies' for consistency with standard terminology.
- [Section VI.A] The sentence 'The testing sessions took between 58 to 96 minutes' should read 'between 58 and 96 minutes.'
- [Section VI.A] The sentence 'They have 7-12 years of professional C# experience at a software company' is vague; please specify whether this is the same software company for all participants.
- [Section VI.B] The phrase 'one tester (E3) decided to give it a lower score' has an ambiguous antecedent for 'it'; consider 'gave readability a lower score.'
- [Section V.D] The description of the JavaScript mode says 'the JavaScript (JS) mode allowing the user to write custom search logic with a JS filter'; 'with a JS filter' is redundant and could be simplified to 'with custom JavaScript logic.'
- [Section VIII] The phrase 'Through repeated evaluation with professional software developers' could be read as implying independent samples; consider 'Through two rounds of evaluation with the same group of professional software developers' to be more precise.
Circularity Check
The redesign evaluation is partly self-confirming: the same five developers whose complaints drove the changes rate the new version, and the interviewer co-develops the sample project; no derivation-level circularity beyond this.
-
other
[Section VI, opening paragraph; cf. Section I, Section VI.B, Figure 5]
"For this extended and improved version of Helveg, we prepared and conducted another user study with the same developers as the first one (labeled as E1–E5) to ascertain that our changes addressed their original feedback."
The redesign's content was derived from those same developers' 'original feedback' (Section I: 'addressing the major shortcomings identified by the participants'), and the outcome is those same developers' Likert ratings and praise for the new version (Section VI.B, Figure 5). The interviewer was also one of KAFE's developers, so the session was not blind to the tool's authors. Positive ratings therefore partly measure whether the five participants recognized their own requested changes, not whether the changes improved usability for developers generally. This is a user-study analogue of fitting to a dataset and then scoring on the same dataset: the 'improvement' claim is self-confirming rather than independently tested.
full rationale
The paper contains no fitted equations or derivation chain, so the classic circularity patterns (definitional equivalence, renaming a known result, uniqueness imported from the authors, ansatz smuggled in via citation) do not apply. The one structural circularity is in the evaluation design. Section VI states that the second user study reused the same five developers 'to ascertain that our changes addressed their original feedback,' while Section I explains that the changes were made precisely to address the shortcomings those participants identified. The treatment (new glyphs, filter builder, tutorial, tree view) and the outcome (those participants' Likert scores and qualitative praise in Figure 5 and Section VI.B) thus come from the same individuals, and the interviewer's role as a KAFE developer aligns the session with the tool's authors. This makes the reported usability improvement partly a confirmation of the participants' own earlier complaints rather than an independent test. The paper honestly acknowledges related limitations in Section VI.C, including the small participant pool, the absence of a direct comparison with a traditional API reference, and the non-comparable icon-survey conditions, which mitigates the overclaim but does not remove the same-participant issue. Because the first study's task observations (e.g., identifying the oversized ProjectService node) provide independent evidence that the diagram can convey codebase insight, the central claim does not entirely reduce to the circular evaluation. Score 4 reflects this partial, evaluation-level circularity rather than a derivation-level one.
Assumptions & free parameters
assumptions (3)
- domain assumption C# is a representative object-oriented language for assessing a documentation approach intended for general OOP codebases.
- domain assumption The five volunteer developers' qualitative feedback is representative of the broader developer population.
- domain assumption Insights such as identifying the oversized ProjectService class would be difficult to obtain from a traditional API reference.
Cite this review
Pith. "Pith review of Helveg: Diagrams for Software Documentation." pith.science (2026). https://pith.science/paper/6665QVBX
@misc{pith2026250710244,
  author       = {Pith},
  title        = {Pith review of: Helveg: Diagrams for Software Documentation},
  year         = {2026},
  howpublished = {\url{https://pith.science/paper/6665QVBX}},
  note         = {Machine review of arXiv:2507.10244}
}
read the original abstract
Software developers often have to gain an understanding of a codebase. Be it programmers getting onboarded onto a team project or, for example, developers striving to grasp an external open-source library. In either case, they frequently turn to the project's documentation. However, documentation in its traditional textual form is ill-suited for this kind of high-level exploratory analysis, since it is immutable from the readers' perspective and thus forces them to follow a predefined path. We have designed an approach bringing aspects of software architecture visualization to API reference documentation. It utilizes a highly interactive node-link diagram with expressive node glyphs and flexible filtering capabilities, providing a high-level overview of the codebase as well as details on demand. To test our design, we have implemented a prototype named Helveg, capable of automatically generating diagrams of C\# codebases. User testing of Helveg confirmed its potential, but it also revealed problems with the readability, intuitiveness, and user experience of our tool. Therefore, in this paper, which is an extended version of our VISSOFT paper with DOI 10.1109/VISSOFT64034.2024.00012, we address many of these problems through major changes to the glyph design, means of interaction, and user interface of the tool. To assess the improvements, this new version of Helveg was evaluated again with the same group of participants as the previous version.
Figures


Figures from the paper (2 more)


Reference graph
Works this paper leans on
-
[1]
Stack Overflow Developer Survey,
Stack Overflow, “Stack Overflow Developer Survey,” 2024. [Online]. Available: https://survey.stackoverflow.co/2024/
work page 2024
-
[2]
B. Dagenais and M. P. Robillard, “Creating and Evolving Developer Documentation: Understanding the Decisions of Open Source Contrib- utors,” in Proc. of the 18th ACM SIGSOFT int. symp. on Foundations of software engineering, ser. FSE ’10. ACM, Nov. 2010, pp. 127–136. doi:10.1145/1882291.1882312
-
[3]
GitHub, “Open Source Survey,” 2017. [Online]. Available: https: //opensourcesurvey.org/2017/
work page 2017
-
[4]
Tech Writing - The State of Developer Ecosystem in 2022 Infographic
“Tech Writing - The State of Developer Ecosystem in 2022 Infographic.” [Online]. Available: https://www.jetbrains.com/lp/devecosystem-2022
work page 2022
-
[5]
An Exploratory Study of Documentation Strategies for Product Features in Pop- ular GitHub Projects,
T. Puhlf ¨urß, L. Montgomery, and W. Maalej, “An Exploratory Study of Documentation Strategies for Product Features in Pop- ular GitHub Projects,” in 2022 IEEE Int. Conf. on Software Maintenance and Evolution (ICSME) , Oct. 2022, pp. 379–383. doi:10.1109/ICSME55016.2022.00043
arXiv 2022
-
[6]
D. v. Heesch. (1997, Oct.) Doxygen. [Online]. Available: https: //github.com/doxygen/doxygen
work page 1997
-
[7]
Georg Brandl, “sphinx-doc/sphinx,” Mar. 2008. [Online]. Available: https://github.com/sphinx-doc/sphinx
work page 2008
-
[8]
NET Foundation. (2015) Docfx. [Online]. Available: https://github. com/dotnet/docfx
work page 2015
Show all 67 references
-
[9]
How developers use API documentation: an observation study,
M. Meng, S. Steinhardt, and A. Schubert, “How developers use API documentation: an observation study,” Commun. Des. Q. Rev , vol. 7, no. 2, pp. 40–49, Aug. 2019. doi:10.1145/3358931.3358937
2019
-
[10]
Let’s Go to the Whiteboard: How and Why Software Developers Use Drawings,
M. Cherubini, G. Venolia, R. DeLine, and A. J. Ko, “Let’s Go to the Whiteboard: How and Why Software Developers Use Drawings,” in Proc. of the SIGCHI Conf. on Human Factors in Computing Systems . ACM, Apr. 2007, pp. 557–566. doi:10.1145/1240624.1240714
2007
-
[11]
Software Architecture Documentation for Developers: A Survey,
D. Rost, M. Naab, C. Lima, and C. von Flach Garcia Chavez, “Software Architecture Documentation for Developers: A Survey,” in Software Architecture, K. Drira, Ed. Springer, 2013, pp. 72–88. doi:10.1007/978- 3-642-39031-9 7
2013 doi
-
[12]
(1991, Sep.) Graphviz
The Graphviz Authors. (1991, Sep.) Graphviz. [Online]. Available: https://graphviz.org/
1991
-
[13]
Interac- tive diagrams for software documentation,
A. ˇStˇep´anek, D. Ku ˇt´ak, B. Kozl ´ıkov´a, and J. By ˇska, “Interac- tive diagrams for software documentation,” in 2024 IEEE Work- ing Conf. on Software Visualization (VISSOFT) , 2024, pp. 12–23. doi:10.1109/VISSOFT64034.2024.00012
2024
-
[14]
A Systematic Literature Review of Modern Software Visualization,
N. Chotisarn, L. Merino, X. Zheng, S. Lonapalawong, T. Zhang, M. Xu, and W. Chen, “A Systematic Literature Review of Modern Software Visualization,” Journal of Visualization , vol. 23, no. 4, pp. 539–558, Aug. 2020. doi:10.1007/s12650-020-00647-w
2020 doi
-
[15]
A Tertiary Systematic Lit- erature Review on Software Visualization,
L. Bedu, O. Tinh, and F. Petrillo, “A Tertiary Systematic Lit- erature Review on Software Visualization,” in 2019 Working Conf. on Software Visualization (VISSOFT) , 2019, pp. 33–44. doi:10.1109/VISSOFT.2019.00013
2019
-
[16]
The Code-Map Metaphor — A Review of Its Use Within Software Visualisations,
I. Bacher, B. Mac Namee, and J. Kelleher, “The Code-Map Metaphor — A Review of Its Use Within Software Visualisations,” in Proc. of the 12th Int. Joint Conf. on Computer Vision, Imaging and Computer Graphics Theory and Applications . SCITEPRESS, 2017, pp. 17–28. doi:10.5220/00...
2017 doi
-
[17]
Seesoft—A Tool For Visualizing Line Oriented Software Statistics,
S. Eick, J. Steffen, and E. Sumner, “Seesoft—A Tool For Visualizing Line Oriented Software Statistics,” IEEE Trans. on Software Engineer- ing, vol. 18, no. 11, pp. 957–968, Nov. 1992. doi:10.1109/32.177365
1992 doi
-
[18]
CodePanorama: a language agnostic tool for visual code inspection,
M. Etter and F. Mehta, “CodePanorama: a language agnostic tool for visual code inspection,” in Proc. of the 30th IEEE/ACM Int. Conf. on Program Comprehension, ser. ICPC ’22. New York, NY , USA: ACM, Oct. 2022, pp. 225–228. doi:10.1145/3524610.3527874
2022
-
[19]
Minimap — Visual Studio Code User Interface,
Microsoft, “Minimap — Visual Studio Code User Interface,”
-
[20]
Virtual software in reality,
C. Knight, “Virtual software in reality,” PhD Thesis, Durham University,
-
[21]
Visualizing Software Systems as Cities,
R. Wettel and M. Lanza, “Visualizing Software Systems as Cities,” in 2007 4th IEEE Int. Workshop on Visualizing Software for Understanding and Analysis, Jun. 2007, pp. 92–99. doi:10.1109/VISSOF.2007.4290706
2007
-
[22]
CodeMetropolis: Eclipse over the City of Source Code,
G. Balogh, A. Szabolics, and A. Besz ´edes, “CodeMetropolis: Eclipse over the City of Source Code,” in 2015 IEEE 15th Int. Working Conf. on Source Code Analysis and Manipulation (SCAM) , Sep. 2015, pp. 271–276. doi:10.1109/SCAM.2015.7335425
2015
-
[23]
CodeCity: On-Screen or in Virtual Reality?
D. Moreno-Lumbreras, R. Minelli, A. Villaverde, J. M. Gonz ´alez- Barahona, and M. Lanza, “CodeCity: On-Screen or in Virtual Reality?” in 2021 Working Conf. on Software Visualization (VISSOFT), Sep. 2021, pp. 12–22. doi:10.1109/VISSOFT52517.2021.00011
2021
-
[24]
IslandViz: A Tool for Visualizing Modular Software Systems in Virtual Reality,
M. Misiak, A. Schreiber, A. Fuhrmann, S. Zur, D. Seider, and L. Nafeie, “IslandViz: A Tool for Visualizing Modular Software Systems in Virtual Reality,” in 2018 IEEE Working Conference on Software Visualization (VISSOFT), Sep. 2018, pp. 112–116. doi:10.1109/VISSOFT.2018.00020
2018
-
[25]
The City Metaphor in Software Visualization,
C. L. Jeffery, “The City Metaphor in Software Visualization,” in Computer Science Research Notes . Z ´apadoˇcesk´a univerzita, 2019. doi:10.24132/CSRN.2019.2901.1.18
2019
-
[26]
No Unjustified 3D,
T. Munzner, “No Unjustified 3D,” in Visualization Analysis and Design. A K Peters/CRC Press, Dec. 2014, pp. 117–130. ISBN 978-0-429- 08890-2
2014
-
[27]
Polymetric Views — A Lightweight Visual Approach to Reverse Engineering,
M. Lanza and S. Ducasse, “Polymetric Views — A Lightweight Visual Approach to Reverse Engineering,” IEEE Trans. on Soft- ware Engineering , vol. 29, no. 9, pp. 782–795, Sep. 2003. doi:10.1109/TSE.2003.1232284
2003 arXiv
-
[28]
A new approach for visualizing UML class diagrams,
C. Gutwenger, M. J ¨unger, K. Klein, J. Kupke, S. Leipert, and P. Mutzel, “A new approach for visualizing UML class diagrams,” in Proc. of the 2003 ACM symposium on Software visualization , ser. SoftVis ’03. ACM, Jun. 2003, pp. 179–188. doi:10.1145/774833.774859
2003
-
[29]
E-Quality: A Graph Based Object Oriented Software Quality Visualization Tool,
U. Erdemir, U. Tekin, and F. Buzluca, “E-Quality: A Graph Based Object Oriented Software Quality Visualization Tool,” in 2011 6th 13 Int. Workshop on Visualizing Software for Understanding and Analysis (VISSOFT), Sep. 2011, pp. 1–8. doi:10.1109/VISSOF.2011.6069454
2011
-
[30]
The Recursive Disk Metaphor - A Glyph- based Approach for Software Visualization,
R. M ¨uller and D. Zeckzer, “The Recursive Disk Metaphor - A Glyph- based Approach for Software Visualization,” inProc. of the 6th Int. Conf. on Information Visualization Theory and Applications . SCITEPRESS, 2015, pp. 171–176. doi:10.5220/0005342701710176
2015 doi
-
[31]
Git-Truck: Hierarchy-Oriented Visualization of Git Repository Evolu- tion,
K. Højelse, T. Kilbak, J. Røssum, E. J ¨apelt, L. Merino, and M. Lungu, “Git-Truck: Hierarchy-Oriented Visualization of Git Repository Evolu- tion,” in 2022 Working Conf. on Software Visualization (VISSOFT), Oct. 2022, pp. 131–140. doi:10.1109/VISSOFT55257.2022.00021
2022
-
[32]
Helveg: Diagrams for Software Documentation — Supplementary Material,
A. ˇStˇep´anek, D. Kuˇt´ak, B. Kozl´ıkov´a, and J. By ˇska, “Helveg: Diagrams for Software Documentation — Supplementary Material,” Jul. 2025. doi:10.5281/zenodo.14931626
2025 doi
-
[33]
Unified Modeling Language,
OMG, “Unified Modeling Language,” Feb. 2000. [Online]. Available: https://www.omg.org/spec/UML/1.3/PDF
2000
-
[34]
(2019, Apr.) UML class diagrams | IntelliJ IDEA
JetBrains. (2019, Apr.) UML class diagrams | IntelliJ IDEA. [Online]. Available: https://www.jetbrains.com/help/idea/class-diagram.html
2019
-
[35]
(1999) Visual Paradigm
Visual Paradigm. (1999) Visual Paradigm. [Online]. Available: https://www.visual-paradigm.com/features/code-engineering-tools/
1999
-
[36]
S. Brown. (2018, Jun.) The C4 Model for Software Architecture. [On- line]. Available: https://www.infoq.com/articles/C4-architecture-model/
2018
-
[37]
(2020, Jun.) Structurizr
——. (2020, Jun.) Structurizr. [Online]. Available: https://structurizr. com/
2020
-
[38]
M. Goertz. (2023, Mar.) Visualize dependencies with code maps — Vi- sual Studio (Windows). [Online]. Available: https://learn.microsoft.com/ en-us/visualstudio/modeling/map-dependencies-across-your-solutions
2023
-
[39]
(2022) D2
Terrastruct. (2022) D2. [Online]. Available: https://github.com/ terrastruct/d2
2022
-
[40]
(2004) NDepend
ZEN PROGRAM. (2004) NDepend. [Online]. Available: https: //www.ndepend.com
2004
-
[41]
(2009) JArchitect
CoderGears. (2009) JArchitect. [Online]. Available: https://www. jarchitect.com
2009
-
[42]
S. K. Card, J. D. Mackinlay, and B. Shneiderman, Readings in Informa- tion Visualization: Using Vision to Think , ser. The Morgan Kaufmann series in interactive technologies. Morgan Kaufmann Publishers, 1999. ISBN 978-1-55860-533-6
1999
-
[43]
G. Lato. (2020) Emerge. [Online]. Available: https://github.com/glato/ emerge
2020
-
[44]
(2019) CodeSee
CodeSee. (2019) CodeSee. [Online]. Available: https://www.codesee.io/
2019
-
[45]
(2020) Swimm
Swimm. (2020) Swimm. [Online]. Available: https://swimm.io
2020
-
[46]
Siriwardena
M. Siriwardena. (2020) DependenSee. [Online]. Available: https: //github.com/madushans/DependenSee
2020
-
[47]
Li and E
S. Li and E. Xu. (2020, Mar.) Obsidian. [Online]. Available: https://obsidian.md/
2020
-
[48]
Extensible Visualization of C# Codebases,
A. ˇStˇep´anek, “Extensible Visualization of C# Codebases,” Master’s thesis, Masaryk University, Faculty of Informatics, 2023. [Online]. Available: https://is.muni.cz/th/t0bse/
2023
-
[49]
The Roslyn Project: Exposing the C# and VB compiler’s code analysis,
K. Ng, M. Warren, P. Golde, and A. Hejlsberg, “The Roslyn Project: Exposing the C# and VB compiler’s code analysis,” Microsoft Corporation, white paper, 2012. [Online]. Available: https://www.microsoft.com/en-us/download/details.aspx?id=27744
2012
-
[50]
[Online]
Microsoft, “NuGet,” 2025. [Online]. Available: https://www.nuget.org/
2025
-
[51]
MSBuild,
——, “MSBuild,” 2023. [Online]. Available: https://docs.microsoft. com/en-us/visualstudio/msbuild/msbuild
2023
-
[52]
Common Type System — .NET,
——, “Common Type System — .NET,” Jan. 2024. [Online]. Available: https://learn.microsoft.com/en-us/dotnet/standard/base-types/ common-type-system
2024
-
[53]
Munzner, Visualization Analysis and Design
T. Munzner, Visualization Analysis and Design. A K Peters/CRC Press, Dec. 2014. ISBN 978-0-429-08890-2
2014
-
[54]
A Systematic Review of Experimental Studies on Data Glyphs,
J. Fuchs, P. Isenberg, A. Bezerianos, and D. Keim, “A Systematic Review of Experimental Studies on Data Glyphs,” IEEE Trans. on Visualization and Computer Graphics , vol. 23, no. 7, pp. 1863–1879, Jul. 2017. doi:10.1109/TVCG.2016.2549018
2017
-
[55]
(2022, Feb.) Visual Studio Image Library
Microsoft. (2022, Feb.) Visual Studio Image Library. [Online]. Available: https://www.microsoft.com/en-us/download/details.aspx?id= 35825
2022
-
[56]
iwanthue: Colors for data scientists
M. Jacomy, “iwanthue: Colors for data scientists.” 2013. [Online]. Available: https://github.com/medialab/iwanthue
2013
-
[57]
chroma.js,
G. Aisch, “chroma.js,” 2011. [Online]. Available: https://github.com/ gka/chroma.js
2011
-
[58]
Ecma International, 2001
Microsoft, ECMA-335 Common Language Infrastructure (CLI) . Ecma International, 2001. [Online]. Available: https://ecma-international.org/ publications-and-standards/standards/ecma-335/
2001
-
[59]
Glyph-based Visualization: Foundations, Design Guidelines, Techniques and Applications,
R. Borgo, J. Kehrer, D. H. S. Chung, E. Maguire, R. S. Laramee, H. Hauser, M. Ward, and M. Chen, “Glyph-based Visualization: Foundations, Design Guidelines, Techniques and Applications,” in Eurographics 2013 — State of the Art Reports , M. Sbert and L. Szirmay-Kalos, Eds. The ...
2013 doi
-
[60]
Taxonomy-Based Glyph Design—with a Case Study on Visualizing Workflows of Biological Experiments,
E. Maguire, P. Rocca-Serra, S.-A. Sansone, J. Davies, and M. Chen, “Taxonomy-Based Glyph Design—with a Case Study on Visualizing Workflows of Biological Experiments,” IEEE Trans. on Visualization and Computer Graphics , vol. 18, no. 12, pp. 2603–2612, Dec. 2012. doi:10.1109/TV...
2012 doi
-
[61]
Treevis.net: A Tree Visualization Reference,
H.-J. Schulz, “Treevis.net: A Tree Visualization Reference,” IEEE Computer Graphics and Applications , vol. 31, no. 6, pp. 11–15, 2011. doi:10.1109/MCG.2011.103
2011 doi
-
[62]
Tidier Drawings of Trees,
E. Reingold and J. Tilford, “Tidier Drawings of Trees,” IEEE Trans. on Software Engineering , vol. SE-7, no. 2, pp. 223–228, Mar. 1981. doi:10.1109/TSE.1981.234519
1981
-
[63]
ForceAtlas2, a Continuous Graph Layout Algorithm for Handy Network Visualization Designed for the Gephi Software,
M. Jacomy, T. Venturini, S. Heymann, and M. Bastian, “ForceAtlas2, a Continuous Graph Layout Algorithm for Handy Network Visualization Designed for the Gephi Software,” PLOS ONE, vol. 9, no. 6, Jun. 2014. doi:10.1371/journal.pone.0098679
2014 doi
-
[64]
Roseck ´y and A
J. Roseck ´y and A. ˇStˇep´anek. (2022) KAFE. [Online]. Available: https://gitlab.fi.muni.cz/legtvar/kafe
2022
-
[65]
WebGPU, World Wide Web Consortium W3C Candidate Recommendation Draft, Jun. 2025. [Online]. Available: https: //www.w3.org/TR/webgpu/ Adam ˇStˇep´anek is a PhD student specializing in software visualization at the Visitlab research labo- ratory at the Faculty of Informatics, Ma...
2025
-
[2000]
Available: http://etheses.dur.ac.uk/4244/
[Online]. Available: http://etheses.dur.ac.uk/4244/
-
[2025]
Available: https://code.visualstudio.com/docs/getstarted/ userinterface
[Online]. Available: https://code.visualstudio.com/docs/getstarted/ userinterface
Reviewed August 6, 2026 · model on record in the stance chip above.
Discussion (0). Continue with ORCID to comment.