REVIEW 3 major objections 5 minor 2 cited by
ALMA-IMF XIX: C18O (J=2-1): Measurements of turbulence in 15 massive protoclusters
T0 review · 3 major / 5 minor · reviewed 2026-08-06 · deepseek-v4-flash
Pith's one-line read Across 15 massive protoclusters, C18O-traced gas is uniformly supersonic (Mach numbers peak at 4-7, reaching ~25), dense DCN cores carry half the turbulent linewidth, and the size-linewidth slope of 0.41-0.64 signals compressible…
desk verdict Useful homogeneous C18O turbulence census of 15 protoclusters with a robust supersonic-Mach-number result, but the size-linewidth slope rests on an unvalidated optical-depth assumption that needs a sensitivity check. read the letter →
The pith
A machine-rendered reading of the paper's core claim, the machinery that carries it, and where it could break.
The reading
What carries the argument
The central quantity is the sonic Mach number, $M_s = \sqrt{3}\,\sigma_{\rm nth}/c_s$, where $\sigma_{\rm nth}$ is the non-thermal velocity dispersion measured from the C18O line and $c_s$ is the isothermal sound speed computed from dust-temperature maps under the assumption that dust and gas kinetic temperatures are equal. The measurement flows through two named tools. The first is the effective velocity dispersion $\sigma_{\rm eff}$ (Appendix E): each pixel spectrum is decomposed into multi-Gaussian components with the machine-learning module Gausspy+, and $\sigma_{\rm eff}$ is the integrated-intensity-weighted quadrature sum of the individual component variances, deliberately excluding the velocity separation between disjoint components so that distinct clouds do not inflate the Mach number. The second is the dendrogram structure-extraction algorithm astrodendro, applied to the position-position-velocity cube, which assigns each structure a size $R$ and intensity-weighted velocity dispersion $\sigma_{\rm tot}$ that together yield the size-linewidth power-law slope $p$. The dust-temperature maps carry the assumption load in the Mach-number branch, and the structure-extraction parameters carry the assumption load in the size-linewidth branch.
What would settle it
Point the NH3 (1,1) and (2,2) lines, or another gas thermometer, at the C18O-bright gas in any three of these protoclusters: if the measured kinetic temperature deviates from the PPMAP dust temperature by tens of percent, the reported Mach numbers and the factor-of-two core-versus-envelope line-width ratio shift by comparable amounts. Alternatively, recompute the Mach number including the velocity separation between Gaussian components in the effective dispersion; if the distribution's peak moves substantially above 4-7, the claim that the C18O gas is uniformly supersonic at that level would need revision.
Extended reading notes
Core claim
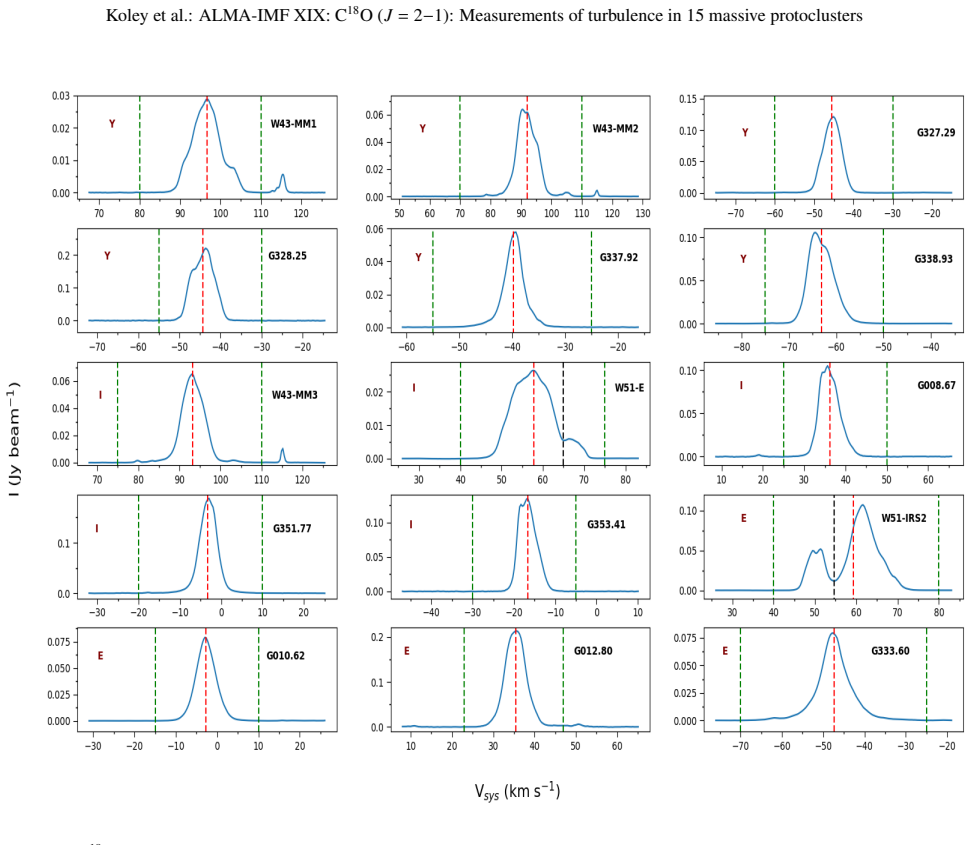
This work reports a systematic turbulence census of embedded massive protoclusters using the C18O (2-1) line. Decomposing pixel-wise spectra into Gaussian components and computing a component-weighted effective velocity dispersion, the authors map the sonic Mach number $M_s = \sqrt{3}\,\sigma_{\rm nth}/c_s$ across fifteen ALMA-IMF protoclusters. They find $M_s$ probability distributions that peak between 4 and 7 and extend to roughly 25 in every region, with no trend with evolutionary stage and no correlation with column density: the C18O-traced gas is supersonic throughout. Comparing with DCN (3-2) core line widths, they find the dense cores have, on average, half the non-thermal velocity dispersion of the surrounding C18O gas (mean $\sigma_{\rm nth}$ of about 0.6 km/s versus 1.2 km/s; mean Mach numbers about 3.3 versus 7.1), which they interpret as turbulence diminishing at small scales or dissipating at core peripheries. Finally, dendrogram-extracted structures in the position-position-velocity cube obey a size-linewidth relation $\sigma \propto R^p$ with $p$ between 0.41 and 0.64 across individual regions and $0.51 \pm 0.00$ for the combined sample, steeper than the Kolmogorov $p = 1/3$ scaling, as expected for compressible media.
Load-bearing premise
The whole Mach-number ladder rests on the assumption that gas kinetic temperature equals the dust temperature measured from thermal dust emission, plus the convention that the velocity separation between distinct spectral components is bulk motion rather than turbulence.
Editorial extensions
If this is right
- Supersonic turbulence at Mach 4-7 is ubiquitous in massive protocluster gas and does not fade as a protocluster evolves, so turbulence is sustained across the whole embedded lifetime, presumably by feedback and large-scale drivers.
- The factor-of-two drop in non-thermal linewidth from C18O gas to DCN cores means dense-core formation proceeds in locally less turbulent gas, consistent with star formation beginning where supersonic turbulence dissipates.
- The size-linewidth slope of 0.41-0.64, steeper than Kolmogorov's 1/3, indicates the turbulence in this density regime is compressible, with shocks steepening the velocity scaling.
- Stage independence of all three turbulence diagnostics means evolutionary classification of protoclusters must rely on continuum and radio indicators (such as the 1.3-to-3.0 mm flux ratio and H41-alpha emission), not on turbulence measures.
- The absence of an $M_s$--column-density correlation implies that within the low-density regime traced by C18O, turbulence is roughly homogeneous rather than growing toward denser gas; the column-density dependence only appears when contrasting with much denser core tracers.
Reading between the lines
- If the factor-of-two core-envelope linewidth contrast is a generic property of massive protoclusters, it sets a natural boundary scale (roughly the 0.015 pc DCN core size versus the 0.05 pc C18O structures) where turbulence becomes subdominant to gravity, a candidate physical origin for the peak of the core mass function.
- A direct test the authors do not perform: ammonia-based gas kinetic temperatures toward the same fields would settle the $T_d = T_k$ assumption; tens-of-percent deviations would rescale every reported Mach number and modestly shift the core-envelope ratio.
- The deliberate exclusion of inter-component velocity separations from $\sigma_{\rm eff}$ makes the reported Mach numbers best read as lower bounds on the turbulent dispersion; if the km/s-separated components seen in W51-E and W51-IRS2 are part of the turbulent cascade rather than distinct clouds, the true Mach numbers are higher.
- A natural extension of the same recipe would apply the effective-dispersion and Mach-number analysis to the N2H+ data of the survey, testing whether the turbulence drop toward cores is tracer-independent or specific to the C18O/DCN pair.
Editorial analysis
A structured set of objections, weighed in public.
Referee Report
Summary. The paper uses ALMA-IMF C18O(2-1) data toward 15 massive protoclusters to measure turbulence. It decomposes the spectra with Gausspy+, computes an effective velocity dispersion, assumes Td=Tk to derive sonic Mach numbers, and uses astrodendro on the position-position-velocity cubes to derive size-linewidth relations. It reports Mach-number distributions peaking between 4 and 7 and extending to ~25, no evolutionary trend, DCN core linewidths about half the C18O linewidths, and size-linewidth slopes p=0.41-0.64. The paper concludes that the C18O-traced gas is supersonic, that turbulence decreases toward dense cores, and that the slope is steeper than the Kolmogorov prediction, as expected for compressible media.
Significance. If correct, the paper provides a uniform, multi-cloud statistical characterization of turbulence in massive protoclusters, with quantitative predictions for the Mach-number distribution and the size-linewidth slope in the C18O-traced regime. Its strengths include detailed reduction notes and systematic checks: noise effects in Appendix C, beam-smoothing in Appendix G, HII/outflow exclusion in Section 5.3, and explicit dendrogram caveats in Appendix J. However, the headline slope and the quantitative Ms values rest on an unvalidated optical-depth law and on the Td=Tk assumption, so the central quantitative claims need targeted sensitivity work before they can be accepted at face value.
major comments (3)
- [§5.1, §5.3, and Table 4] The size-linewidth slopes reported in Table 4 (p=0.41-0.64) are the paper's main quantitative claim, but they are derived without validating the adopted C18O optical-depth law. Section 5.1 assumes log10(tau_C18O)=0.6(log10[N(H2)]-24) from the single IRDC G014.492-00.13 and argues that tau is unimportant because, for most fields, fewer than 6% of pixels have N(H2)>10^23.5 cm^-2. This is a pixel-count test, not a flux- or structure-weighted test. The high-column pixels are exactly the dense small-scale structures that form dendrogram leaves, where tau~0.5-1. Opacity broadening at those small scales would inflate sigma_tot preferentially at the small-R end of the fit, biasing p upward from a true Kolmogorov-like value. Since the fitted range spans only about one decade in R, even a tens-of-percent bias at the small-size end can move p from ~0.33 toward the reported range. I request either (i) validation of the tau(N(H2)) relation against the available 13CO(2-1) or C17O data, (ii) an explicit test that re-fits the size-linewidth relation after masking or opacity-correcting pixels with tau>0.3, or (iii) a conservative statement that the slope is an upper limit under the adopted opacity law.
- [§5.2, Eqs. (1)-(2)] The Mach-number values (peaks 4-7, extents ~25) are computed under the explicit assumption Tk=Td, using PPMAP dust temperatures that are line-of-sight column-density-weighted means. Section 5.2 does not propagate any uncertainty in this assumption. A factor-of-two error in Td changes c_s in Eq. (2) by sqrt(2) and therefore shifts Ms by ~30-40%; for the narrower lines in the sample, the thermal subtraction in Eq. (1) is a small correction, but the sound-speed normalization is not. The conclusion 'supersonic' would survive a wide range of Td, but the reported PDF peak and the comparison with DCN Mach numbers are quantitative claims. A sensitivity test varying Td (e.g., by +/-50%) or a targeted NH3-based Tk comparison for a subset of fields would make the Ms scale trustworthy.
- [§5.2 and Appendix E] The effective velocity dispersion in Appendix E, Eq. (E.6), deliberately excludes the centroid separation between Gaussian components within a pixel. This is a modeling choice that can suppress a genuine turbulent signal: in fields such as W51-E and W51-IRS2, where multiple cloud components are present along the same line of sight, the inter-component velocity separation is comparable to or larger than the internal widths. The paper justifies the choice as avoiding disjoint components that artificially inflate sigma_v, and it shows sigma_eff/sigma_v<0.5 for those fields, but it does not argue that the excluded separations are non-turbulent rather than part of the large-scale velocity field. Given that the Ms distribution and the core-versus-envelope linewidth ratio are central results, I ask for either a quantitative test that recomputes Ms with the traditional sigma_v after masking foreground/background clouds in W51-E and W51-IRS2, or an explicit statement that Ms should be interpreted as the within-component turbulent Mach number.
minor comments (5)
- [Table 3] The table header repeats 'Col 6' for both Ms,DCN and Ms,C18O; the second entry should be Col 7, and the multi-line numeric entries would be clearer in a properly typeset table.
- [General text] There are several typographical errors: 'aviod' in Section 4, 'As we did find any prominent trend' in Section 6.2, and 'truncks' in Section 7.
- [§5.3] The min_npix description, 'we set the value 2 a', appears to omit the beam-area formula; the text should state the numerical number of pixels used for each source.
- [§5.2] The phrase 'gas mass-weighted Mach number' is imprecise because the weighting is by C18O integrated intensity, not directly by gas mass; the text should say intensity-weighted.
- [§6.2 and Fig. 7] The comparison with Solomon et al. (1987) would be more informative if the normalization A were also rescaled to a common size range, since A values from surveys with different resolutions are not directly comparable.
Circularity Check
No significant circularity: Ms and the size-linewidth slope are direct measurements or reported fits, not quantities constructed from the claims they are used to support.
full rationale
The paper's headline results are not derived from the quantities they purport to test. Ms is computed directly from decomposed C18O line widths via Eq. (2), using published dust-temperature maps, with no parameter fitted to the Ms distribution itself; the supersonic conclusion is a direct comparison of the measured distribution to the sound speed, not a fitted parameter renamed as a result. The size-linewidth index p is explicitly reported as the outcome of a power-law fit (Table 4) and is benchmarked against external studies such as Solomon et al. (1987), Heyer & Brunt (2004), and Larson (1981), rather than imposed by an input. The core-versus-envelope linewidth comparison uses independently published DCN core measurements from Cunningham et al. (2023). Reliance on ALMA-IMF products, such as the Dell'Ova et al. (2024) dust temperature and column density maps, is normal use of independent published data products, and those maps were not constructed to force the present claims. The tau(N(H2)) calibration from Sabatini et al. (2022) is an external empirical input used only to argue that opacity is a minor effect; even if that calibration is under-validated, it is a robustness and correctness concern, not circular reasoning. The paper's own caveats, including the Appendix J min_value truncation test and the optical-depth pixel-count check, are acknowledged limitations and do not indicate that any target quantity was defined in terms of its own fit.
Assumptions & free parameters
free parameters (5)
- Size-linewidth power-law index p =
0.41 to 0.64 per source, 0.51 combined
- Size-linewidth normalization A =
1.72 to 3.62 km/s per source
- Gausspy+ SNR cutoff =
10
- Dendrogram intensity threshold =
2.5 sigma_rms
- Minimum FWHM for Gaussian components =
2 channels
assumptions (6)
- domain assumption Gas kinetic temperature equals dust temperature (Tk = Td) in LTE
- domain assumption C18O (2-1) emission is mostly optically thin, and where thick, the Sabatini et al. (2022) empirical N(H2)-tau relation applies
- domain assumption Velocity broadening is dominated by turbulence rather than rotation, infall, outflow, or projection of distinct clouds
- domain assumption The Gausspy+ decomposition with SNR > 10 recovers the true number of velocity components
- domain assumption Dendrogram structures in the position-position-velocity cube correspond to physical turbulent eddies
- domain assumption DCN single-Gaussian cores are representative of dense core kinematics
Cite this review
Pith. "Pith review of ALMA-IMF XIX: C18O (J=2-1): Measurements of turbulence in 15 massive protoclusters." pith.science (2026). https://pith.science/paper/E3A57CDW
@misc{pith2026250714502,
  author       = {Pith},
  title        = {Pith review of: ALMA-IMF XIX: C18O (J=2-1): Measurements of turbulence in 15 massive protoclusters},
  year         = {2026},
  howpublished = {\url{https://pith.science/paper/E3A57CDW}},
  note         = {Machine review of arXiv:2507.14502}
}
read the original abstract
ALMA-IMF is a large program of the Atacama Large Millimeter/submillimeter Array (ALMA) that aims to determine the origin of the core mass function (CMF) of 15 massive Galactic protoclusters (~ 1.0-25.0 x 10^3 solar mass within ~ 2.5 x 2.5 pc^2 ) located towards the Galactic plane. In addition, the objective of the program is to obtain a thorough understanding of their physical and kinematic properties. Here we study the turbulence in these protoclusters with C18O (2-1) emission line using the sonic Mach number analysis (M_s ) and the size-linewidth relation. The probability distribution functions (PDFs) for M_s show a similar pattern, exhibiting no clear trend associated with evolutionary stage, peaking in the range between 4 and 7, and then extending to ~ 25. Such values of M_s indicate that the turbulence in the density regime traced by the C18O line inside the protoclusters is supersonic in nature. In addition, we compare the non-thermal velocity dispersions (sigma_nth, C18O) obtained from the C18O(2-1) line with the non-thermal line widths (sigma_nth, DCN ) of the cores obtained from the DCN (3-2) line. We observe that, on average, the non-thermal linewidth in cores is half that of the gas surrounding them. This suggests that turbulence diminishes at smaller scales or dissipates at the periphery of the cores. Furthermore, we examine the size-linewidth relation for the structures we extracted from the position-position-velocity C18O(2-1) line emission cube with dendrogram algorithm. The power-law index (p) obtained from the size-linewidth relation is between 0.41 and 0.64, steeper than the Kolmogorov law of turbulence, as expected for compressible media. In conclusion, this work is one of the first to carry out such a statistical study of turbulence for embedded massive protoclusters.
Figures


Figures from the paper (4 more)


Forward citations
Cited by 2 Pith papers
-
Using Scattered Near-Infrared Light to Map Water Ice in Prestellar Cores with SPHEREx
Coreshine SPHEREx spectra map 3 µm H2O ice across four prestellar cores; the two densest show an unexplained central drop in ice absorption that standard Bonnor-Ebert scattering models cannot reproduce.
-
Challenges in probing turbulent and magnetic support in cores: the W43-MM1 protocluster case study
Simplified virial analyses of W43-MM1 cores overestimate non-thermal support because linewidths include organized motions of 1–3 km/s and surface terms are omitted, producing unexpectedly high stability fractions.
Reference graph
Works this paper leans on
-
[1]
2009, , 392, 294
Agertz , O., Lake , G., Teyssier , R., et al. 2009, , 392, 294
2009
-
[2]
H., Stutz , A
\'A lvarez-Guti \'e rrez , R. H., Stutz , A. M., Law , C. Y., et al. 2021, , 908, 86
2021
-
[3]
H., Stutz , A
\'A lvarez-Guti \'e rrez , R. H., Stutz , A. M., Sandoval-Garrido , N., et al. 2024, , 689, A74
2024
-
[4]
M., et al
Ao , Y., Henkel , C., Menten , K. M., et al. 2013, , 550, A135
2013
-
[5]
ALMA-IMF X -- The core population in the evolved W33-Main (G012.80) protocluster
Armante , M., Gusdorf , A., Louvet , F., et al. 2024 a , arXiv e-prints, arXiv:2401.09203
work page Pith review arXiv 2024
-
[6]
2024 b , , 686, A122
Armante , M., Gusdorf , A., Louvet , F., et al. 2024 b , , 686, A122
2024
-
[7]
P., Tollerud , E
Astropy Collaboration , Robitaille , T. P., Tollerud , E. J., et al. 2013, , 558, A33
2013
-
[8]
T., Henshaw , J
Barnes , A. T., Henshaw , J. D., Fontani , F., et al. 2021, , 503, 4601
2021
Show all 117 references
-
[9]
T., Liu , J., Zhang , Q., et al
Barnes , A. T., Liu , J., Zhang , Q., et al. 2023, , 675, A53
2023
-
[10]
2024, arXiv e-prints, arXiv:2402.15023
Bonfand , M., Csengeri , T., Bontemps , S., et al. 2024, arXiv e-prints, arXiv:2402.15023
2024 arXiv
-
[11]
2022, , 665, A140
Brouillet , N., Despois , D., Molet , J., et al. 2022, , 665, A140
2022
-
[12]
1948, in Advances in Applied Mechanics, Vol
Burgers, J. 1948, in Advances in Applied Mechanics, Vol. 1, A Mathematical Model Illustrating the Theory of Turbulence, ed. R. Von Mises & T. Von Kármán (Elsevier), 171--199
1948
-
[13]
2016, , 819, 139
Busquet , G., Estalella , R., Palau , A., et al. 2016, , 819, 139
2016
-
[14]
E., Caselli , P., et al
Choudhury , S., Pineda , J. E., Caselli , P., et al. 2021, , 648, A114
2021
-
[15]
2017, , 601, A60
Csengeri , T., Bontemps , S., Wyrowski , F., et al. 2017, , 601, A60
2017
-
[16]
2023, , 678, A194
Cunningham , N., Ginsburg , A., Galv \'a n-Madrid , R., et al. 2023, , 678, A194
2023
-
[17]
2024, , 687, A217
Dell'Ova , P., Motte , F., Gusdorf , A., et al. 2024, , 687, A217
2024
-
[18]
Dewangan , L. K. 2022, , 513, 2942
2022
-
[19]
J., Brogan , C., Indebetouw , R., et al
Dirienzo , W. J., Brogan , C., Indebetouw , R., et al. 2015, , 150, 159
2015
-
[20]
2015, , 450, 4035
Federrath , C. 2015, , 450, 4035
2015
-
[21]
2018, Physics Today, 71, 38
Federrath , C. 2018, Physics Today, 71, 38
2018
-
[22]
& Klessen , R
Federrath , C. & Klessen , R. S. 2012, , 761, 156
2012
-
[23]
Fleck , R. C., J. 1983, , 272, L45
1983
-
[24]
1995, Turbulence
Frisch , U. 1995, Turbulence. The legacy of A.N. Kolmogorov
1995
-
[25]
J., Motte , F., et al
Galv \'a n-Madrid , R., D \' az-Gonz \'a lez , D. J., Motte , F., et al. 2024, , 274, 15
2024
-
[26]
2017, arXiv e-prints, arXiv:1702.06627
Ginsburg , A. 2017, arXiv e-prints, arXiv:1702.06627
2017 arXiv
-
[27]
2022, , 662, A9
Ginsburg , A., Csengeri , T., Galv \'a n-Madrid , R., et al. 2022, , 662, A9
2022
-
[28]
A., Barranco , J
Goodman , A. A., Barranco , J. A., Wilner , D. J., & Heyer , M. H. 1998, , 504, 223
1998
-
[29]
2024, , 966, 51
Green , A., Wong , T., Indebetouw , R., et al. 2024, , 966, 51
2024
-
[30]
2016, , 591, A104
Hacar , A., Alves , J., Burkert , A., & Goldsmith , P. 2016, , 591, A104
2016
-
[31]
2023, , 957, 61
He , Y.-X., Liu , H.-L., Tang , X.-D., et al. 2023, , 957, 61
2023
-
[32]
& Inutsuka , S.-i
Hennebelle , P. & Inutsuka , S.-i. 2019, Frontiers in Astronomy and Space Sciences, 6, 5
2019
-
[33]
Heyer , M. H. & Brunt , C. M. 2004, , 615, L45
2004
-
[34]
2010, , 720, 603
Hezareh , T., Houde , M., McCoey , C., & Li , H.-b. 2010, , 720, 603
2010
-
[35]
M., & Churchwell , E
Hofner , P., Wyrowski , F., Walmsley , C. M., & Churchwell , E. 2000, , 536, 393
2000
-
[36]
Hunter, J. D. 2007, Computing in Science & Engineering, 9, 90
2007
-
[37]
Joung , M. K. R. & Mac Low , M.-M. 2006, , 653, 1266
2006
-
[38]
H., Kulesa , C
Kang , M., Bieging , J. H., Kulesa , C. A., et al. 2010, , 190, 58
2010
-
[39]
2017, , 603, A89
Kauffmann , J., Pillai , T., Zhang , Q., et al. 2017, , 603, A89
2017
-
[40]
Koch, E., Rosolowsky, E., & Leroy, A. K. 2018, Research Notes of the AAS, 2, 220
2018
-
[41]
2019, , 483, 593
Koley , A. 2019, , 483, 593
2019
-
[42]
2022, , 516, 185
Koley , A. 2022, , 516, 185
2022
-
[43]
2023 a , , 40, e053
Koley , A. 2023 a , , 40, e053
2023
-
[44]
2023 b , , 40, e046
Koley , A. 2023 b , , 40, e046
2023
-
[45]
M., et al
Koley , A., Roy , N., Menten , K. M., et al. 2021, , 501, 4825
2021
-
[46]
P., & Datta , A
Koley , A., Roy , N., Momjian , E., Sarma , A. P., & Datta , A. 2022, , 516, L48
2022
-
[47]
1941, Akademiia Nauk SSSR Doklady, 30, 301
Kolmogorov , A. 1941, Akademiia Nauk SSSR Doklady, 30, 301
1941
-
[48]
G., Carpenter , J
Kong , S., Arce , H. G., Carpenter , J. M., et al. 2021, , 161, 229
2021
-
[49]
& Lazarian , A
Kowal , G. & Lazarian , A. 2007, , 666, L69
2007
-
[50]
Larson , R. B. 1981, , 194, 809
1981
-
[51]
2011, , 533, A85
Leurini , S., Pillai , T., Stanke , T., et al. 2011, , 533, A85
2011
-
[52]
& Houde , M
Li , H.-b. & Houde , M. 2008, , 677, 1151
2008
-
[53]
B., et al
Li , S., Zhang , Q., Liu , H. B., et al. 2020, , 896, 110
2020
-
[54]
R., Vera-Ciro , C., Murray , C
Lindner , R. R., Vera-Ciro , C., Murray , C. E., et al. 2015, , 149, 138
2015
-
[55]
Liu , H. B. 2017, , 597, A70
2017
-
[56]
2019, , 487, 1259
Liu , H.-L., Stutz , A., & Yuan , J.-H. 2019, , 487, 1259
2019
-
[57]
2022, , 511, 4480
Liu , H.-L., Tej , A., Liu , T., et al. 2022, , 511, 4480
2022
-
[58]
2016, , 595, A122
Louvet , F., Motte , F., Gusdorf , A., et al. 2016, , 595, A122
2016
-
[59]
2024, , 690, A33
Louvet , F., Sanhueza , P., Stutz , A., et al. 2024, , 690, A33
2024
-
[60]
B., et al
Lu , X., Zhang , Q., Liu , H. B., et al. 2018, , 855, 9
2018
-
[61]
& Klessen , R
Mac Low , M.-M. & Klessen , R. S. 2004, Reviews of Modern Physics, 76, 125
2004
-
[62]
K., Sharma , S., Dewangan , L
Mallick , K. K., Sharma , S., Dewangan , L. K., et al. 2023, Journal of Astrophysics and Astronomy, 44, 34
2023
-
[63]
Mangum , J. G. & Shirley , Y. L. 2015, , 127, 266
2015
-
[64]
A., Velusamy , T., & Ware , B
Marsh , K. A., Velusamy , T., & Ware , B. 2006, , 132, 1789
2006
-
[65]
A., Whitworth , A
Marsh , K. A., Whitworth , A. P., & Lomax , O. 2015, , 454, 4282
2015
-
[66]
A., Whitworth , A
Marsh , K. A., Whitworth , A. P., Lomax , O., et al. 2017, , 471, 2730
2017
-
[67]
P., Waters , B., Schiebel , D., Young , W., & Golap , K
McMullin , J. P., Waters , B., Schiebel , D., Young , W., & Golap , K. 2007, in Astronomical Society of the Pacific Conference Series, Vol. 376, Astronomical Data Analysis Software and Systems XVI, ed. R. A. Shaw , F. Hill , & D. J. Bell , 127
2007
-
[68]
& Combes , F
Melchior , A.-L. & Combes , F. 2016, , 585, A44
2016
-
[69]
H., Federrath , C., Klaassen , P., Kuiper , R., & Reiter , M
Menon , S. H., Federrath , C., Klaassen , P., Kuiper , R., & Reiter , M. 2021, , 500, 1721
2021
-
[70]
2022, , 662, A8
Motte , F., Bontemps , S., Csengeri , T., et al. 2022, , 662, A8
2022
-
[71]
2014, , 571, A32
Motte , F., Nguy \^e n Luong , Q., Schneider , N., et al. 2014, , 571, A32
2014
-
[72]
2018, Nature Astronomy, 2, 478
Motte , F., Nony , T., Louvet , F., et al. 2018, Nature Astronomy, 2, 478
2018
-
[73]
2024, arXiv e-prints, arXiv:2412.02011
Motte , F., Pouteau , Y., Nony , T., et al. 2024, arXiv e-prints, arXiv:2412.02011
2024 arXiv
-
[74]
Myers , P. C. 1983, , 270, 105
1983
-
[75]
1998, , 494, 587
Nakano , T. 1998, , 494, 587
1998
-
[76]
2011, , 529, A41
Nguyen Luong , Q., Motte , F., Schuller , F., et al. 2011, , 529, A41
2011
-
[77]
2015, , 216, 18
Nishimura , A., Tokuda , K., Kimura , K., et al. 2015, , 216, 18
2015
-
[78]
2023, , 674, A75
Nony , T., Galv \'a n-Madrid , R., Motte , F., et al. 2023, , 674, A75
2023
-
[79]
2020, , 636, A38
Nony , T., Motte , F., Louvet , F., et al. 2020, , 636, A38
2020
-
[80]
2023, , 949, 63
Ohno , T., Tokuda , K., Konishi , A., et al. 2023, , 949, 63
2023
-
[81]
H., Pety , J., Gerin , M., et al
Orkisz , J. H., Pety , J., Gerin , M., et al. 2017, , 599, A99
2017
-
[82]
M., et al
Palau , A., Zhang , Q., Girart , J. M., et al. 2021, , 912, 159
2021
-
[83]
2023, , 519, 3851
Pan , S., Liu , H.-L., & Qin , S.-L. 2023, , 519, 3851
2023
-
[84]
B., & Ortega , M
Paron , S., Areal , M. B., & Ortega , M. E. 2018, , 617, A14
2018
-
[85]
A., Kruijssen , J
Petkova , M. A., Kruijssen , J. M. D., Henshaw , J. D., et al. 2023, , 525, 962
2023
-
[86]
M., & Kr \"u gel , E
Pillai , T., Wyrowski , F., Menten , K. M., & Kr \"u gel , E. 2006, , 447, 929
2006
-
[87]
E., Schmiedeke , A., Caselli , P., et al
Pineda , J. E., Schmiedeke , A., Caselli , P., et al. 2021, , 912, 7
2021
-
[88]
E., Soler , J
Pineda , J. E., Soler , J. D., Offner , S., et al. 2024, , 690, L5
2024
-
[89]
2022, , 664, A26
Pouteau , Y., Motte , F., Nony , T., et al. 2022, , 664, A26
2022
-
[90]
R., Eswaraiah , C., et al
Rawat , V., Samal , M. R., Eswaraiah , C., et al. 2024, , 528, 1460
2024
-
[91]
D., Stutz , A
Reyes-Reyes , S. D., Stutz , A. M., Megeath , S. T., et al. 2024, , 529, 2220
2024
-
[92]
S., Goodman , A
Rice , T. S., Goodman , A. A., Bergin , E. A., Beaumont , C., & Dame , T. M. 2016, , 822, 52
2016
-
[93]
D., et al
Riener , M., Kainulainen , J., Henshaw , J. D., et al. 2019, , 628, A78
2019
-
[94]
W., Pineda , J
Rosolowsky , E. W., Pineda , J. E., Kauffmann , J., & Goodman , A. A. 2008, , 679, 1338
2008
-
[95]
2022, , 936, 80
Sabatini , G., Bovino , S., Sanhueza , P., et al. 2022, , 936, 80
2022
-
[96]
2019, , 490, 4489
Sabatini , G., Giannetti , A., Bovino , S., et al. 2019, , 490, 4489
2019
-
[97]
2022, , 516, 1983
Saha , A., Tej , A., Liu , H.-L., et al. 2022, , 516, 1983
2022
-
[98]
2022, , 925, 144
Sakai , T., Sanhueza , P., Furuya , K., et al. 2022, , 925, 144
2022
-
[99]
2013, , 432, 3288
S \'a nchez-Monge , \'A ., Palau , A., Fontani , F., et al. 2013, , 432, 3288
2013
-
[100]
A., Stutz , A
Sandoval-Garrido , N. A., Stutz , A. M., \'A lvarez-Guti \'e rrez , R. H., et al. 2024, arXiv e-prints, arXiv:2410.09843
2024 arXiv
-
[101]
2010, , 715, 18
Sanhueza , P., Garay , G., Bronfman , L., et al. 2010, , 715, 18
2010
-
[102]
2024, arXiv e-prints, arXiv:2412.08790
Sanhueza , P., Liu , J., Morii , K., et al. 2024, arXiv e-prints, arXiv:2412.08790
2024 arXiv
-
[103]
2007, , 671, 1839
Schnee , S., Caselli , P., Goodman , A., et al. 2007, , 671, 1839
2007
-
[104]
N., Burton , M
Shetty , R., Beaumont , C. N., Burton , M. G., Kelly , B. C., & Klessen , R. S. 2012, , 425, 720
2012
-
[105]
M., Rivolo , A
Solomon , P. M., Rivolo , A. R., Barrett , J., & Yahil , A. 1987, , 319, 730
1987
-
[106]
Stahler , S. W. & Palla , F. 2004, The Formation of Stars
2004
-
[107]
Stutz , A. M. 2018, , 473, 4890
2018
-
[108]
Stutz , A. M. & Gould , A. 2016, , 590, A2
2016
-
[109]
2020, , 642, A68
Syed , J., Wang , Y., Beuther , H., et al. 2020, , 642, A68
2020
-
[110]
Towner , A. P. M., Ginsburg , A., Dell'Ova , P., et al. 2024, , 960, 48
2024
-
[111]
A., Goldsmith , P
Ungerechts , H., Bergin , E. A., Goldsmith , P. F., et al. 1997, , 482, 245
1997
-
[112]
& Wang , K
Wang , C. & Wang , K. 2023, , 674, A46
2023
-
[113]
M., Galv \'a n-Madrid , R., et al
Wang , J.-W., Koch , P. M., Galv \'a n-Madrid , R., et al. 2020, , 905, 158
2020
-
[114]
2021, arXiv e-prints, arXiv:2107.13323
Yun , H.-S., Lee , J.-E., Evans , Neal J., I., et al. 2021, arXiv e-prints, arXiv:2107.13323
2021 arXiv
-
[115]
2022, , 513, 638
Zhou , J.-X., Li , G.-X., & Chen , B.-Q. 2022, , 513, 638
2022
-
[116]
, " * write output.state after.block = add.period write newline
ENTRY address archiveprefix author booktitle chapter edition editor howpublished institution eprint journal key month note number organization pages publisher school series title type volume year label extra.label sort.label short.list INTEGERS output.state before.all mid.sent...
-
[117]
write newline
" write newline "" before.all 'output.state := FUNCTION n.dashify 't := "" t empty not t #1 #1 substring "-" = t #1 #2 substring "--" = not "--" * t #2 global.max substring 't := t #1 #1 substring "-" = "-" * t #2 global.max substring 't := while if t #1 #1 substring * t #2 gl...
Reviewed August 6, 2026 · model on record in the stance chip above.
Discussion (0). Continue with ORCID to comment.