REVIEW 3 major objections 5 minor 87 references
SceneLoom: Communicating Data with Scene Context
T0 review · 3 major / 5 minor · reviewed 2026-08-06 · deepseek-v4-flash
Pith's one-line read SceneLoom claims that data charts and real-world photos can be coordinated by a vision-language model guided by a structured design space, and it presents a prototype that generates and refines such designs.
desk verdict Solid design-space and system paper whose effectiveness claim outruns the evidence; worth reviewing, needs a stronger evaluation. read the letter →
The pith
A machine-rendered reading of the paper's core claim, the machinery that carries it, and where it could break.
The reading
What carries the argument
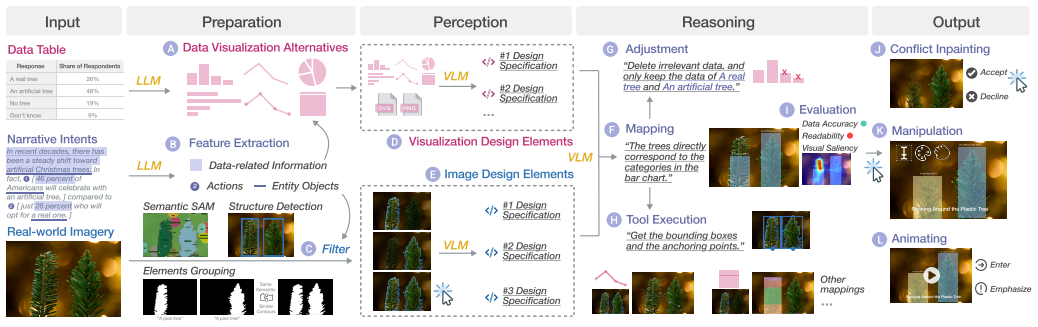
The load-bearing mechanism is SceneLoom's two-stage vision-language coordination loop, backed by a design space derived from a 54-video corpus and expert interviews. In the perception stage, the system encodes data charts and scene images into declarative specifications covering granularity, geometry, layout, and semantic role. In the reasoning stage, a vision-language model maps between the two sides using spatial organization, shape similarity, layout consistency, and semantic binding, and executes the mapping through programmatic chart templates and image-editing operations such as segmentation, structure detection, and inpainting. The system then evaluates candidates on data accuracy, readability, and visual saliency before handing control to the user for refinement and animation.
What would settle it
Show independent viewers a set of SceneLoom-generated designs and ask them to read the encoded values, for example by comparing bar heights or line positions against the source table; if error rates are no better than with plain charts, the claim that scene integration preserves or improves data communication would be refuted. A second check is to run the same designs through an automated data-accuracy audit to see whether the filtering and sorting steps ever contradict the original table.
Extended reading notes
Core claim
On its own terms, the paper's central claim is that chart-scene coordination is a structured design problem, not an open-ended artistic one. The paper claims to identify the components on both sides and the mapping relationships between them, and to show that a vision-language model can perform the mapping when prompted with such components and with four design considerations: spatial organization, shape similarity, layout consistency, and semantic binding. The result is said to be a set of expressive design alternatives that preserve data accuracy while aligning with the scene, for example binding two Christmas-tree categories to two photographed trees and reordering the data to follow an image contour. The paper further claims that users can explore, select, adjust, and animate these alternatives to externalize their ideas, and that the user study and gallery validate the system's ability to inspire creative design and support design externalization.
Load-bearing premise
The paper's effectiveness claim rests on the assumption that positive self-reported ratings from a small user group — 10 participants in the method section, though the failure-case discussion refers to 16 — demonstrate that SceneLoom improves expressive data communication, since there is no baseline condition and no objective measure of viewer accuracy.
Editorial extensions
If this is right
- Data-story authors can select from machine-generated chart-scene coordinations instead of manually masking and overlaying, with interactive editing reserved for final refinement.
- Because the design space is expressed independently of chart type, the coordination logic should transfer to scrollytelling, infographics, and augmented-reality storytelling.
- The perception stage removes the need for users to name or mask objects: segmentation and semantic labelling are done by the system, lowering the entry barrier for non-experts.
- The four design considerations give designers a concrete vocabulary for critiquing and comparing proposals, such as whether a mapping respects layout or carries a semantic binding.
- Narrative actions such as 'enter' and 'emphasize' drive animated transitions, extending the approach from a single static image to data-video authoring.
Reading between the lines
- Beyond the paper: the design space would also serve as a descriptive taxonomy for existing data-journalism pieces, labelling each chart-scene pairing by its coordination type and making style trends comparable across outlets.
- Beyond the paper: a direct experiment the paper does not run would measure value-estimation accuracy for SceneLoom outputs against plain charts; if scene integration distorts reading, the expressive benefits would need a trade-off statement.
- Beyond the paper: the reported failure cases suggest a practical pre-filter, namely screening out images with no semantic match to the data or with heavy clutter before vision-language reasoning runs, which would lower generation cost and user disappointment.
- Beyond the paper: the structured specifications are reusable, so scoring them with an independent vision-language model would give an automated, objective proxy for mapping quality without recruiting participants.
Editorial analysis
A structured set of objections, weighed in public.
Referee Report
Summary. SceneLoom is a VLM-powered system that coordinates data visualizations with real-world imagery based on user-supplied narrative intents. The paper contributes: (1) a design space of coordination relationships derived from a corpus analysis of 54 data videos and expert interviews, organized around visual alignment and semantic coherence; (2) a prototype system that uses GPT-4o, SAM, Semantic-SAM, HED, and M-LSD to perceive, reason about, and map visualization and scene components, generating design alternatives with user refinement and animation; and (3) an evaluation consisting of an example gallery and a user study with self-reported questionnaires and interviews. The paper's central claim is that SceneLoom 'facilitates the coordination of data visualization with real-world imagery based on narrative intents' and 'generates a set of contextually expressive, image-driven design alternatives that achieve coherent alignments across visual, semantic, and data dimensions,' with the user study and gallery validating its effectiveness in inspiring creative design and facilitating design externalization (Abstract, Sec. 5).
Significance. If validated, SceneLoom would be a useful contribution to data-driven storytelling, providing a structured way to align data visualizations with scene imagery and reduce the effort of creating expressive, context-rich designs. The paper's strengths include a systematically derived design space from a corpus and expert feedback, a fully implemented prototype with a detailed workflow, an example gallery demonstrating a variety of design outcomes, and qualitative evidence that the system supports creative ideation for a small set of users. The main weakness is that the evaluation evidence is not yet commensurate with the effectiveness claim: the user study has no baseline or comparison condition, the outcome measures are subjective self-reports, and the automatic quality evaluation is performed by the same class of model that generates the designs. These issues prevent the paper from establishing that SceneLoom improves expressive data communication to an audience, as opposed to assisting designers in generating personally satisfying artifacts. The correctness risk is substantial but addressable through additional evaluation, so the contribution is best assessed after major revision.
major comments (3)
- [Sec. 5.2, Fig. 9] The central claim that SceneLoom 'validate[s] its effectiveness in inspiring creative design and facilitating design externalization' is not supported by the reported user study because there is no baseline condition, no comparison to prior systems such as DataQuilt, and no objective measurement of whether the final designs accurately communicate the underlying data to viewers. The quantitative results are six Likert items on usability, satisfaction, and recommendation, and the qualitative results are self-selected positive comments. For a system whose stated goal is 'expressive data communication' with 'coherent alignments across visual, semantic, and data dimensions,' the study should include a viewer-facing comprehension task (e.g., reading values, comparing categories, or verifying data fidelity) or an independent expert evaluation of the generated designs' data accuracy, rather than only the creators' subjective impressions.
- [Sec. 4.4.4, Fig. 5I] The automatic design evaluation is circular with respect to the claim of data-alignment quality: GPT-4o both generates the design alternatives (Sec. 4.4.1) and evaluates them for data accuracy, visual readability, and attention (Sec. 4.4.4), with no reported external validation of the evaluator against ground truth or human judgments. The paper presents these VLM assessments as part of the system's output and uses them to support the alignment claim, but without independent validation, the 'data dimension' of the alignment remains asserted by the generator rather than measured. At minimum, the authors should report a validation study comparing the VLM's accuracy and readability scores against human ratings on a sample of generated designs.
- [Sec. 5.2.1 and 5.2.2] The participant count is inconsistent between subsections: Sec. 5.2.1 states 'We recruited 10 participants (P1-P10),' while Sec. 5.2.2 reports 'Among the 16 participants, three did not initially receive design suggestions.' Since the reported user study is the primary empirical evidence for the effectiveness claim, this discrepancy undermines confidence in the evaluation and must be corrected and reconciled, including any details of how the 16-person set is defined (e.g., pilot participants or additional sessions).
minor comments (5)
- [Sec. 3.2] The corpus analysis reports that 'two authors independently coded the videos and resolved differences through discussion,' but no inter-coder reliability measure (e.g., Cohen's kappa) is reported; adding such a measure would strengthen the reproducibility of the design space.
- [Sec. 4.4.1] The paper references 'Chain-of-Thought (CoT) manner' prompting and says sample prompts are in the appendix, but the main text does not include any representative prompt; provide at least one example prompt in the main paper or make the appendix publicly accessible in the camera-ready version.
- [Sec. 5.1] The example gallery is described as 'a selection' of participant-created artifacts, but the selection criteria are not stated; reporting how and why these examples were chosen would clarify representativeness.
- [Figures 3, 4, 6] The text labels in the specification schematics (Fig. 6) and the design-space diagrams (Figs. 3, 4) are very small and difficult to read in the PDF; please increase font sizes or provide zoomed insets.
- [Sec. 6] The section heading paragraph begins 'In this session,' which appears to be a typo for 'In this section.'
Circularity Check
No construction-level circularity found: SceneLoom's design space, pipeline, and evaluation are not fitted-to-input predictions or self-citation tautologies.
full rationale
SceneLoom does not derive a result from a parameter fitted to the same data, nor does it import a load-bearing uniqueness theorem from the authors' prior work. The design space in Sec. 3 is grounded in corpus coding of 54 videos plus expert interviews, and the prototype in Sec. 4 is described as a concrete VLM pipeline with stated inputs (CSV, narrative text, images) and procedures (SAM, HED, M-LSD, GPT-4o). The claimed contributions are validated by qualitative user feedback and an example gallery rather than by any equation-level prediction, so there is no identity between inputs and outputs to expose. The main validity concern, noted in the reader's take, is that GPT-4o both generates design alternatives (Sec. 4.4.1) and supplies automatic data-accuracy and readability scores (Sec. 4.4.4), making those in-system scores non-independent. However, the paper's central effectiveness claim is not based solely on those automatic scores; it is grounded in participant self-reports and expert feedback, and the Limitations section explicitly acknowledges that 'our evaluation strategy primarily relies on user studies to assess users' experiences with the system and their satisfaction with the resulting designs.' That is an independence/measurement limitation rather than a circular reduction. The participant-count inconsistency between Sec. 5.2.1 (10 participants) and Sec. 5.2.2 (16 participants) weakens confidence in the evaluation reporting but is not circularity. No self-citation chain or ansatz-smuggled-by-citation pattern is present in the load-bearing argument.
Assumptions & free parameters
free parameters (1)
- GPT-4o decoding hyperparameters (temperature, top_p, max_tokens) =
not reported
assumptions (4)
- domain assumption The design space induced from 54 selected data videos is complete and generalizable to other images, datasets, and media.
- domain assumption GPT-4o reliably performs visual perception, design reasoning, tool invocation, and design evaluation within the prompt structure.
- domain assumption SAM, Semantic-SAM, HED, and M-LSD outputs are sufficiently accurate to support fine-grained overlay alignment.
- domain assumption The Card et al. three-level visual mapping framework appropriately captures the visualization side of the design space.
Cite this review
Pith. "Pith review of SceneLoom: Communicating Data with Scene Context." pith.science (2026). https://pith.science/paper/4F6BOUZP
@misc{pith2026250716466,
  author       = {Pith},
  title        = {Pith review of: SceneLoom: Communicating Data with Scene Context},
  year         = {2026},
  howpublished = {\url{https://pith.science/paper/4F6BOUZP}},
  note         = {Machine review of arXiv:2507.16466}
}
read the original abstract
In data-driven storytelling contexts such as data journalism and data videos, data visualizations are often presented alongside real-world imagery to support narrative context. However, these visualizations and contextual images typically remain separated, limiting their combined narrative expressiveness and engagement. Achieving this is challenging due to the need for fine-grained alignment and creative ideation. To address this, we present SceneLoom, a Vision-Language Model (VLM)-powered system that facilitates the coordination of data visualization with real-world imagery based on narrative intents. Through a formative study, we investigated the design space of coordination relationships between data visualization and real-world scenes from the perspectives of visual alignment and semantic coherence. Guided by the derived design considerations, SceneLoom leverages VLMs to extract visual and semantic features from scene images and data visualization, and perform design mapping through a reasoning process that incorporates spatial organization, shape similarity, layout consistency, and semantic binding. The system generates a set of contextually expressive, image-driven design alternatives that achieve coherent alignments across visual, semantic, and data dimensions. Users can explore these alternatives, select preferred mappings, and further refine the design through interactive adjustments and animated transitions to support expressive data communication. A user study and an example gallery validate SceneLoom's effectiveness in inspiring creative design and facilitating design externalization.
Figures


Figures from the paper (6 more)



Reference graph
Works this paper leans on
- [1]
-
[2]
Avrahami, D
O. Avrahami, D. Lischinski, and O. Fried. Blended diffusion for text- driven editing of natural images. In2022 IEEE/CVF Conference on Computer Vision and Pattern Recognition (CVPR), vol. 2022, pp. 18187– 18197, 2022. 2
2022
-
[3]
Bostock, V
M. Bostock, V . Ogievetsky, and J. Heer. D³ data-driven documents.IEEE Trans. Vis. Comput. Graph., 17(12):2301–2309, 2011. 5
2011
-
[4]
T. Cai, X. Wang, T. Ma, X. Chen, and D. Zhou. Large language models as tool makers. InProc. ICLR, 2024. 9
2024
-
[5]
S. K. Card, J. Mackinlay, and B. Shneiderman.Readings in information visualization: using vision to think. Morgan Kaufmann, 1999. 3
1999
-
[6]
Q. Chen, W. Shuai, J. Zhang, Z. Sun, and N. Cao. Beyond numbers: Creating analogies to enhance data comprehension and communication with generative ai. InProceedings of the 2024 CHI Conference on Human Factors in Computing Systems, CHI ’24. ACM, 2024. 2
2024
-
[7]
Cheng, L
P. Cheng, L. Lin, J. Lyu, Y . Huang, W. Luo, and X. Tang. Prior: Prototype representation joint learning from medical images and reports. In2023 IEEE/CVF International Conference on Computer Vision (ICCV), vol. 2023, pp. 21304–21314, 2023. 2
2023
-
[8]
L. B. Chilton, E. J. Ozmen, S. H. Ross, and V . Liu. Visifit: Structuring iterative improvement for novice designers. InProceedings of the 2021 CHI Conference on Human Factors in Computing Systems. ACM, 2021. 2
2021
Show all 87 references
-
[9]
L. B. Chilton, S. Petridis, and M. Agrawala. Visiblends: A flexible workflow for visual blends. InProceedings of the 2019 CHI Conference on Human Factors in Computing Systems, CHI ’19, p. 1–14. ACM, 2019. 2
2019
-
[10]
D. Choi, S. Hong, J. Park, J. J. Y . Chung, and J. Kim. Creativeconnect: Supporting reference recombination for graphic design ideation with gen- erative ai. InProceedings of the 2024 CHI Conference on Human Factors in Computing Systems, CHI ’24. ACM, 2024. 1, 2
2024
-
[11]
Coelho and K
D. Coelho and K. Mueller. Infomages: Embedding Data into Thematic Images.Computer Graphics Forum, 2020. 1, 2
2020
-
[12]
L. Gao, J. Lu, Z. Shao, Z. Lin, S. Yue, C. Leong, Y . Sun, R. J. Zauner, Z. Wei, and S. Chen. Fine-tuned large language model for visualization system: A study on self-regulated learning in education.IEEE Trans. Vis. Comput. Graph., 31(1):514–524, 2025. 9
2025
-
[13]
A. A. Ginart, N. Kodali, J. Lee, C. Xiong, S. Savarese, and J. Em- mons. Asynchronous tool usage for real-time agents.arXiv preprint arXiv:2410.21620, 2024. 9
2024 arXiv
-
[14]
G. Gu, B. Ko, S. Go, S.-H. Lee, J. Lee, and M. Shin. Towards light-weight and real-time line segment detection.Proceedings of the AAAI Conference on Artificial Intelligence, 36(1):726–734, 2022. 5
2022
-
[15]
Guardian
T. Guardian. Edward snowden and the nsa files: facts and figures,
-
[16]
G. Guo, J. J. Kang, R. S. Shah, H. Pfister, and S. Varma. Understanding graphical perception in data visualization through zero-shot prompting of vision-language models.arXiv preprint arXiv:2411.00257, 2024. 2
2024 arXiv
-
[17]
Q. Guo, S. De Mello, H. Yin, W. Byeon, K. C. Cheung, Y . Yu, P. Luo, and S. Liu. Regiongpt: Towards region understanding vision language model. InProceedings of the IEEE/CVF Conference on Computer Vision and Pattern Recognition (CVPR), pp. 13796–13806, 2024. 2
2024
-
[18]
He and E
S. He and E. Adar. Vizitcards: A card-based toolkit for infovis design education.IEEE Trans. Vis. Comput. Graph., 23(1):561–570, 2017. 7
2017
-
[19]
Herman, C
B. Herman, C. D. Jackson, and D. F. Keefe. Touching the ground: Eval- uating the effectiveness of data physicalizations for spatial data analysis tasks.IEEE Trans. Vis. Comput. Graph., 31(1):875–885, 2025. 2
2025
-
[20]
Hosseini, A
A. Hosseini, A. Kazerouni, S. Akhavan, M. Brudno, and B. Taati. Sum: Saliency unification through mamba for visual attention modeling. In Proc. WACV, pp. 1597–1607, 2025. 6
2025
-
[21]
Huang, M
D. Huang, M. Tory, B. Adriel Aseniero, L. Bartram, S. Bateman, S. Carpen- dale, A. Tang, and R. Woodbury. Personal visualization and personal visual analytics.IEEE Trans. Vis. Comput. Graph., 21(3):420–433, 2015. 2
2015
-
[22]
M. S. Islam, R. Rahman, A. Masry, M. T. R. Laskar, M. T. Nayeem, and E. Hoque. Are large vision language models up to the challenge of chart comprehension and reasoning. InFindings of EMNLP 2024, pp. 3334–3368. ACL, 2024. 2
2024
-
[23]
T. W. S. Journal. This chinese restaurant chain built its $9b empire off customer service, 2024. https://www.youtube.com/watch?v= 0jci98uOrWQ&t=170s. Accessed: 2025-03-23. 3
2024
-
[24]
Y . Kang, Z. Sun, S. Wang, Z. Huang, Z. Wu, and X. Ma. Metamap: Supporting visual metaphor ideation through multi-dimensional example- based exploration. InProceedings of the 2021 CHI Conference on Human Factors in Computing Systems, CHI ’21. ACM, 2021. 1, 2
2021
-
[25]
Kirillov, E
A. Kirillov, E. Mintun, N. Ravi, H. Mao, C. Rolland, L. Gustafson, T. Xiao, S. Whitehead, A. C. Berg, W.-Y . Lo, P. Dollár, and R. Girshick. Segment anything. In2023 IEEE/CVF International Conference on Computer Vision (ICCV), vol. 2023, pp. 3992–4003, 2023. 2, 5
2023
-
[26]
W. Kong, Z. Jiang, S. Sun, Z. Guo, W. Cui, T. Liu, J. Lou, and D. Zhang. Aesthetics++: Refining graphic designs by exploring design principles and human preference.IEEE Trans. Vis. Comput. Graph., 29(6):3093–3104,
-
[27]
Kouts, L
A. Kouts, L. Besançon, M. Sedlmair, and B. Lee. Lsdvis: Halluci- natory data visualisations in real world environments.arXiv preprint arXiv:2312.11144, 2023. 1, 2
2023 arXiv
-
[28]
Kuruvilla, D
J. Kuruvilla, D. Sukumaran, A. Sankar, and S. P. Joy. A review on image processing and image segmentation. In2016 International Conference on Data Mining and Advanced Computing (SAPIENCE), pp. 198–203, 2016. 2
2016
-
[29]
Laing and M
S. Laing and M. Masoodian. A study of the influence of visual imagery on graphic design ideation.Design Studies, 45:187–209, 2016. 2
2016
-
[30]
X. Lan, Y . Wu, and N. Cao. Affective visualization design: Leveraging the emotional impact of data.IEEE Trans. Vis. Comput. Graph., 30(1):1–11,
-
[31]
B. Lee, X. Hu, M. Cordeil, A. Prouzeau, B. Jenny, and T. Dwyer. Shared surfaces and spaces: Collaborative data visualisation in a co-located im- mersive environment.IEEE Trans. Vis. Comput. Graph., 27(2):1171–1181,
-
[32]
F. Li, H. Zhang, P. Sun, X. Zou, S. Liu, C. Li, J. Yang, L. Zhang, and J. Gao. Segment and recognize anything at any granularity. In18th European Conference on Computer Vision, ECCV’24, p. 467–484. Springer-Verlag,
-
[33]
H. Li, L. Ying, L. Shen, Y . Wang, Y . Wu, and H. Qu. Composing Data Stories with Meta Relations.arXiv preprint arXiv:2501.03603, 2025. 2
2025 arXiv
-
[34]
Z. Li, C. Gebhardt, Y . Inglin, N. Steck, P. Streli, and C. Holz. Situation- adapt: Contextual ui optimization in mixed reality with situation awareness via llm reasoning. InProceedings of the 37th Annual ACM Symposium on User Interface Software and Technology, UIST ’24. ACM, 2024. 2
2024
-
[35]
H. Liu, C. Li, Q. Wu, and Y . J. Lee. Visual instruction tuning. InThirty- seventh Conference on Neural Information Processing Systems, 2023. 2
2023
-
[36]
Z. Liu, X. Xie, M. He, W. Zhao, Y . Wu, L. Cheng, H. Zhang, and Y . Wu. Smartboard: Visual exploration of team tactics with llm agent.IEEE Trans. Vis. Comput. Graph., 31(1):23–33, 2025. 2
2025
-
[37]
Lukáˇc, J
M. Lukáˇc, J. Fišer, J.-C. Bazin, O. Jamriška, A. Sorkine-Hornung, and D. Sýkora. Painting by feature: texture boundaries for example-based image creation.ACM Trans. Graph., 32(4), article no. 116, 2013. 2
2013
-
[38]
Lundgard and A
A. Lundgard and A. Satyanarayan. Accessible visualization via natural language descriptions: A four-level model of semantic content.IEEE Trans. Vis. Comput. Graph., 28(1):1073–1083, 2022. 2
2022
-
[39]
MacKelvie
M. MacKelvie. The clutch goat...(it’s not who you think). https:// www.youtube.com/watch?v=qjjW1l9KjXQ&t=763s. Accessed: 2025- 03-23. 3
2025
-
[40]
F. Meng, J. Wang, C. Li, Q. Lu, H. Tian, T. Yang, J. Liao, X. Zhu, J. Dai, Y . Qiao, P. Luo, K. Zhang, and W. Shao. MMIU: Multimodal multi-image understanding for evaluating large vision-language models. InProc. ICLR,
-
[41]
Morais, Y
L. Morais, Y . Jansen, N. Andrade, and P. Dragicevic. Showing data about people: A design space of anthropographics.IEEE Trans. Vis. Comput. Graph., 28(3):1661–1679, 2022. 2
2022
-
[42]
Ouyang, L
Y . Ouyang, L. Shen, Y . Wang, and Q. Li. NotePlayer: Engaging Com- putational Notebooks for Dynamic Presentation of Analytical Processes. InProceedings of the 37th Annual ACM Symposium on User Interface Software and Technology, pp. 1–20. ACM, 2024. 9
2024
-
[43]
Rombach, A
R. Rombach, A. Blattmann, D. Lorenz, P. Esser, and B. Ommer. High- Resolution Image Synthesis with Latent Diffusion Models . pp. 10674– 10685. IEEE, 2022. 2
2022
-
[44]
Z. Shao, L. Shen, H. Li, Y . Shan, H. Qu, Y . Wang, and S. Chen. Narrative Player: Reviving Data Narratives with Visuals.IEEE Trans. Vis. Comput. Graph., pp. 1–15, 2025. 9
2025
-
[45]
L. Shen, H. Li, Y . Wang, T. Luo, Y . Luo, and H. Qu. Data playwright: Authoring data videos with annotated narration.IEEE Trans. Vis. Comput. Graph., pp. 1–14, 2024. 9
2024
-
[46]
L. Shen, H. Li, Y . Wang, and H. Qu. From Data to Story: Towards Automatic Animated Data Video Creation with LLM-Based Multi-Agent Systems. InIEEE VIS 2024 Workshop on Data Storytelling in an Era of Generative AI, GEN4DS‘24, pp. 20–27. IEEE, 2024. 9
2024
-
[47]
L. Shen, H. Li, Y . Wang, and H. Qu. Reflecting on Design Paradigms of Animated Data Video Tools. InProceedings of the 2025 CHI Conference on Human Factors in Computing Systems, pp. 1–21. ACM, 2025. 1
2025
-
[48]
L. Shen, H. Li, Y . Wang, X. Xie, and H. Qu. Prompting Generative AI with Interaction-Augmented Instructions. InExtended Abstracts of the CHI Conference on Human Factors in Computing Systems, CHI EA ’25, pp. 1–9. ACM, 2025. 9
2025
-
[49]
L. Shen, E. Shen, Y . Luo, X. Yang, X. Hu, X. Zhang, Z. Tai, and J. Wang. Towards natural language interfaces for data visualization: A survey.IEEE Trans. Vis. Comput. Graph., 29(6):3121–3144, 2023. 3
2023
-
[50]
L. Shen, Y . Zhang, H. Zhang, and Y . Wang. Data Player: Automatic Generation of Data Videos with Narration-Animation Interplay.IEEE Trans. Vis. Comput. Graph., 30(1):109–119, 2024. 9
2024
-
[51]
X. Shi, M. Liu, Z. Zhou, A. Neshati, R. Rossi, and J. Zhao. Exploring interactive color palettes for abstraction-driven exploratory image coloriza- tion. InProceedings of the 2024 CHI Conference on Human Factors in Computing Systems, CHI ’24. ACM, 2024. 2
2024
-
[52]
X. Shi, Y . Wang, R. Rossi, and J. Zhao. Brickify: Enabling expressive design intent specification through direct manipulation on design tokens. arXiv preprint arXiv:2502.21219, 2025. 2, 3
2025 arXiv
-
[53]
Y . Shi, X. Lan, J. Li, Z. Li, and N. Cao. Communicating with motion: A design space for animated visual narratives in data videos. InProceedings of the 2021 CHI Conference on Human Factors in Computing Systems, CHI ’21. ACM, 2021. 3
2021
-
[54]
Sitzmann, A
V . Sitzmann, A. Serrano, A. Pavel, M. Agrawala, D. Gutierrez, B. Masia, and G. Wetzstein. Saliency in vr: How do people explore virtual envi- ronments?IEEE Trans. Vis. Comput. Graph., 24(4):1633–1642, 2018. 6
2018
-
[55]
T. Tang, J. Tang, J. Lai, L. Ying, Y . Wu, L. Yu, and P. Ren. Smartshots: An optimization approach for generating videos with data visualizations embedded.ACM Trans. Interact. Intell. Syst., 12(1), 2022. 1
2022
-
[56]
W. Tong, K. Shigyo, L.-P. Yuan, M. Fan, T.-C. Pong, H. Qu, and M. Xia. Vistellar: Embedding data visualization to short-form videos using mobile augmented reality.IEEE Trans. Vis. Comput. Graph., 31(3):1862–1874,
-
[57]
World cup penalty kicks, tracked, 2023
V ox. World cup penalty kicks, tracked, 2023. https://www.youtube. com/watch?v=HAuwPue57Vs&t=151s. Accessed: 2025-03-23. 3
2023
-
[58]
F. Wang, B. Wang, X. Shu, Z. Liu, Z. Shao, C. Liu, and S. Chen. Chartinsighter: An approach for mitigating hallucination in time-series chart summary generation with a benchmark dataset.arXiv preprint arXiv:2501.09349, 2025. 2
2025 arXiv
-
[59]
W. Wang, Z. Chen, X. Chen, J. Wu, X. Zhu, G. Zeng, P. Luo, T. Lu, J. Zhou, Y . Qiao, and J. Dai. Visionllm: large language model is also an open-ended decoder for vision-centric tasks. InProceedings of the 37th International Conference on Neural Information Processing Systems,...
2023
-
[60]
Y . Wang, L. Shen, Z. You, X. Shu, B. Lee, J. Thompson, H. Zhang, and D. Zhang. WonderFlow: Narration-Centric Design of Animated Data Videos.IEEE Trans. Vis. Comput. Graph., pp. 1–17, 2024. 9
2024
-
[61]
Z. Wang, A. Li, Z. Li, and X. Liu. Genartist: Multimodal LLM as an agent for unified image generation and editing. InThe Thirty-eighth Annual Conference on Neural Information Processing Systems, 2024. 2, 6
2024
-
[62]
J. Wei, X. Wang, D. Schuurmans, M. Bosma, B. Ichter, F. Xia, E. H. Chi, Q. V . Le, and D. Zhou. Chain-of-thought prompting elicits reasoning in large language models. InProceedings of the 36th International Con- ference on Neural Information Processing Systems, NIPS ’22. Curra...
2022
-
[63]
Willett, Y
W. Willett, Y . Jansen, and P. Dragicevic. Embedded data representations. IEEE Trans. Vis. Comput. Graph., 23(1):461–470, 2017. 2, 3, 9
2017
-
[64]
J. Wu, J. J. Y . Chung, and E. Adar. viz2viz: Prompt-driven styl- ized visualization generation using a diffusion model.arXiv preprint arXiv:2304.01919, 2023. 1, 2
2023 arXiv
-
[65]
Y . Wu, L. Yan, L. Shen, Y . Wang, N. Tang, and Y . Luo. ChartInsights: Evaluating Multimodal Large Language Models for Low-Level Chart Question Answering. InFindings of the Association for Computational Linguistics: EMNLP 2024, pp. 12174–12200. ACL, 2024. 2
2024
-
[66]
S. Xiao, S. Huang, Y . Lin, Y . Ye, and W. Zeng. Let the chart spark: Embedding semantic context into chart with text-to-image generative model.IEEE Trans. Vis. Comput. Graph., 30(1):284–294, 2024. 1, 2
2024
-
[67]
Xiaofeng and L
R. Xiaofeng and L. Bo. Discriminatively trained sparse code gradients for contour detection. InAdvances in Neural Information Processing Systems, vol. 25. Curran Associates, Inc., 2012. 5
2012
-
[68]
What have we gone through to control the yellow river,
Xinpianchang. What have we gone through to control the yellow river,
-
[69]
L. Yang, X. Xu, X. Lan, Z. Liu, S. Guo, Y . Shi, H. Qu, and N. Cao. A design space for applying the freytag’s pyramid structure to data stories. IEEE Trans. Vis. Comput. Graph., 28(1):922–932, 2022. 3
2022
-
[70]
Z. Yang, L. Li, J. Wang, K. Lin, E. Azarnasab, F. Ahmed, Z. Liu, C. Liu, M. Zeng, and L. Wang. Mm-react: Prompting chatgpt for multimodal reasoning and action.arXiv preprint arXiv:2303.11381, 2023. 2
2023 arXiv
-
[71]
L. Yao, F. Bucchieri, V . McArthur, A. Bezerianos, and P. Isenberg. User experience of visualizations in motion: A case study and design considera- tions.IEEE Trans. Vis. Comput. Graph., 31(1):174–184, 2025. 2
2025
-
[72]
L. Yao, R. Vuillemot, A. Bezerianos, and P. Isenberg. Designing for visualization in motion: Embedding visualizations in swimming videos. IEEE Trans. Vis. Comput. Graph., 30(3):1821–1836, 2024. 2
2024
-
[73]
Y . Ye, R. Huang, and W. Zeng. Visatlas: An image-based exploration and query system for large visualization collections via neural image embedding.IEEE Trans. Vis. Comput. Graph., 30(7):3224–3240, 2024. 2
2024
-
[74]
L. Ying, T. Tang, Y . Luo, L. Shen, X. Xie, L. Yu, and Y . Wu. Glyphcreator: Towards example-based automatic generation of circular glyphs.IEEE Trans. Vis. Comput. Graph., 28(1):400–410, 2022. 3
2022
-
[75]
T. Yu, R. Feng, R. Feng, J. Liu, X. Jin, W. Zeng, and Z. Chen. Inpaint anything: Segment anything meets image inpainting.arXiv preprint arXiv:2304.06790, 2023. 6
2023 arXiv
-
[76]
L.-P. Yuan, Z. Zhou, J. Zhao, Y . Guo, F. Du, and H. Qu. Infocolorizer: Interactive recommendation of color palettes for infographics.IEEE Trans. Vis. Comput. Graph., 28(12):4252–4266, 2022. 2
2022
-
[77]
X. Zeng, H. Lin, Y . Ye, and W. Zeng. Advancing multimodal large language models in chart question answering with visualization-referenced instruction tuning.IEEE Trans. Vis. Comput. Graph., 31(1):525–535, 2025. 2
2025
-
[78]
J. E. Zhang, N. Sultanum, A. Bezerianos, and F. Chevalier. Dataquilt: Extracting visual elements from images to craft pictorial visualizations. In Proceedings of the 2020 CHI Conference on Human Factors in Computing Systems, CHI ’20, p. 1–13. ACM, 2020. 1, 2
2020
-
[79]
Zhang, A
L. Zhang, A. Rao, and M. Agrawala. Adding conditional control to text- to-image diffusion models. In2023 IEEE/CVF International Conference on Computer Vision (ICCV), vol. 3836-3847, pp. 3813–3824, 2023. 2
2023
-
[80]
J. Zhou, R. Li, J. Tang, T. Tang, H. Li, W. Cui, and Y . Wu. Understanding nonlinear collaboration between human and ai agents: A co-design frame- work for creative design. InProceedings of the 2024 CHI Conference on Human Factors in Computing Systems, CHI ’24. ACM, 2024. 2
2024
-
[81]
M. Zhou, D. Zhang, W. You, Z. Yu, Y . Wu, C. Pan, H. Liu, T. Lao, and P. Chen. Stylefactory: Towards better style alignment in image creation through style-strength-based control and evaluation. InProceedings of the 37th Annual ACM Symposium on User Interface Software and Tech...
2024
-
[82]
T. Zhou, G. Y .-Y . Chan, S. Guo, J. Hoffswell, C. Xiao, V . S. Bursztyn, and E. Koh. Data pictorial: Deconstructing raster images for data-aware ani- mated vector posters. InProceedings of the 37th Annual ACM Symposium on User Interface Software and Technology, UIST’24. ACM, 2024. 2
2024
-
[83]
Zhu-Tian, Y
C. Zhu-Tian, Y . Wang, Q. Wang, Y . Wang, and H. Qu. Towards automated infographic design: Deep learning-based auto-extraction of extensible timeline.IEEE Trans. Vis. Comput. Graph., 26(1):917–926, 2020. 2, 3
2020
-
[84]
Zhu-Tian, Q
C. Zhu-Tian, Q. Yang, X. Xie, J. Beyer, H. Xia, Y . Wu, and H. Pfister. Sporthesia: Augmenting sports videos using natural language.IEEE Trans. Vis. Comput. Graph., 29(1):918–928, 2023. 2
2023
-
[85]
Zhu-Tian, S
C. Zhu-Tian, S. Ye, X. Chu, H. Xia, H. Zhang, H. Qu, and Y . Wu. Aug- menting sports videos with viscommentator.IEEE Trans. Vis. Comput. Graph., 28(1):824–834, 2022. 2, 3
2022
-
[2014]
Accessed: 2025-03-23
https://www.youtube.com/watch?v=OFCNqkDWMtY&t=110s. Accessed: 2025-03-23. 3
2025
-
[2024]
Accessed: 2025-03-23
https://www.xinpianchang.com/a12453678?kw=Guangxi% 20Nationalities%20Museum. Accessed: 2025-03-23. 3
2025
Reviewed August 6, 2026 · model on record in the stance chip above.
Discussion (0). Sign in to comment.