Invariant Features for Global Crop Type Classification
Pith reviewed 2026-05-18 18:59 UTC · model grok-4.3
The pith
Simple spectral-temporal convolutions learn crop signatures that transfer reliably across continents despite shifts in climate and timing.
A machine-rendered reading of the paper's core claim, the machinery that carries it, and where it could break.
Core claim
Geographic transfer in crop classification is governed by the capacity to learn invariant structure within multispectral time series. CropNet, a lightweight architecture that jointly convolves across spectral and temporal dimensions, extracts these invariant crop signatures more effectively than larger transformer or foundation-model approaches, and combining it with augmentations that mimic phenology and reflectance shifts produces substantial gains under cross-hemisphere conditions.
What carries the argument
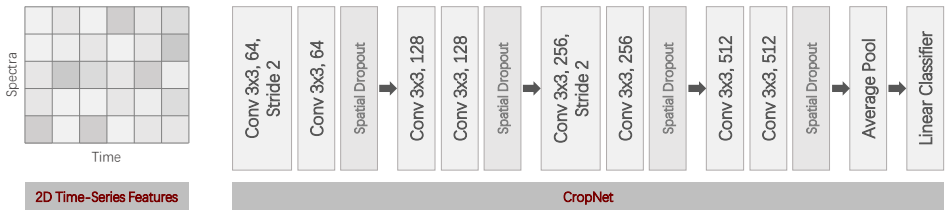
CropNet, a convolutional network that performs joint convolutions over the spectral and temporal axes of multispectral time series to isolate invariant crop signatures.
If this is right
- Training data can be collected from a modest number of representative countries and still support accurate mapping in unseen regions.
- Inductive bias toward joint spectral-temporal structure matters more for transfer performance than increasing model size or using large-scale pretraining.
- Targeted augmentations that simulate phenological and reflectance shifts close much of the gap created by geographic variation.
- Operational systems can prioritize coverage of key climate zones over exhaustive labeling of every country.
Where Pith is reading between the lines
- Joint spectral-temporal convolution may improve domain generalization in other remote-sensing time-series tasks such as land-cover change or vegetation monitoring.
- Minimal local fine-tuning on top of these invariant features could enable rapid adaptation to new continents with very little additional labeling.
- The same invariance principle suggests that simpler architectures might suffice for many other geographic transfer problems in Earth observation.
Load-bearing premise
The benchmark transfer settings and the phenology-reflectance augmentations adequately represent the distribution of real geographic domain shifts that appear in operational global crop mapping.
What would settle it
A new cross-hemisphere test set in which foundation-model embeddings achieve higher crop-type accuracy than the joint spectral-temporal convolutional model.
Figures






read the original abstract
Accurate global crop type mapping supports agricultural monitoring and food security, yet remains limited by the scarcity of labeled data in many regions. A key challenge is enabling models trained in one geography to generalize reliably to others despite shifts in climate, phenology, and spectral characteristics. In this work, we show that geographic transfer in crop classification is primarily governed by the ability to learn invariant structure in multispectral time series. To systematically study this, we introduce CropGlobe, a globally distributed benchmark dataset of 300,000 samples spanning eight countries and five continents, and define progressively harder transfer settings from cross-country to cross-hemisphere. Across all settings, we find that simple spectral-temporal representations outperform both handcrafted features and modern geospatial foundation model embeddings. We propose CropNet, a lightweight convolutional architecture that jointly convolves across spectral and temporal dimensions to learn invariant crop signatures. Despite its simplicity, CropNet consistently outperforms larger transformer-based and foundation-model approaches under geographic domain shift. To further improve robustness to geographic variation, we introduce augmentations that simulate shifts in crop phenology and reflectance. Combined with CropNet, this yields substantial gains under large domain shifts. Our results demonstrate that inductive bias toward joint spectral-temporal structure is more critical for transfer than model scale or pretraining, pointing toward a scalable and data-efficient paradigm for worldwide agricultural mapping. Data and code are available at https://github.com/x-ytong/CropNet/.
Editorial analysis
A structured set of objections, weighed in public.
Referee Report
Summary. The manuscript introduces CropGlobe, a new globally distributed benchmark of 300,000 multispectral time-series samples spanning eight countries and five continents, together with progressively harder geographic transfer protocols (cross-country to cross-hemisphere). It proposes CropNet, a lightweight CNN that performs joint spectral-temporal convolution, and a set of augmentations that simulate phenology and reflectance shifts. The central claim is that these simple invariant spectral-temporal representations, when combined with the augmentations, consistently outperform both handcrafted features and larger transformer-based or geospatial foundation-model embeddings under domain shift, demonstrating that inductive bias toward joint structure is more important than model scale for global crop-type mapping.
Significance. If the empirical claims are substantiated, the work would be significant for remote-sensing ML by showing that modest, domain-aware inductive biases plus targeted augmentations can exceed the transfer performance of much larger pretrained models. The public release of the CropGlobe dataset and code is a clear strength that enables reproducibility and follow-on research. The emphasis on invariant features rather than scale offers a data-efficient alternative for operational global agricultural monitoring.
major comments (3)
- [§4.2 and §5] §4.2 (Augmentations) and §5 (Experiments): No quantitative diagnostic is supplied to verify that the phenology and reflectance augmentations produce training distributions whose statistical properties are close to those of the real target domains (e.g., no KL divergence, MMD, or temporal-profile comparison between augmented source and held-out cross-hemisphere time series). Because the headline robustness gains rest on this assumption, the absence of such a check is load-bearing.
- [§5] §5 (Results): The abstract and experimental narrative assert consistent outperformance across transfer settings, yet the manuscript supplies no tables with per-setting accuracies, standard deviations, error bars, or statistical significance tests. Without these, the magnitude and reliability of the claimed gains over foundation models cannot be evaluated.
- [§3] §3 (Transfer settings): The progressively harder geographic splits are well-motivated, but the paper does not report any analysis of residual domain factors (soil type, irrigation practices, sensor calibration, or cultivar differences) that are not captured by the proposed augmentations; if these dominate real shifts, the reported invariance may be specific to the simulated perturbations.
minor comments (2)
- [§4.1] Notation for the joint spectral-temporal convolution in CropNet could be clarified with an explicit equation showing the kernel dimensions and how spectral and temporal axes are treated.
- [Figures 1-3] Figure captions for the dataset distribution maps and augmentation examples should include the exact number of samples per country and the precise parameter ranges used for phenology/reflectance shifts.
Simulated Author's Rebuttal
We thank the referee for the constructive and detailed comments, which help clarify the empirical support for our claims on invariant spectral-temporal features for global crop mapping. We address each major comment below and indicate the corresponding revisions to the manuscript.
read point-by-point responses
-
Referee: [§4.2 and §5] No quantitative diagnostic is supplied to verify that the phenology and reflectance augmentations produce training distributions whose statistical properties are close to those of the real target domains (e.g., no KL divergence, MMD, or temporal-profile comparison between augmented source and held-out cross-hemisphere time series). Because the headline robustness gains rest on this assumption, the absence of such a check is load-bearing.
Authors: We agree that quantitative diagnostics would strengthen the validation of the augmentations. In the revised manuscript, we have added Maximum Mean Discrepancy (MMD) computations between the distributions of augmented source samples and held-out cross-hemisphere target time series, reported in an expanded Section 4.2. We also include supplementary temporal profile comparisons and KL divergence estimates on key spectral bands to demonstrate that the simulated shifts approximate real geographic variations. These additions directly support the robustness claims. revision: yes
-
Referee: [§5] The abstract and experimental narrative assert consistent outperformance across transfer settings, yet the manuscript supplies no tables with per-setting accuracies, standard deviations, error bars, or statistical significance tests. Without these, the magnitude and reliability of the claimed gains over foundation models cannot be evaluated.
Authors: We acknowledge that comprehensive per-setting reporting is necessary for rigorous evaluation. The revised Section 5 now includes detailed tables listing accuracies for every transfer protocol (cross-country through cross-hemisphere), with standard deviations across five random seeds. Error bars have been added to all figures, and we report p-values from paired statistical tests comparing CropNet against the foundation-model baselines. These changes allow precise assessment of the performance differences. revision: yes
-
Referee: [§3] The progressively harder geographic splits are well-motivated, but the paper does not report any analysis of residual domain factors (soil type, irrigation practices, sensor calibration, or cultivar differences) that are not captured by the proposed augmentations; if these dominate real shifts, the reported invariance may be specific to the simulated perturbations.
Authors: We recognize this as a substantive limitation in fully characterizing domain shift. In the revised Section 3 we have added a discussion of residual factors using available CropGlobe metadata on soil and irrigation where present, together with a correlation analysis between these factors and observed performance drops. An ablation isolating subsets of samples with similar soil characteristics is also included. We note that complete isolation of all factors would require additional labeled covariates beyond the current benchmark and have explicitly listed this as a limitation and future direction. revision: partial
Circularity Check
No significant circularity in empirical ML study
full rationale
This paper is an empirical machine learning study that introduces the CropGlobe dataset and CropNet model, then evaluates them via held-out geographic transfer experiments across countries and hemispheres. No equations, derivations, or first-principles claims appear that reduce any result to fitted parameters or self-referential definitions by construction. Performance comparisons to handcrafted features and foundation models rest on external benchmarks and data splits rather than internal fitting loops or self-citation chains. The augmentations and transfer settings are defined explicitly but serve as experimental controls, not as tautological predictions. The work is therefore self-contained against external benchmarks with no load-bearing circular steps.
Axiom & Free-Parameter Ledger
axioms (1)
- domain assumption Geographic transfer performance is primarily governed by the model's ability to extract invariant spectral-temporal structure rather than by model scale or pretraining corpus.
Forward citations
Cited by 1 Pith paper
-
Harvesting AlphaEarth: Benchmarking the Geospatial Foundation Model for Agricultural Downstream Tasks
AEF embeddings perform competitively with RS models for local agricultural tasks but show limited spatial transferability, time sensitivity, and interpretability.
Reference graph
Works this paper leans on
-
[1]
C. Monfreda, N. Ramankutty, and J. A. Foley, “Farming the planet: 2. geographic distribution of crop areas, yields, physiological types, and net primary production in the year 2000,” Global Biogeochemical Cycles, vol. 22, no. 1, 2008
work page 2000
-
[2]
I. Becker-Reshef, C. Justice, B. Barker, M. Humber, F. Rembold, R. Bonifacio, M. Zappacosta, M. Budde, T. Magadzire, C. Shitote et al. , “Strengthening agricultural decisions in countries at risk of food insecurity: The geoglam crop monitor for early warning,” Remote Sensing of Environment , vol. 237, p. 111553, 2020
work page 2020
-
[3]
The influence of climate change on global crop productivity,
D. B. Lobell and S. M. Gourdji, “The influence of climate change on global crop productivity,” Plant Physiology, vol. 160, no. 4, pp. 1686–1697, 2012
work page 2012
-
[4]
M. Haasnoot, J. H. Kwakkel, W. E. Walker, and J. Ter Maat, “Dynamic adaptive policy pathways: A method for crafting robust decisions for a deeply uncertain world,” Global Environmental Change , vol. 23, no. 2, pp. 485–498, 2013. 26
work page 2013
-
[5]
Solutions for a cultivated planet,
J. A. Foley, N. Ramankutty, K. A. Brauman, E. S. Cassidy, J. S. Gerber, M. Johnston, N. D. Mueller, C. O’Connell, D. K. Ray, P. C. West et al. , “Solutions for a cultivated planet,” Nature, vol. 478, no. 7369, pp. 337–342, 2011
work page 2011
-
[6]
S. Wang, G. Azzari, and D. B. Lobell, “Crop type mapping without field-level labels: Random forest transfer and unsupervised clustering techniques,” Remote Sensing of Environment, vol. 222, pp. 303–317, 2019
work page 2019
-
[7]
U.S. Department of Agriculture, National Agricultural Statistics Service, “Cropland data layer,” https: //nassgeodata.gmu.edu/CropScape/, 2024
work page 2024
-
[8]
Agriculture and Agri-Food Canada, “Annual crop inventory,” https://search.open.canada.ca/openma p/ba2645d5-4458-414d-b196-6303ac06c1c9, 2023
work page 2023
-
[9]
UK Rural Payments Agency, “Crop map of england (crome),” https://environment.data.gov.uk/datase t/a27312b5-d6c9-4710-ad5e-382d727c1b05, 2023
work page 2023
-
[10]
D. M. Kluger, S. Wang, and D. B. Lobell, “Two shifts for crop mapping: Leveraging aggregate crop statistics to improve satellite-based maps in new regions,” Remote Sensing of Environment , vol. 262, p. 112488, 2021
work page 2021
-
[11]
G. Yang, X. Li, P. Liu, X. Yao, Y. Zhu, W. Cao, and T. Cheng, “Automated in-season mapping of winter wheat in china with training data generation and model transfer,” ISPRS Journal of Photogrammetry and Remote Sensing , vol. 202, pp. 422–438, 2023
work page 2023
-
[12]
H. Kerner, S. Chaudhari, A. Ghosh, C. Robinson, A. Ahmad, E. Choi, N. Jacobs, C. Holmes, M. Mohr, R. Dodhia et al. , “Fields of the world: A machine learning benchmark dataset for global agricultural field boundary segmentation,” in Proceedings of the AAAI Conference on Artificial Intelligence , vol. 39, no. 27, 2025, pp. 28 151–28 159
work page 2025
-
[13]
S. Wang, F. Waldner, and D. B. Lobell, “Unlocking large-scale crop field delineation in smallholder farming systems with transfer learning and weak supervision,” Remote Sensing, vol. 14, no. 22, p. 5738, 2022
work page 2022
-
[14]
Combining deep learning and street view imagery to map small- holder crop types,
J. L. Soler, T. Friedel, and S. Wang, “Combining deep learning and street view imagery to map small- holder crop types,” in Proceedings of the AAAI Conference on Artificial Intelligence , vol. 38, no. 20, 2024, pp. 22 202–22 212
work page 2024
-
[15]
Exploring google street view with deep learning for crop type mapping,
Y. Yan and Y. Ryu, “Exploring google street view with deep learning for crop type mapping,” ISPRS Journal of Photogrammetry and Remote Sensing , vol. 171, pp. 278–296, 2021
work page 2021
-
[16]
H. Li, X.-P. Song, M. C. Hansen, I. Becker-Reshef, B. Adusei, J. Pickering, L. Wang, L. Wang, Z. Lin, V. Zalles et al. , “Development of a 10-m resolution maize and soybean map over china: Matching satellite-based crop classification with sample-based area estimation,” Remote Sensing of Environment , vol. 294, p. 113623, 2023
work page 2023
-
[17]
C. Lin, L. Zhong, X.-P. Song, J. Dong, D. B. Lobell, and Z. Jin, “Early-and in-season crop type mapping without current-year ground truth: Generating labels from historical information via a topology-based approach,” Remote Sensing of Environment , vol. 274, p. 112994, 2022
work page 2022
-
[18]
Phenology-based sample generation for supervised crop type classification,
M. Belgiu, W. Bijker, O. Csillik, and A. Stein, “Phenology-based sample generation for supervised crop type classification,” International Journal of Applied Earth Observation and Geoinformation , vol. 95, p. 102264, 2021. 27
work page 2021
-
[19]
M. Belgiu and O. Csillik, “Sentinel-2 cropland mapping using pixel-based and object-based time-weighted dynamic time warping analysis,” Remote Sensing of Environment , vol. 204, pp. 509–523, 2018
work page 2018
-
[20]
Pre-and within-season crop type classification trained with archival land cover information,
D. M. Johnson and R. Mueller, “Pre-and within-season crop type classification trained with archival land cover information,” Remote Sensing of Environment , vol. 264, p. 112576, 2021
work page 2021
-
[21]
Y. Cai, K. Guan, J. Peng, S. Wang, C. Seifert, B. Wardlow, and Z. Li, “A high-performance and in- season classification system of field-level crop types using time-series landsat data and a machine learning approach,” Remote Sensing of Environment , vol. 210, pp. 35–47, 2018
work page 2018
-
[22]
I. Aneece, D. Foley, P. Thenkabail, A. Oliphant, and P. Teluguntla, “New generation hyperspectral data from desis compared to high spatial resolution planetscope data for crop type classification,” IEEE Journal of Selected Topics in Applied Earth Observations and Remote Sensing , vol. 15, pp. 7846–7858, 2022
work page 2022
-
[23]
I. Aneece and P. S. Thenkabail, “New generation hyperspectral sensors desis and prisma provide im- proved agricultural crop classifications,”Photogrammetric Engineering & Remote Sensing, vol. 88, no. 11, pp. 715–729, 2022
work page 2022
-
[24]
I. Aneece and P. Thenkabail, “Accuracies achieved in classifying five leading world crop types and their growth stages using optimal earth observing-1 hyperion hyperspectral narrowbands on google earth engine,” Remote Sensing, vol. 10, no. 12, p. 2027, 2018
work page 2027
-
[25]
I. Aneece and P. S. Thenkabail, “Classifying crop types using two generations of hyperspectral sensors (hyperion and desis) with machine learning on the cloud,” Remote Sensing, vol. 13, no. 22, p. 4704, 2021
work page 2021
-
[26]
L. Blickensd¨ orfer, M. Schwieder, D. Pflugmacher, C. Nendel, S. Erasmi, and P. Hostert, “Mapping of crop types and crop sequences with combined time series of sentinel-1, sentinel-2 and landsat 8 data for germany,” Remote Sensing of Environment , vol. 269, p. 112831, 2022
work page 2022
-
[27]
Y. Zhou, J. Luo, L. Feng, Y. Yang, Y. Chen, and W. Wu, “Long-short-term-memory-based crop classifi- cation using high-resolution optical images and multi-temporal sar data,” GIScience & Remote Sensing, vol. 56, no. 8, pp. 1170–1191, 2019
work page 2019
-
[28]
Rice crop monitoring using sentinel-1 sar data: A case study in saku, japan,
S. Kobayashi and H. Ide, “Rice crop monitoring using sentinel-1 sar data: A case study in saku, japan,” Remote Sensing, vol. 14, no. 14, p. 3254, 2022
work page 2022
-
[29]
Combining gedi and sentinel-2 for wall-to-wall mapping of tall and short crops,
S. Di Tommaso, S. Wang, and D. B. Lobell, “Combining gedi and sentinel-2 for wall-to-wall mapping of tall and short crops,” Environmental Research Letters, vol. 16, no. 12, p. 125002, 2021
work page 2021
-
[30]
Mapping sugarcane globally at 10 m resolution using gedi and sentinel-2,
S. Di Tommaso, S. Wang, R. Strey, and D. B. Lobell, “Mapping sugarcane globally at 10 m resolution using gedi and sentinel-2,” Earth System Science Data Discussions , vol. 2024, pp. 1–26, 2024
work page 2024
-
[31]
A robust method for mapping soybean by phenological aligning of sentinel-2 time series,
X. Huang, A. Vrieling, Y. Dou, M. Belgiu, and A. Nelson, “A robust method for mapping soybean by phenological aligning of sentinel-2 time series,” ISPRS Journal of Photogrammetry and Remote Sensing , vol. 218, pp. 1–18, 2024
work page 2024
-
[32]
Temporal convolutional neural network for the classification of satellite image time series,
C. Pelletier, G. I. Webb, and F. Petitjean, “Temporal convolutional neural network for the classification of satellite image time series,” Remote Sensing, vol. 11, no. 5, p. 523, 2019
work page 2019
-
[33]
Lightweight, pre-trained transformers for remote sensing timeseries,
G. Tseng, R. Cartuyvels, I. Zvonkov, M. Purohit, D. Rolnick, and H. Kerner, “Lightweight, pre-trained transformers for remote sensing timeseries,” arXiv preprint arXiv:2304.14065 , 2023. 28
-
[34]
Global hyperspectral imaging spectral-library of agricultural crops for central asia v001,
I. Mariotto, P. Thenkabail, and I. Aneece, “Global hyperspectral imaging spectral-library of agricultural crops for central asia v001,” NASA Land Processes Distributed Active Archive Center, 2020. [Online]. Available: https://doi.org/10.5067/COMMUNITY/GHISA/GHISACASIA.001
-
[35]
P. Thenkabail and I. Aneece, “Global hyperspectral imaging spectral-library of agricultural crops for conterminous united states v001,” NASA Land Processes Distributed Active Archive Center, 2019. [Online]. Available: https://doi.org/10.5067/COMMUNITY/GHISA/GHISACONUS.001
-
[36]
Deep residual learning for image recognition,
K. He, X. Zhang, S. Ren, and J. Sun, “Deep residual learning for image recognition,” in Proceedings of the IEEE Conference on Computer Vision and Pattern Recognition , 2016, pp. 770–778
work page 2016
-
[37]
Efficientnetv2: Smaller models and faster training,
M. Tan and Q. Le, “Efficientnetv2: Smaller models and faster training,” in International Conference on Machine Learning. PMLR, 2021, pp. 10 096–10 106
work page 2021
-
[38]
Z. Liu, H. Mao, C.-Y. Wu, C. Feichtenhofer, T. Darrell, and S. Xie, “A convnet for the 2020s,” in Proceedings of the IEEE/CVF Conference on Computer Vision and Pattern Recognition , 2022, pp. 11 976–11 986
work page 2022
-
[39]
Cropharvest: A global dataset for crop-type classification,
G. Tseng, I. Zvonkov, C. L. Nakalembe, and H. Kerner, “Cropharvest: A global dataset for crop-type classification,” in 35th Conference on Neural Information Processing Systems Datasets and Benchmarks Track, 2021
work page 2021
-
[40]
K. Van Tricht, J. Degerickx, S. Gilliams, D. Zanaga, M. Battude, A. Grosu, J. Brombacher, M. Lesiv, J. C. L. Bayas, S. Karanamet al., “Worldcereal: a dynamic open-source system for global-scale, seasonal, and reproducible crop and irrigation mapping,” Earth System Science Data , vol. 15, no. 12, pp. 5491– 5515, 2023
work page 2023
-
[41]
Massive soybean expansion in south america since 2000 and implications for conservation,
X.-P. Song, M. C. Hansen, P. Potapov, B. Adusei, J. Pickering, M. Adami, A. Lima, V. Zalles, S. V. Stehman, C. M. Di Bella et al., “Massive soybean expansion in south america since 2000 and implications for conservation,” Nature Sustainability, vol. 4, no. 9, pp. 784–792, 2021
work page 2000
-
[42]
Queensland seasonal crop (qsc) mapping — summer and winter crop classifica- tions,
Queensland Government, “Queensland seasonal crop (qsc) mapping — summer and winter crop classifica- tions,” https://www.qld.gov.au/environment/land/management/mapping/statewide-monitoring/crops, 2023
work page 2023
-
[43]
Detecting the annual areal extent of sugarcane crops in queensland, australia,
M. J. Pringle, “Detecting the annual areal extent of sugarcane crops in queensland, australia,” Remote Sensing Applications: Society and Environment , vol. 22, p. 100496, 2021
work page 2021
-
[44]
Landbouwgebruikspercelen (lgp) — annual crop parcel declarations in belgium,
Flemish Department of Agriculture and Fisheries, “Landbouwgebruikspercelen (lgp) — annual crop parcel declarations in belgium,” https://landbouwcijfers.vlaanderen.be/open-geodata-landbouwgebruik spercelen, 2023
work page 2023
-
[45]
Mapping crop type in northeast china during 2017–2023 (including code for classification),
Q. Li, H. Wang, Y. Zhang, X. Du, Y. Dong, Y. Shen et al. , “Mapping crop type in northeast china during 2017–2023 (including code for classification),” figshare. Dataset, 2024. [Online]. Available: https://doi.org/10.6084/m9.figshare.25346038.v1
-
[46]
Registre parcellaire graphique (rpg) — annual agricultural parcel database of france,
Agence de Services et de Paiement, “Registre parcellaire graphique (rpg) — annual agricultural parcel database of france,” https://geoservices.ign.fr/rpg, 2023
work page 2023
-
[47]
Netherlands Enterprise Agency, “Basisregistratie gewaspercelen (brp) — annual agricultural parcel and crop type register of the netherlands,” https://service.pdok.nl/rvo/brpgewaspercelen/atom/v1 0/basis registratie gewaspercelen brp.xml, 2023
work page 2023
-
[48]
Esa worldcover 10 m 2021 v200,
D. Zanaga, R. Van De Kerchove, D. Daems et al. , “Esa worldcover 10 m 2021 v200,” 2022. [Online]. Available: https://doi.org/10.5281/zenodo.7254221 29
-
[49]
Monitoring vegetation systems in the great plains with erts,
J. W. Rouse, R. H. Haas, J. A. Schell, and D. W. Deering, “Monitoring vegetation systems in the great plains with erts,” in Third Earth Resources Technology Satellite-1 Symposium, ser. NASA Special Publication, vol. SP-351. Washington, D.C.: NASA, 1973, pp. 309–317
work page 1973
-
[50]
T. Nguyen, M. Raghu, and S. Kornblith, “Do wide and deep networks learn the same things? uncovering how neural network representations vary with width and depth,”arXiv preprint arXiv:2010.15327, 2020
-
[51]
A closer look at memorization in deep networks,
D. Arpit, S. Jastrzebski, N. Ballas, D. Krueger, E. Bengio, M. S. Kanwal, T. Maharaj, A. Fischer, A. Courville, Y. Bengio et al. , “A closer look at memorization in deep networks,” in International Conference on Machine Learning. PMLR, 2017, pp. 233–242
work page 2017
-
[52]
Remote estimation of canopy chlorophyll content in crops,
A. A. Gitelson, A. Vi˜ na, V. Ciganda, D. C. Rundquist, and T. J. Arkebauer, “Remote estimation of canopy chlorophyll content in crops,” Geophysical Research Letters, vol. 32, no. 8, 2005
work page 2005
-
[53]
An empirical survey of data augmentation for time series classification with neural networks,
B. K. Iwana and S. Uchida, “An empirical survey of data augmentation for time series classification with neural networks,” Plos One, vol. 16, no. 7, p. e0254841, 2021
work page 2021
-
[54]
Generating synthetic time series to augment sparse datasets,
G. Forestier, F. Petitjean, H. A. Dau, G. I. Webb, and E. Keogh, “Generating synthetic time series to augment sparse datasets,” in 2017 IEEE International Conference on Data Mining . IEEE, 2017, pp. 865–870
work page 2017
-
[55]
Time series data augmentation for neural networks by time warping with a discriminative teacher,
B. K. Iwana and S. Uchida, “Time series data augmentation for neural networks by time warping with a discriminative teacher,” in 25th International Conference on Pattern Recognition . IEEE, 2021, pp. 3558–3565
work page 2021
-
[56]
Efficient object localization using convo- lutional networks,
J. Tompson, R. Goroshin, A. Jain, Y. LeCun, and C. Bregler, “Efficient object localization using convo- lutional networks,” in Proceedings of the IEEE Conference on Computer Vision and Pattern Recognition, 2015, pp. 648–656
work page 2015
-
[57]
Learning deep features for discriminative localization,
B. Zhou, A. Khosla, A. Lapedriza, A. Oliva, and A. Torralba, “Learning deep features for discriminative localization,” in Proceedings of the IEEE Conference on Computer Vision and Pattern Recognition, 2016, pp. 2921–2929
work page 2016
-
[58]
L. v. d. Maaten and G. Hinton, “Visualizing data using t-sne,” Journal of Machine Learning Research , vol. 9, no. Nov, pp. 2579–2605, 2008
work page 2008
-
[59]
J. Sarron, D. Beillouin, J. Huat, J.-M. Koffi, J. Diatta, ´E. Mal´ ezieux, and E. Faye, “Digital agriculture to fulfil the shortage of horticultural data and achieve food security in sub-saharan africa,” in IV All Africa Horticultural Congress-AAHC 2021: Transformative Innovations in Horticulture , 2021, pp. 239–246
work page 2021
-
[60]
Harveststat africa–harmonized subnational crop statistics for sub-saharan africa,
D. Lee, W. Anderson, X. Chen, F. Davenport, S. Shukla, R. Sahajpal, M. Budde, J. Rowland, J. Verdin, L. You et al., “Harveststat africa–harmonized subnational crop statistics for sub-saharan africa,” Scien- tific Data, vol. 12, no. 1, p. 690, 2025
work page 2025
-
[61]
Weakly supervised deep learning for segmentation of remote sensing imagery,
S. Wang, W. Chen, S. M. Xie, G. Azzari, and D. B. Lobell, “Weakly supervised deep learning for segmentation of remote sensing imagery,” Remote Sensing, vol. 12, no. 2, p. 207, 2020
work page 2020
-
[62]
Global high categorical resolution land cover mapping via weak supervision,
X.-Y. Tong, R. Dong, and X. X. Zhu, “Global high categorical resolution land cover mapping via weak supervision,” ISPRS Journal of Photogrammetry and Remote Sensing , vol. 220, pp. 535–549, 2025
work page 2025
-
[63]
Semi-supervised learning using gaussian fields and harmonic functions,
X. Zhu, Z. Ghahramani, and J. D. Lafferty, “Semi-supervised learning using gaussian fields and harmonic functions,” in Proceedings of the 20th International Conference on Machine Learning, 2003, pp. 912–919
work page 2003
-
[64]
Posterior regularization for structured latent variable models,
K. Ganchev, J. Gra¸ ca, J. Gillenwater, and B. Taskar, “Posterior regularization for structured latent variable models,” The Journal of Machine Learning Research , vol. 11, pp. 2001–2049, 2010. 30
work page 2001
discussion (0)
Sign in with ORCID, Apple, or X to comment. Anyone can read and Pith papers without signing in.