REVIEW 1 major objections 5 minor 32 references
The atomic gas properties of Green Pea galaxies: Connections to Lyman continuum leakage
T0 review · 1 major / 5 minor · reviewed 2026-08-15 · deepseek-v4-flash
Pith's one-line read Green Pea galaxies with high O32 ratios have largely consumed their neutral hydrogen, and this gas loss is what lets their ionizing light escape.
desk verdict A careful new HI survey shows a sharp O32 dichotomy in Green Pea HI content, but the paper's own beam-contamination caveat means the LyC-leakage explanation is not established. read the letter →
The pith
A machine-rendered reading of the paper's core claim, the machinery that carries it, and where it could break.
The reading
What carries the argument
The load-bearing object is the extinction-corrected line ratio $O_{32} = [\mathrm{O\,III}]\lambda5007+\lambda4959 / [\mathrm{O\,II}]\lambda3727,3729$, used with a threshold of 10 as a proxy for Lyman continuum escape; the threshold comes from external calibration showing that more than half of galaxies with $O_{32}\gtrsim10$ leak LyC, while fewer than about 20% below it do. The measurement side is single-dish H I 21 cm emission, which gives H I masses via the standard luminosity-distance relation, with survival analysis (Kaplan-Meier means and Peto-Prentice two-sample tests, with Monte Carlo error propagation) handling the many upper limits. The physical mechanism invoked is the density-bounded H II region: high $O_{32}$ means the ionized region ends where the gas runs out rather than where the photons run out, so ionizing photons escape and little neutral gas remains.
What would settle it
Resolved 21 cm mapping of the high-$O_{32}$ Green Peas would settle the gas-paucity claim: if interferometric observations reveal substantial neutral hydrogen in the galaxies or in companions, the low single-dish detection rate would reflect beam dilution or merger stage rather than exhausted gas. Alternatively, direct Lyman continuum measurements of Green Peas at $z\approx0.3$, where LyC can be observed, could test whether the $O_{32}>10$ subsample really has the high escape fractions assumed by the threshold.
Extended reading notes
Core claim
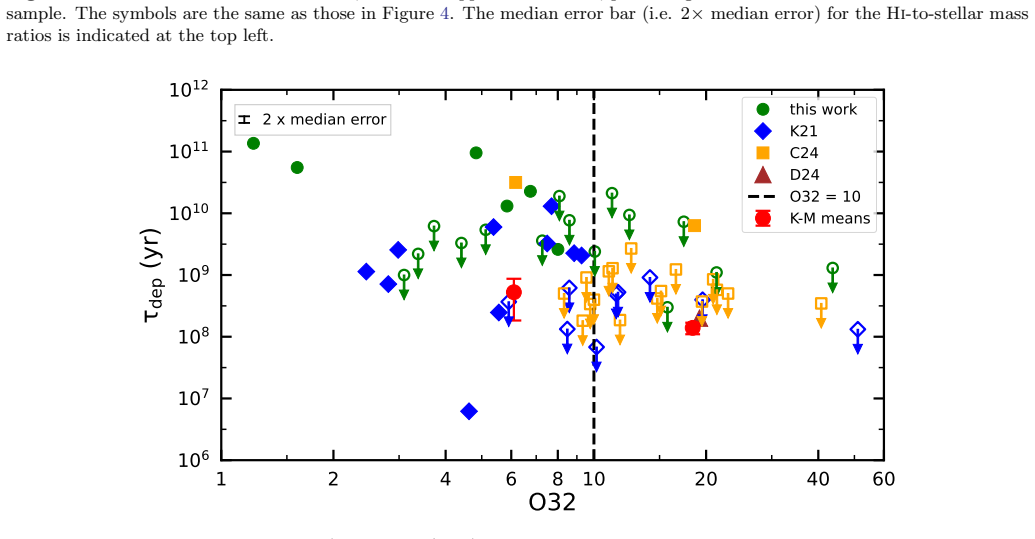
On the paper's own terms, the discovery is a statistical dichotomy: Green Pea galaxies above $O_{32}=10$ are almost never seen in H I 21 cm (2 of 28 systems, one tentative), while those below the threshold are frequently detected (17 of 32), with the Kaplan-Meier mean H I mass a factor of about six higher in the low-$O_{32}$ group. Because the two subsamples have matching stellar masses and star formation rates, the difference is attributed to the gas: high-$O_{32}$ galaxies have consumed most of their neutral hydrogen, shortening their depletion timescales by a factor of about four. The paper takes this as the direct explanation for Lyman continuum leakage in these galaxies, and as evidence that the reionization-era analogs of Green Peas would be gas-poor, producing an anti-correlation between H I 21 cm and Ly$\alpha$ emission at $z\gtrsim6$.
Load-bearing premise
The argument stands or falls on whether $O_{32}>10$ really marks Lyman continuum escape in Green Pea galaxies, since no direct LyC measurement is possible at these redshifts; it also assumes that the single-dish 21 cm detections belong to the target galaxies rather than to merging companions in beams spanning 180 to 550 kpc.
Editorial extensions
If this is right
- High-$O_{32}$ Green Peas are detected in H I 21 cm in only about 7% of cases, against about 53% for low-$O_{32}$ galaxies, so gas paucity is a statistical property of likely LyC leakers.
- The H I mass, H I-to-stellar mass ratio, and H I depletion timescale are all lower in the $O_{32}>10$ group at roughly 3.2-3.7 sigma, with matched stellar properties, so the effect is specific to the atomic gas.
- Because density-bounded H II regions let ionizing photons escape once the neutral gas is consumed, low H I content is presented as the immediate cause of Lyman continuum leakage in these galaxies.
- If the same applies at $z\gtrsim6$, searches for 21 cm emission from the epoch of reionization should find a spatial anti-correlation between H I 21 cm and Ly$\alpha$ emission.
- Some of the low-$O_{32}$ detections may be companions rather than the Green Pea itself, so the true H I content of the galaxies could be even lower than the single-dish numbers suggest.
Reading between the lines
- A direct test of the merger interpretation the paper leaves open: compare optical morphologies of high- and low-$O_{32}$ Green Peas; if the high-$O_{32}$ objects show late-stage merger features, the gas difference may track merger phase rather than internal exhaustion.
- The predicted 21 cm / Ly$\alpha$ anti-correlation at $z>6$ could be checked with current-generation interferometers by stacking 21 cm spectra toward faint Ly$\alpha$ emitters, where a deficit relative to field averages would support gas-poor leakers.
- If the $O_{32}$-H I relation extends to lower stellar masses, the $O_{32}=10$ threshold may mark a universal gas-exhaustion state for dwarf starbursts, offering a redshift-independent way to identify galaxies near the end of their reionization-contributing phase.
- Because the paper's sample is limited to $z<0.05$, extending H I stacking to slightly higher redshift Green Peas would test whether the detection-rate gap persists at larger distances, separating a real gas dichotomy from a sensitivity effect.
Signed reviews
Editorial analysis
A structured set of objections, weighed in public.
Referee Report
Summary. The paper reports a new 193-hour Green Bank Telescope HI 21 cm emission survey of 30 Green Pea galaxies (GPs) at z≈0.012–0.045, yielding 7 detections and 17 upper limits. Combining these with literature measurements gives a sample of 60 GPs at z<0.05 with 19 detections and 41 non-detections. Using the extinction-corrected line ratio O32 ≡ [OIII]λ5007+λ4959/[OII]λ3727,3729 with a threshold of 10 as an indicator of Lyman continuum (LyC) leakage, the authors compare the HI mass, HI-to-stellar mass ratio, and HI depletion timescale between the O32<10 and O32>10 subsamples. Survival analysis with Peto-Prentice tests and Monte Carlo error propagation finds that the two subsamples differ at about 3.3–3.7σ significance, with high-O32 GPs having lower HI content, lower HI-to-stellar mass ratios, and shorter HI depletion timescales. The paper interprets this as evidence that HI paucity causes LyC leakage in GPs and predicts a spatial anti-correlation between HI 21 cm and Lyα emission at z≳6.
Significance. If the central claim holds, this is a valuable observational step connecting the neutral gas content of low-redshift LyC-leaking analogs to the escape of ionizing photons. The paper's strengths include a substantial new GBT data set, an appropriately chosen survival-analysis framework for censored HI measurements, Monte Carlo treatment of measurement errors, and an unusually explicit discussion of caveats, especially the single-dish beam-confusion problem. The reported differences are significant in a statistical sense, and the comparison of stellar mass and SFR distributions between the two O32 subsamples is a useful control. However, the physical conclusion that HI paucity is the cause of LyC leakage rests on two load-bearing assumptions that are not established within the paper: (1) that O32>10 reliably identifies LyC leakers in this population, and (2) that the measured single-dish HI emission is associated with the GP itself rather than with merging companions.
major comments (1)
- [Section 3, first paragraph; Section 4] The significance of the survival analysis depends on the assumption that the censoring mechanism (upper limits) is comparable between the two O32 subsamples and across the three single-dish telescopes. The paper asserts that restricting to z<0.05 ensures 'similar sensitivity,' but the upper limits in Table 1 span a wide range (e.g., M_HI upper limits from <0.5×10^8 to <5.5×10^8 M⊙), and the telescopes have different beam sizes, system temperatures, and RFI environments. If the high-O32 subsample is preferentially observed with less sensitive data or at larger distances, the detection-rate difference could be partly a sensitivity artifact. In addition, the assumed Gaussian FWHM of 50 km/s for non-detections is a free parameter; the detected HI lines in Table 1 have W50 values of 40–140 km/s, so a different assumed FWHM could change the upper limits and hence the Kaplan-Meier means and test significances. Please provide a quantitative comparison of the upper-limit distributions, distances, and RMS sensitivities of the two subsamples, and test the sensitivity of the Peto-Prentice results to the assumed FWHM (e.g., 50, 100, and 150 km/s).
minor comments (5)
- [Table 1 caption] The column list in the caption contains a numbering error: column (9) is listed twice (absolute B-band magnitude and O32), and the FWHM column for HI detections is not assigned a number. Please fix the column numbering.
- [Abstract] The phrase 'Earlier studies have shown that galaxies with O32>10 tend to show significant LyC leakage: our results indicate that this is due to the lack of HI' should be phrased conditionally, because the paper does not measure LyC escape in this sample; recommend 'if O32 traces LyC leakage, our results suggest...'.
- [Section 2, Figure 1] The velocity axis range in the third panel of Figure 1 (±1000 km/s relative to redshift) is inconsistent with the other panels, which use ±400 km/s. Please unify the velocity ranges or explain the difference.
- [Section 2, J0840+5333] For J0840+5333, the HI emission is offset by ≈−100 km/s from the optical redshift, and the text notes it may arise from a companion. This object is counted as a detection; please flag it clearly in Table 1 or Figure 1 so that readers can identify potentially contaminated detections.
- [Section 4] There is a typo in the Summary: 'GPs wih O32 > 10' should be 'GPs with O32 > 10'.
Circularity Check
No significant circularity: the HI measurements are directly observed and compared against an externally calibrated O32 threshold.
full rationale
The paper's central comparison is an empirical one: HI 21 cm detections and upper limits for 60 GPs are split by an O32 threshold, and survival analysis is used to compare the HI mass, HI-to-stellar mass ratio, and HI depletion timescale between the two subsamples. No parameter is fitted to the HI data and then renamed a prediction; the HI masses come from new GBT observations and published independent surveys. The O32 > 10 criterion for likely LyC leakage is adopted from the external LzLCS calibration of Flury et al. (2022), not derived from the present paper's own results, and the paper explicitly notes that direct LyC measurements are impossible at these redshifts. Citations to Kanekar et al. (2021), Chandola et al. (2024), and Purkayastha et al. (2022, 2024) supply the literature HI data and resolved HI maps; these are self-citations for some authors, but they are independent observational measurements, not unverified assertions that themselves assume the conclusion. The final caveat that large single-dish beams may include merging companions is a threat to the astrophysical interpretation, but it is an alternate explanation acknowledged by the authors, not a circular reduction of the claimed result to its inputs. No equation equates M_HI, f_HI, or tau_dep with O32 by construction, and no load-bearing step reduces to a self-citation chain. The paper is therefore self-contained with respect to its empirical HI versus O32 comparison, and the circularity score is 0.
Assumptions & free parameters
free parameters (2)
- Assumed HI line FWHM for non-detections =
50 km/s
- Assumed stellar mass uncertainty =
0.3 dex
assumptions (5)
- domain assumption O32 > 10 is a reliable indicator of significant LyC leakage in the GP sample
- domain assumption Detected single-dish HI 21 cm emission is associated with the target GP rather than a companion
- domain assumption Restricting to z<0.05 and M*=1e6 to 1e9 Msun makes the HI searches comparably sensitive across surveys
- domain assumption Stellar masses and SFRs from Jiang et al. (2019) and Yang et al. (2017) are accurate
- standard math Peto-Prentice two-sample test and Kaplan-Meier estimator correctly handle censored HI data
Cite this review
Pith. "Pith review of The atomic gas properties of Green Pea galaxies: Connections to Lyman continuum leakage." pith.science (2026). https://pith.science/paper/Z5X5Z2D5
@misc{pith2026250904567,
  author       = {Pith},
  title        = {Pith review of: The atomic gas properties of Green Pea galaxies: Connections to Lyman continuum leakage},
  year         = {2026},
  howpublished = {\url{https://pith.science/paper/Z5X5Z2D5}},
  note         = {Machine review of arXiv:2509.04567}
}
abstract
We have used the Green Bank Telescope to search for H{\sc{i}} 21\,cm emission from 30 Green Pea galaxies (GPs) at $z\approx0.012-0.045$, obtaining 7 detections of H{\sc{i}} 21\,cm emission and 17 upper limits on the H{\sc{i}} mass. Including GPs from the literature, we obtain a sample of 60 GPs at $z<0.05$, with 19 detections and 41 non-detections of H{\sc{i}} 21\,cm emission, and with stellar masses in the range $10^6-10^9\,\rm{M_{\odot}}$. We use the line luminosity ratio O32~$\equiv$~[O{\sc iii}]$\lambda 5007+\lambda 4959$/[O{\sc ii}]$\lambda$3727,3729 as an indicator of Lyman continuum (LyC) leakage, and examine the dependence of the H{\sc{i}} properties of the 60 GPs on the O32 ratio. We obtain a far higher H{\sc{i}} 21\,cm detection rate ($\approx53^{+16}_{-13}$\%) for the 32 GPs with O32~$<10$ than that ($7.1^{+9.4}_{-4.6}$\%) for the 28 GPs with O32~$>10$. We find statistically significant evidence that the H{\sc{i}} mass, the H{\sc{i}}-to-stellar mass ratio, and the H{\sc{i}} gas depletion timescale of GPs with O32~$>10$ are lower than the corresponding values for GPs with O32~$<10$. Earlier studies have shown that galaxies with O32~$>10$ tend to show significant LyC leakage: our results indicate that this is due to the lack of H{\sc{i}} in such galaxies, with most of the H{\sc{i}} consumed in the starburst. Our results further suggest that H{\sc{i}} 21\,cm studies of the galaxies that reionized the Universe at $z\gtrsim6$ are likely to find an anti-correlation between the H{\sc{i}} 21\,cm and Ly$\alpha$ emission signals, due to the paucity of H{\sc{i}} in the strongest LyC and Ly$\alpha$ leakers.
Figures


Figures from the paper (3 more)


Reference graph
Works this paper leans on
-
[1]
Abdurashidova, Z., Aguirre, J. E., Alexander, P., et al. 2022, ApJ, 925, 221, doi: 10.3847/1538-4357/ac1c78
-
[2]
2009, MNRAS, 399, 1191, doi: 10.1111/j.1365-2966.2009.15383.x
Cardamone, C., Schawinski, K., Sarzi, M., et al. 2009, MNRAS, 399, 1191, doi: 10.1111/j.1365-2966.2009.15383.x
arXiv 2009
-
[3]
Chandola, Y., Tsai, C.-W., Saikia, D. J., et al. 2024, ApJL, 977, L8, doi: 10.3847/2041-8213/ad901c
-
[4]
2022, MNRAS, 517, 5104, doi: 10.1093/mnras/stac2874
Chisholm, J., Saldana-Lopez, A., Flury, S., et al. 2022, MNRAS, 517, 5104, doi: 10.1093/mnras/stac2874
-
[5]
2024, MNRAS, 531, 5140, doi: 10.1093/mnras/stae1490
Dutta, S., Bera, A., Bait, O., et al. 2024, MNRAS, 531, 5140, doi: 10.1093/mnras/stae1490
-
[6]
Fan, X., Carilli, C. L., & Keating, B. 2006, ARA&A, 44, 415, doi: 10.1146/annurev.astro.44.051905.092514
arXiv 2006
-
[7]
Feigelson, E. D., & Nelson, P. I. 1985, ApJ, 293, 192, doi: 10.1086/163225
doi:10.1086/163225 1985
-
[8]
Flury, S. R., Jaskot, A. E., Ferguson, H. C., et al. 2022, ApJS, 260, 1, doi: 10.3847/1538-4365/ac5331
Show all 32 references
-
[9]
1986, ApJ, 303, 336, doi: 10.1086/164079
Gehrels, N. 1986, ApJ, 303, 336, doi: 10.1086/164079
1986 doi
-
[10]
L., & Erb, D
Henry, A., Scarlata, C., Martin, C. L., & Erb, D. 2015, ApJ, 809, 19, doi: 10.1088/0004-637X/809/1/19
2015 doi
-
[11]
D., & Nelson, P
Isobe, T., Feigelson, E. D., & Nelson, P. I. 1986, ApJ, 306, 490, doi: 10.1086/164359
1986 doi
-
[12]
I., Schaerer, D., Thuan, T
Izotov, Y. I., Schaerer, D., Thuan, T. X., et al. 2016, MNRAS, 461, 3683, doi: 10.1093/mnras/stw1205
2016 doi
-
[13]
I., Schaerer, D., Worseck, G., et al
Izotov, Y. I., Schaerer, D., Worseck, G., et al. 2017, MNRAS, 474, 4514, doi: 10.1093/mnras/stx3115
2017 doi
-
[14]
I., Schaerer, D., Worseck, G., et al
Izotov, Y. I., Schaerer, D., Worseck, G., et al. 2020, MNRAS, 491, 468, doi: 10.1093/mnras/stz3041
2020 doi
-
[15]
I., Worseck, G., Schaerer, D., et al
Izotov, Y. I., Worseck, G., Schaerer, D., et al. 2018, MNRAS, 478, 4851, doi: 10.1093/mnras/sty1378
2018 doi
-
[16]
2019, ApJ, 885, 96, doi: 10.3847/1538-4357/ab3d3b
McKinney, J. 2019, ApJ, 885, 96, doi: 10.3847/1538-4357/ab3d3b
2019 doi
-
[17]
E., & Oey, M
Jaskot, A. E., & Oey, M. S. 2013, ApJ, 766, 91, doi: 10.1088/0004-637X/766/2/91
2013 doi
-
[18]
E., Silveyra, A
Jaskot, A. E., Silveyra, A. C., Plantinga, A., et al. 2024, ApJ, 972, 92, doi: 10.3847/1538-4357/ad58b9
2024 doi
-
[19]
Jiang, T., Malhotra, S., Yang, H., & Rhoads, J. E. 2019, ApJ, 872, 146, doi: 10.3847/1538-4357/aaee79
2019 doi
-
[20]
2021, ApJL, 913, L15, doi: 10.3847/2041-8213/abfb76
Kanekar, N., Ghosh, T., Rhoads, J., et al. 2021, ApJL, 913, L15, doi: 10.3847/2041-8213/abfb76
2021 doi
-
[21]
C., Jacobs, D
Kolopanis, M., Pober, J. C., Jacobs, D. C., & McGraw, S. 2023, MNRAS, 521, 5120, doi: 10.1093/mnras/stad845
2023 doi
-
[22]
2024, A&A, 691, A59, doi: 10.1051/0004-6361/202449904
Llerena, M., Amor´ ın, R., Pentericci, L., et al. 2024, A&A, 691, A59, doi: 10.1051/0004-6361/202449904
2024 doi
-
[23]
E., Finkelstein, S
Malhotra, S., Rhoads, J. E., Finkelstein, S. L., et al. 2012, ApJL, 750, L36, doi: 10.1088/2041-8205/750/2/L36
2012 doi
-
[24]
W., Braatz, J
Marganian, P., Garwood, R. W., Braatz, J. A., Radziwill, N. M., & Maddalena, R. J. 2006, in Astronomical Society of the Pacific Conference Series, Vol. 351, Astronomical Data Analysis Software and Systems XV, ed. C. Gabriel, C. Arviset, D. Ponz, & S. Enrique, 512
2006
- [25]
-
[26]
2014, MNRAS, 442, 900, doi: 10.1093/mnras/stu902
Nakajima, K., & Ouchi, M. 2014, MNRAS, 442, 900, doi: 10.1093/mnras/stu902
2014 doi
-
[27]
2013, ApJ, 769, 3, doi: 10.1088/0004-637X/769/1/3 Planck Collaboration
Nakajima, K., Ouchi, M., Shimasaku, K., et al. 2013, ApJ, 769, 3, doi: 10.1088/0004-637X/769/1/3 Planck Collaboration. 2020, A&A, 641, A6, doi: 10.1051/0004-6361/201833910
2013 doi
-
[28]
N., et al
Purkayastha, S., Kanekar, N., Chengalur, J. N., et al. 2022, ApJL, 933, L11, doi: 10.3847/2041-8213/ac7522
2022 doi
-
[29]
2024, ApJ, 977, 68, doi: 10.3847/1538-4357/ad8dd2
Purkayastha, S., Kanekar, N., Kumari, S., et al. 2024, ApJ, 977, 68, doi: 10.3847/1538-4357/ad8dd2
2024 doi
-
[30]
E., Wold, I
Rhoads, J. E., Wold, I. G. B., Harish, S., et al. 2023, ApJL, 942, L14, doi: 10.3847/2041-8213/acaaaf 11
2023 doi
-
[31]
2016, ApJ, 820, 130, doi: 10.3847/0004-637X/820/2/130
Yang, H., Malhotra, S., Gronke, M., et al. 2016, ApJ, 820, 130, doi: 10.3847/0004-637X/820/2/130
2016 doi
-
[32]
2017, ApJ, 844, 171, doi: 10.3847/1538-4357/aa7d4d
Yang, H., Malhotra, S., Gronke, M., et al. 2017, ApJ, 844, 171, doi: 10.3847/1538-4357/aa7d4d
2017 doi
Reviewed August 15, 2026 · model on record in the stance chip above.
Discussion (0). Continue with ORCID to comment.