Predicting parameters of a model cuprate superconductor using machine learning
Pith reviewed 2026-05-17 01:47 UTC · model grok-4.3
The pith
An adapted U-Net model trained on mean-field phase diagrams accurately predicts Hamiltonian parameters for a cuprate superconductor when validated on Monte Carlo simulation data.
A machine-rendered reading of the paper's core claim, the machinery that carries it, and where it could break.
Core claim
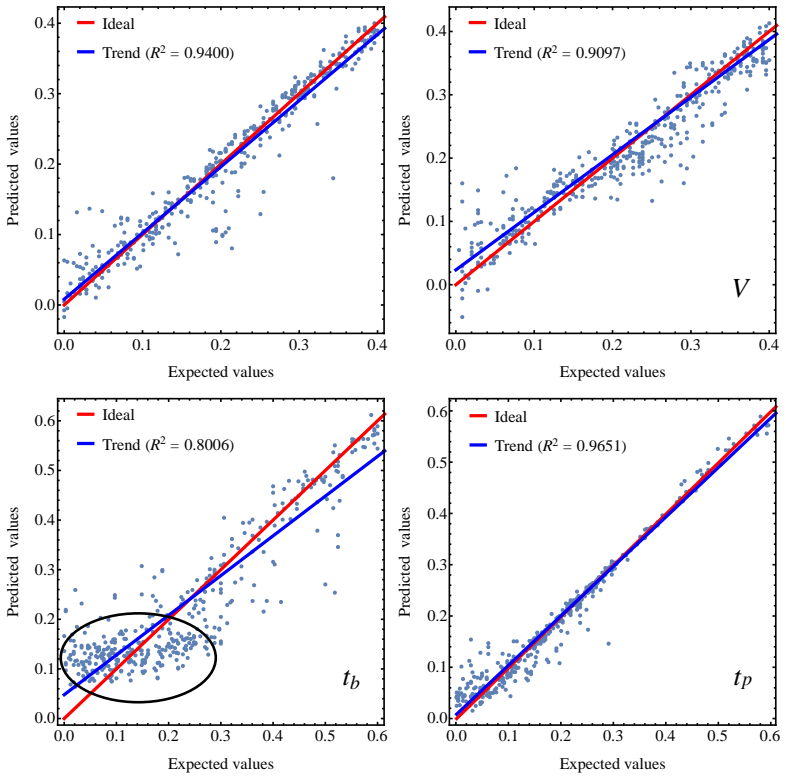
It is shown that the model accurately predicts all considered Hamiltonian parameters, and areas of low prediction accuracy correspond to regions of parametric insensitivity in the phase diagrams.
Load-bearing premise
The phase diagrams generated within the mean-field approximation contain sufficient structural information for a neural network trained on them to generalize accurately to phase diagrams produced by semi-classical heat bath Monte Carlo simulations.
Figures


read the original abstract
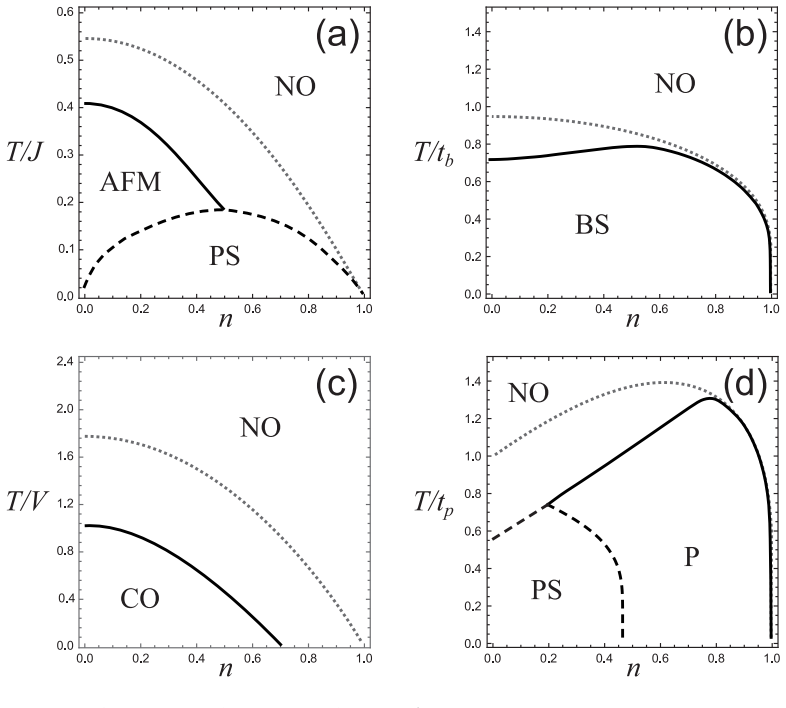
The computational complexity of calculating phase diagrams for multi-parameter models significantly limits the ability to select parameters that correspond to experimental data. This work presents a machine learning method for solving the inverse problem - forecasting the parameters of a model Hamiltonian for a cuprate superconductor based on its phase diagram. A comparative study of three deep learning architectures was conducted: VGG, ResNet, and U-Net. The latter was adapted for regression tasks and demonstrated the best performance. Training the U-Net model was performed on an extensive dataset of phase diagrams calculated within the mean-field approximation, followed by validation on data obtained using a semi-classical heat bath algorithm for Monte Carlo simulations. It is shown that the model accurately predicts all considered Hamiltonian parameters, and areas of low prediction accuracy correspond to regions of parametric insensitivity in the phase diagrams. This allows for the extraction of physically interpretable patterns and validation of the significance of parameters for the system. The results confirm the promising potential of applying machine learning to analyze complex physical models in condensed matter physics.
Editorial analysis
A structured set of objections, weighed in public.
Referee Report
Summary. The manuscript presents a machine-learning approach to the inverse problem of recovering Hamiltonian parameters for a model cuprate superconductor from its phase diagram. A U-Net architecture adapted for regression is trained on an extensive set of phase diagrams generated in the mean-field approximation and then validated on diagrams produced by semi-classical heat-bath Monte Carlo simulations. The central claim is that the trained model accurately recovers all considered parameters and that regions of lower prediction accuracy coincide with physically insensitive regions of the phase diagram.
Significance. If the reported generalization from mean-field training data to Monte Carlo validation data holds with quantitative fidelity, the method would offer a practical route to rapid parameter estimation for multi-parameter models whose direct fitting is computationally prohibitive. The explicit linkage of prediction error to parametric insensitivity is a positive feature that could aid physical interpretation. However, the absence of side-by-side quantitative metrics comparing mean-field and Monte Carlo diagrams leaves the transferability assumption untested, limiting the immediate impact.
major comments (3)
- [Abstract / Results] The abstract and strongest claim assert that the U-Net 'accurately predicts all considered Hamiltonian parameters' on Monte Carlo validation data, yet no numerical performance measures (RMSE, MAE, or correlation coefficients) or dataset sizes are supplied. Without these, it is impossible to judge whether the accuracy is sufficient to support the inverse-problem application.
- [Methods / Validation procedure] The central generalization step—training exclusively on mean-field phase diagrams and validating on semi-classical Monte Carlo diagrams—rests on an unverified assumption of structural similarity. Mean-field theory suppresses fluctuations that shift transition lines and alter the topology of ordered regions; no pixel-wise discrepancy, order-parameter profile comparison, or feature-alignment metric between the two classes of diagrams is reported. This directly affects the load-bearing claim that the network recovers physically meaningful parameters.
- [Results / Discussion] The statement that low-accuracy regions 'correspond to regions of parametric insensitivity' is presented as a physical insight, but the manuscript does not show an explicit sensitivity analysis (e.g., finite-difference derivatives of the phase diagram with respect to each Hamiltonian parameter) that would independently confirm this correspondence.
minor comments (2)
- [Model Hamiltonian] Notation for the Hamiltonian parameters and the precise definition of the order parameters used to construct the phase diagrams should be stated explicitly in the main text rather than deferred to supplementary material.
- [Figures] Figure captions should include the number of training/validation samples and the precise Monte Carlo parameters (lattice size, number of sweeps, etc.) so that reproducibility is immediate.
Simulated Author's Rebuttal
We thank the referee for the constructive and detailed comments. These have helped us identify areas where additional quantitative support and clarification will strengthen the manuscript. We address each major comment below and will make the indicated revisions.
read point-by-point responses
-
Referee: [Abstract / Results] The abstract and strongest claim assert that the U-Net 'accurately predicts all considered Hamiltonian parameters' on Monte Carlo validation data, yet no numerical performance measures (RMSE, MAE, or correlation coefficients) or dataset sizes are supplied. Without these, it is impossible to judge whether the accuracy is sufficient to support the inverse-problem application.
Authors: We agree that explicit numerical metrics are necessary to allow readers to evaluate the claimed accuracy. In the revised manuscript we will report RMSE, MAE, and Pearson correlation coefficients for each predicted Hamiltonian parameter on the Monte Carlo validation set. We will also state the sizes of the mean-field training set and the Monte Carlo validation set. These values will be added to the Results section and referenced concisely in the abstract. revision: yes
-
Referee: [Methods / Validation procedure] The central generalization step—training exclusively on mean-field phase diagrams and validating on semi-classical Monte Carlo diagrams—rests on an unverified assumption of structural similarity. Mean-field theory suppresses fluctuations that shift transition lines and alter the topology of ordered regions; no pixel-wise discrepancy, order-parameter profile comparison, or feature-alignment metric between the two classes of diagrams is reported. This directly affects the load-bearing claim that the network recovers physically meaningful parameters.
Authors: We acknowledge that a direct quantitative comparison would make the transferability assumption more transparent. The fact that the model recovers parameters accurately on Monte Carlo data already supplies indirect support for sufficient structural overlap, yet we agree this is not a substitute for explicit metrics. In the revision we will add a short subsection presenting pixel-wise discrepancy maps and order-parameter profile comparisons between representative mean-field and Monte Carlo diagrams, thereby documenting the degree of similarity that enables successful generalization. revision: yes
-
Referee: [Results / Discussion] The statement that low-accuracy regions 'correspond to regions of parametric insensitivity' is presented as a physical insight, but the manuscript does not show an explicit sensitivity analysis (e.g., finite-difference derivatives of the phase diagram with respect to each Hamiltonian parameter) that would independently confirm this correspondence.
Authors: We accept that an explicit sensitivity analysis would provide independent confirmation of the claimed correspondence. In the revised manuscript we will include a finite-difference sensitivity study: for each Hamiltonian parameter we will compute the change in selected phase-diagram features (transition temperatures, ordered-region areas) under small parameter perturbations and overlay the resulting sensitivity maps with the observed prediction-error maps. This analysis will be presented in the Discussion to substantiate the physical interpretation. revision: yes
Circularity Check
No circularity: ML inversion trained on mean-field diagrams and validated on independent Monte Carlo diagrams
full rationale
The paper generates phase diagrams under the mean-field approximation to train the U-Net regressor and then tests recovery of the same Hamiltonian parameters on diagrams produced by a separate semi-classical heat-bath Monte Carlo algorithm. This constitutes an external benchmark rather than a self-referential fit. No equation or claim reduces a predicted parameter to a quantity defined inside the training set, no self-citation supplies a load-bearing uniqueness theorem, and no ansatz is smuggled through prior work. The reported accuracy and the correspondence between low-accuracy regions and parametric insensitivity are therefore independent of the training data by construction.
Axiom & Free-Parameter Ledger
axioms (2)
- domain assumption Phase diagrams computed in the mean-field approximation contain sufficient information to train a model that predicts parameters accurately for more precise simulations.
- domain assumption The relationship between Hamiltonian parameters and phase diagram features is learnable by the neural network architecture.
Reference graph
Works this paper leans on
-
[1]
A. S. Moskvin, True charge-transfer gap in parent insu- lating cuprates, Physical Review B 84 (7) (2011) 075116. doi:10.1103/PhysRevB.84.075116
-
[2]
doi:10.1088/0953-8984/25/8/085601
A.Moskvin, Perspectivesofdisproportionationdrivensuperconductivity in strongly correlated 3d compounds, Journal of Physics: Condensed Matter 25 (8) (2013) 085601. doi:10.1088/0953-8984/25/8/085601
-
[3]
A. Moskvin, Y. Panov, Model of charge triplets for high-Tc cuprates, Journal of Magnetism and Magnetic Materials 550 (2022) 169004. doi:10.1016/j.jmmm.2021.169004
-
[4]
Y. D. Panov, Critical Temperatures of a Model Cuprate, Physics of Metals and Metallography 120 (13) (2019) 1276–1281. doi:10.1134/S0031918X19130222
-
[5]
A. S. Moskvin, Y. D. Panov, Nature of the Pseudogap Phase of HTSC Cuprates, Physics of the Solid State 62 (9) (2020) 1554–1561. doi:10.1134/S1063783420090206
-
[6]
A. Moskvin, Y. Panov, Effective-Field Theory for Model High-Tc Cuprates, Condensed Matter 6 (3) (2021) 24. doi:10.3390/condmat6030024. 18
-
[7]
Y. D. Panov, A. S. Moskvin, A. A. Chikov, V. A. Ulitko, Monte carlo simulation of a model cuprate, Journal of Physics: Conference Series 2043 (1) (2021) 012007. doi:10.1088/1742-6596/2043/1/012007
-
[8]
V. Ulitko, Y. D. Panov, A. Moskvin, Classical monte carlo algorithm for simulation of a pseudospin model for cuprates, arXiv preprint arXiv:2301.11708 (2023). doi:10.48550/arXiv.2301.11708
-
[9]
J. Lund, H. Wang, R. Braatz, R. García, Machine learning of phase diagrams, Materials Advances 3 (23) (2022) 8485–8497. doi:10.1039/D2MA00524G
-
[10]
C. Casert, T. Vieijra, J. Nys, J. Ryckebusch, Interpretable ma- chine learning for inferring the phase boundaries in a nonequi- librium system, Physical Review E 99 (2) (2019) 023304. doi:10.1103/PhysRevE.99.023304
-
[11]
F. Zipoli, V. Viterbo, O. Schilter, L. Kahle, T. Laino, Prediction of phase diagrams and associated phase structural properties, Indus- trial & Engineering Chemistry Research 61 (24) (2022) 8378–8389. doi:10.1021/acs.iecr.2c00355
-
[12]
D. Bayo, B. Çivitcioğlu, J. J. Webb, A. Honecker, R. A. Römer, Machine learning of phases and structures for model systems in physics, Journal of the Physical Society of Japan 94 (3) (2025) 031002. doi:10.7566/JPSJ.94.031002
-
[13]
M. Aghaaminiha, S. A. Ghanadian, E. Ahmadi, A. M. Farnoud, A machine learning approach to estimation of phase dia- grams for three-component lipid mixtures, Biochimica et Bio- physica Acta (BBA)-Biomembranes 1862 (9) (2020) 183350. doi:10.1016/j.bbamem.2020.183350
-
[14]
J. Sun, J. Qu, C. Zhao, X. Zhang, X. Liu, J. Wang, C. Wei, X. Liu, M. Wang, P. Zeng, et al., Precise prediction of phase-separation key residues by machine learning, Nature Communications 15 (1) (2024)
work page 2024
-
[15]
doi:10.1038/s41467-024-46901-9
-
[16]
E. P. Van Nieuwenburg, Y.-H. Liu, S. D. Huber, Learning phase transitions by confusion, Nature Physics 13 (5) (2017) 435–439. doi:10.1038/nphys4037. 19
-
[17]
W. Zhang, J. Liu, T.-C. Wei, Machine learning of phase transitions in the percolation and xy models, Physical Review E 99 (3) (2019) 032142. doi:10.1103/PhysRevE.99.032142
-
[18]
A. Canabarro, F. F. Fanchini, A. L. Malvezzi, R. Pereira, R. Chaves, Unveiling phase transitions with machine learning, Physical Review B 100 (4) (2019) 045129. doi:10.1103/PhysRevB.100.045129
-
[19]
H. Y. Kwon, H. Yoon, C. Lee, G. Chen, K. Liu, A. Schmid, Y. Wu, J. Choi, C. Won, Magnetic hamiltonian parameter estimation using deep learning techniques, Science advances 6 (39) (2020) eabb0872. doi:10.1126/sciadv.abb0872
-
[20]
F. A. Gómez Albarracín, H. D. Rosales, Machine learning techniques to construct detailed phase diagrams for skyrmion systems, Physical Review B 105 (21) (2022) 214423. doi:10.1103/PhysRevB.105.214423
-
[21]
Y. Che, C. Gneiting, T. Liu, F. Nori, Topological quantum phase transi- tions retrieved through unsupervised machine learning, Physical Review B 102 (13) (2020) 134213. doi:10.1103/PhysRevB.102.134213
- [22]
-
[23]
Y. Zhang, X. Xu, Predicting the superconducting transition tempera- ture of high-temperature layered superconductors via machine learning, Physica C: Superconductivity and its Applications 595 (2022) 1354031. doi:10.1016/j.physc.2022.1354031
-
[24]
S. Xie, Y. Quan, A. Hire, B. Deng, J. DeStefano, I. Salinas, U. Shah, L. Fanfarillo, J. Lim, J. Kim, et al., Machine learning of superconducting critical temperature from eliashberg theory, npj Computational Materi- als 8 (1) (2022) 14. doi:10.1038/s41524-021-00666-7
-
[25]
P. J. G. Nieto, E. G. Gonzalo, L. A. M. García, L. Álvarez-de Prado, A. B. Sánchez, Predicting the critical superconducting temperature us- ing the random forest, mlp neural network, m5 model tree and multivari- ate linear regression, Alexandria Engineering Journal 86 (2024) 144–156. doi:10.1016/j.aej.2023.11.034. 20
-
[26]
Y. D. Panov, A. S. Moskvin, A. A. Chikov, I. L. Avvakumov, Compe- tition of Spin and Charge Orders in a Model Cuprate, J. Supercond. Novel Magn. 29 (4) (2016) 1077–1083. doi:10.1007/s10948-016-3378-5
-
[27]
R. Micnas, J. Ranninger, S. Robaszkiewicz, Superconductiv- ity in narrow-band systems with local nonretarded attractive interactions, Reviews of Modern Physics 62 (1) (1990) 113. doi:10.1103/RevModPhys.62.113
-
[28]
E. Fradkin, S. A. Kivelson, J. M. Tranquada, Colloquium : Theory of in- tertwined orders in high temperature superconductors, Reviews of Mod- ern Physics 87 (2) (2015) 457–482. doi:10.1103/RevModPhys.87.457
-
[29]
Y. Miyatake, M. Yamamoto, J. Kim, M. Toyonaga, O. Nagai, On the implementation of the’heat bath’algorithms for monte carlo simulations of classical heisenberg spin systems, Journal of Physics C: solid state physics 19 (14) (1986) 2539. doi:10.1088/0022-3719/19/14/020
-
[30]
Y. D. Panov, S. V. Nuzhin, V. S. Ryumshin, A. S. Moskvin, The monte carlo method for the orthonickelate model, Fizika Tverdogo Tela 66 (7) (2024) 1221–1227
work page 2024
-
[31]
Y. D. Panov, V. A. Ulitko, D. N. Yasinskaya, A. S. Moskvin, Mod- ified monte carlo method with the heat bath algorithm for a model cuprate, arXiv preprint arXiv:2510.08289v1 (2025). doi:10.1088/1742- 6596/2043/1/012007
-
[32]
Very Deep Convolutional Networks for Large-Scale Image Recognition
K. Simonyan, A. Zisserman, Very deep convolutional networks for large-scale image recognition, arXiv preprint arXiv:1409.1556 (2014). doi:10.48550/arXiv.1409.1556
work page internal anchor Pith review Pith/arXiv arXiv doi:10.48550/arxiv.1409.1556 2014
-
[33]
K. He, X. Zhang, S. Ren, J. Sun, Deep residual learning for image recognition, in: Proceedings of the IEEE conference on computer vision and pattern recognition, 2016, pp. 770–778
work page 2016
-
[34]
U-Net: Convolutional networks for biomedical image segmentation
O. Ronneberger, P. Fischer, T. Brox, U-net: Convolutional networks for biomedicalimagesegmentation, in: InternationalConferenceonMedical image computing and computer-assisted intervention, Springer, 2015, pp. 234–241. doi:10.1007/978-3-319-24574-4_28. 21
-
[35]
R. Azad, E. K. Aghdam, A. Rauland, Y. Jia, A. H. Avval, A. Bo- zorgpour, S. Karimijafarbigloo, J. P. Cohen, E. Adeli, D. Merhof, Medical image segmentation review: The success of u-net, IEEE Transactions on Pattern Analysis and Machine Intelligence (2024). doi:10.1109/TPAMI.2024.3435571
-
[36]
W.-J. Lee, W.-T. Hsieh, B.-H. Fang, K.-H. Kao, N.-Y. Chen, De- vice simulations with a u-net model predicting physical quantities in two-dimensional landscapes, Scientific reports 13 (1) (2023) 731. doi:10.1038/s41598-023-27599-z
-
[37]
J. Ye, Y. Huang, K. Liu, U-net based vortex detection in bose–einstein condensates with automatic correction for manually mislabeled data, Scientific Reports 13 (1) (2023) 21278. doi:10.1038/s41598-023-48719-9
-
[38]
A. Kamali, K. Laksari, Physics-informed unets for discovering hidden elasticity in heterogeneous materials, Journal of the me- chanical behavior of biomedical materials 150 (2024) 106228. doi:10.1016/j.jmbbm.2023.106228
-
[39]
B.-R. Chen, Y.-S. Hsiao, W.-C. Lin, W.-J. Lee, N.-Y. Chen, T.-L. Wu, Using u-net convolutional neural network to model pixel-based electro- static potential distributions in gan power mis-hemts, Scientific reports 14 (1) (2024) 8151. doi:10.1038/s41598-024-58112-9
-
[40]
W. Yao, Z. Zeng, C. Lian, H. Tang, Pixel-wise regression using u-net and its application on pansharpening, Neurocomputing 312 (2018) 364–371
work page 2018
-
[41]
D. Gertsvolf, M. Horvat, D. Aslam, A. Khademi, U. Berardi, A u-net convolutional neural network deep learning model application for identi- fication of energy loss in infrared thermographic images, Applied Energy 360 (2024) 122696. 22
work page 2024
discussion (0)
Sign in with ORCID, Apple, or X to comment. Anyone can read and Pith papers without signing in.