REVIEW 4 major objections 5 minor 3 cited by
Most of the Milky Way's ultra-faint dwarf galaxies may already be in the dark-matter collapse phase, with their varied densities tracing one gravothermal trajectory.
Reviewed by Pith at T0; open to challenge. T0 means a machine referee read the full paper against a public rubric. the ladder, T0–T4 →
T0 review · deepseek-v4-flash
2026-08-02 18:48 UTC pith:7YTS3VPZ
load-bearing objection Plausible but not proven: the collapse-phase claim for most MW UFDs rests on per-object τ fits to a single simulated satellite track; the paper is honest about this and deserves refereeing, not rejection. the 4 major comments →
The dark fate of ultra-faint dwarfs: Gravothermal collapse in action
The pith
A machine-rendered reading of the paper's core claim, the machinery that carries it, and where it could break.
Core claim
The paper's central claim is that gravothermal evolution of self-interacting dark matter halos produces exactly the diversity of dark-matter densities observed in the Milky Way's ultra-faint dwarfs. Comparing 35 spectroscopically studied UFDs with high-resolution simulations of one satellite halo, the authors find that most UFDs have densities above the maximum-core-expansion value, which they read as the signature that these halos have entered the collapse phase—central density increasing with time. The depth of collapse varies strongly from system to system, and the paper assigns each UFD a stage τ = t/t* by matching its average density within the half-light radius to the simulated density
What carries the argument
The central object is the gravothermal collapse time t* and the universal evolution curve it normalises: t* depends only on initial halo density, scale radius, and self-interaction cross-section, and the ratio τ = t/t* acts as a universal clock for core expansion followed by collapse. The paper projects every observed ultra-faint dwarf onto that clock by matching the average density within its half-light radius to a single high-resolution SIDM satellite simulation at different snapshots. The second piece of machinery is tidal stripping: for satellites on small-pericentre orbits, mass loss accelerates the evolution, so the same clock runs faster, which the paper uses to explain why the denses
Load-bearing premise
The argument leans on the assumption that one simulated satellite halo—a single NFW profile, a single orbit, a single mass—can stand in for all of the Milky Way's ultra-faint dwarfs, because gravothermal evolution is universal and tides only change the timing, not the shape of the inner density profile.
What would settle it
Take spectra of enough stars in Draco II and Phoenix II to measure their velocity dispersions tightly: if their dark-matter densities turn out to be far below the current upper limits, the claim that the highest-density UFDs are in collapse loses its sharpest support; if the densities land near the upper limits, the collapse interpretation is directly confirmed. Alternatively, a clean measurement of the τ distribution across a complete sample of UFDs—without the freedom to adjust each halo's concentration—would settle whether the spread really follows the one universal gravothermal curve.
If this is right
- The observed spread in UFD central densities becomes a prediction, not a problem, for SIDM: low-density dwarfs are near core expansion, high-density dwarfs are deeper in collapse.
- Future measurements of the densest candidates, Draco II and Phoenix II, near their current upper limits would provide a direct test of the collapse scenario.
- A low-velocity cross-section around 80 cm² g⁻¹ becomes compatible with UFD kinematics, markedly larger than constraints that ignore gravothermal collapse.
- The anti-correlation between pericentre distance and assigned collapse stage implies the Milky Way's satellite population can be used to calibrate how tides accelerate gravothermal evolution.
Where Pith is reading between the lines
- If the universal-clock mapping is taken literally, the distribution of τ across a complete, selection-function-corrected sample of UFDs should match a cosmological population of accreted halos with varying concentrations and orbits; a mismatch would point to missing physics such as velocity anisotropy or two-species dark matter.
- The same ~80 cm² g⁻¹ cross-section at v ~ 20 km/s should leave traces elsewhere—for instance in the central densities of field dwarfs, in strong-lensing perturbers, or in cluster cores—so consistency checks across those independent probes are a natural next step.
- The paper's matching procedure uses only the average density within the half-light radius; with better stellar samples, one could fit full inner density profiles, and a flat inner slope during collapse could be separated from the cusps of collisionless dark matter.
- A sharp falsifier within the same framework: if a sizeable population of UFDs shows large τ but only moderate central densities, rather than the extreme densities one-species elastic SIDM predicts, that would favour scenarios where collapse is delayed or halted.
Editorial analysis
A structured set of objections, weighed in public.
Referee Report
Summary. This paper compares the average dark-matter densities within the half-light radii of 35 Milky Way ultra-faint dwarfs (UFDs) with idealized N-body simulations of a single satellite halo in collisionless CDM, in SIDM with a constant cross-section (σ/mχ = 80 cm² g⁻¹), and in SIDM with a velocity-dependent cross-section. The authors assign each UFD a gravothermal stage τ = t/t* by matching its inferred density to the simulated central-density–time curve (Fig. 3). They conclude that most UFDs lie on the rising, collapse branch of the gravothermal sequence; that the spread in τ explains the diversity in UFD densities; and that satellites with smaller pericentre distances have evolved further, suggesting tidally accelerated collapse. On this basis they argue that large SIDM cross-sections of order 80 cm² g⁻¹ at low velocities are plausible.
Significance. The question is timely, and the paper has real strengths: the simulations use 10⁷ particles per halo, resolve sub-0.1 kpc scales, and are claimed to control energy conservation in the collapse regime; the compiled sample of 35 UFDs is current; and the paper makes a falsifiable prediction that measurements of Draco II and Phoenix II near their upper limits would favour collapse. If the central inference held, it would be an important step toward using UFD diversity as an SIDM probe. However, the analysis as presented is essentially a one-parameter-per-object mapping: each UFD's τ is chosen so that its density lies on one simulated track, and the non-monotonic density–τ relation leaves a degeneracy with the initial NFW cusp. The paper's own Section 5 concedes that a CDM-consistent system can always be matched to some collapse stage when only the average density is used. The manuscript therefore demonstrates plausibility, not a secure detection; a forward population model or a quantitative SIDM-vs-CDM comparison is needed.
major comments (4)
- [§3.2, Fig. 3, Abstract] The headline claim that 'most UFDs have entered the collapse phase' is not independent of the fitting procedure. Each UFD is assigned a τ by matching its average density to the simulated ρ_cen(τ) curve, so the conclusion is a restatement of where the fitted τ values land. Because ρ_cen(τ) is non-monotonic (decreasing until τ ≈ 0.4, then increasing), a high-density UFD can be matched either on the initial NFW branch (τ ≈ 0) or on the collapse branch (τ ≳ 0.7). CDM halos give the same observable (Fig. 2, left), and Section 5 states that 'a single system that is consistent with CDM may always appear to be consistent with a specific state of the gravothermal collapse phase.' The abstract's definitive wording overstates the constraint; a Bayesian forward model with priors on infall time, concentration, and orbit, and a statistical SIDM/CDM comparison, is needed.
- [§2, §5, Fig. 1] The representativeness of the single simulated halo is load-bearing and is not demonstrated. The quoted universality of gravothermal evolution holds for isolated halos; for tidally interacting satellites the density–time track can depend on initial mass, concentration, and orbital history. The adopted track is one NFW halo (ρ0 = 4.42×10⁷ M⊙ kpc⁻³, rs = 1.28 kpc) on one orbit (peri ≈ 18 kpc, apo ≈ 142 kpc); Section 5 concedes 'we have considered only a single halo on a specific orbit.' Fig. 1 shows factor ~2–5 scatter in initial densities of cosmological progenitors, but the paper does not show that this scatter is absorbed by the τ renormalization. Since every τ in Fig. 3 and every lower-panel point in Fig. 5 is read off this single track, robustness to this scatter must be checked rather than assumed. Eq. (3) is the isolated-halo collapse time; the acknowledged tidal modification is not
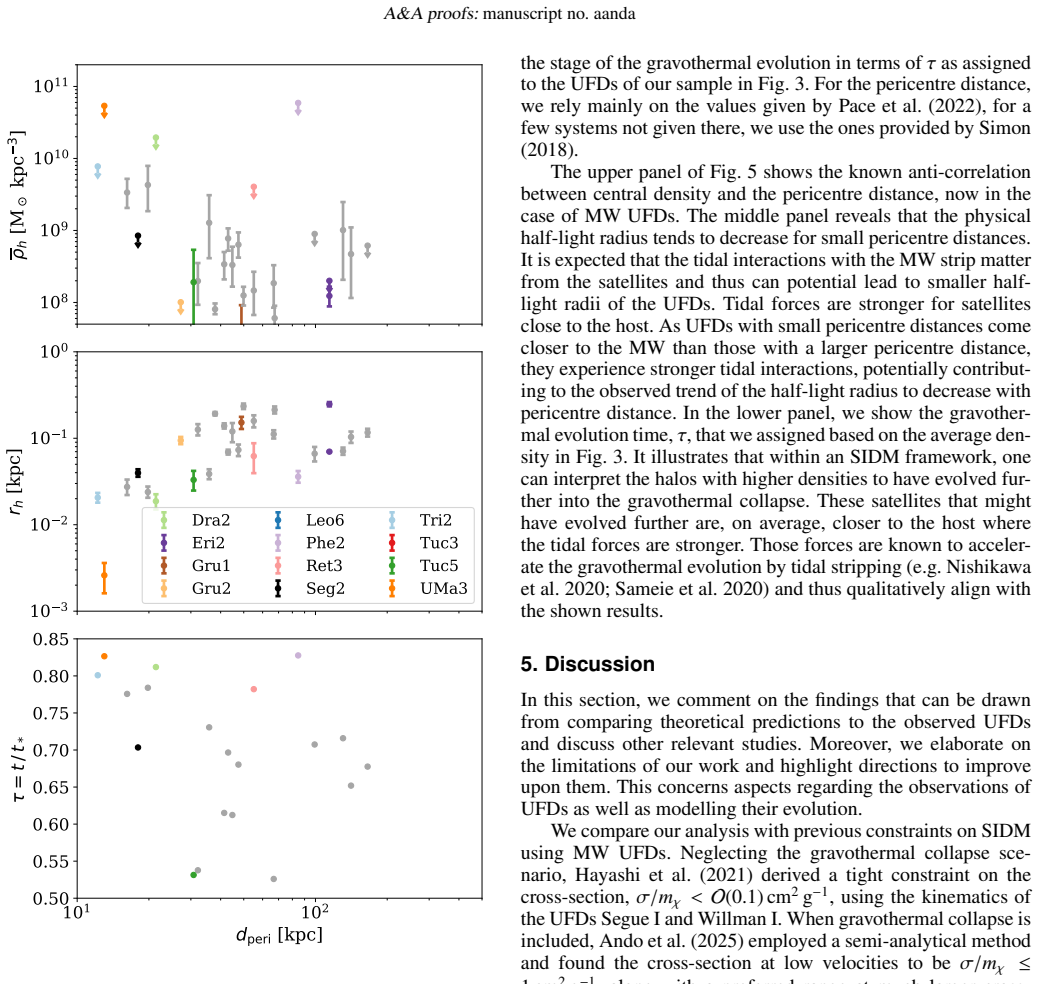
- [§4, Fig. 5] The pericentre–τ correlation is not an independent test of tidally accelerated collapse. Because τ is defined by the density match, the lower panel of Fig. 5 is essentially a monotonic transformation of the density–pericentre anticorrelation in the upper panel (on the chosen branch). The text states that the lower panel uses 'the gravothermal evolution stage that we assigned to the UFDs in Fig. 3.' An independent test would require τ estimates from full profile shapes or a forward model predicting the joint distribution of density, size, and pericentre. The host-distance version in Appendix A has the same logical structure.
- [§2, Abstract] The cross-section normalization needs clarification. The abstract says σ/mχ ≈ 80 cm² g⁻¹ at v ≈ 20 km s⁻¹, but Eq. (2) with σ0/mχ = 6593.89 cm² g⁻¹ and w = 20 km s⁻¹ gives σ/mχ = 1648 cm² g⁻¹ at v = 20 km s⁻¹. If 'effective cross-section' is intended, the velocity averaging and the relation to Eq. (2) should be stated explicitly. This matters because the computed t* = 4.51 Gyr and the inferred collapse stages are tied to the cross-section scale.
minor comments (5)
- [§1] Typo: 'assoicated' should be 'associated'.
- [Fig. 2 caption] Typo: 'collisonless' should be 'collisionless'.
- [§3, Figs. 3 and 5] Draco II and Phoenix II are upper limits, yet they are plotted without distinguishing markers in Fig. 5; the correlations may be influenced by limits. Please clarify and ideally propagate the uncertainty into the assigned τ values.
- [§6] Grammar: 'we also showed that that UFDs...' contains a duplicated 'that'.
- [Eq. (2)] Please define v precisely (relative velocity? one-dimensional dispersion?) and state how the 'effective cross-section of 80 cm²/g' follows from the stated parameters.
Circularity Check
The collapse-phase assignment is constructed by fitting τ to each UFD's observed density on a single simulated track; the headline claim and the τ–pericentre correlation then restate the input density data rather than independently predicting them.
specific steps
-
fitted input called prediction
[Section 3.2, Fig. 3]
"given that for the SIDM halos, the density gradient in the inner region is flat ... we assigned them a time τ such that they match the simulated central density."
The paper's headline result—that most UFDs have passed maximum core expansion and entered the collapse phase—is obtained by assigning each UFD the τ value at which the single simulated density track matches the observed central density. The stage τ is therefore not a prediction from the model; it is fitted to the input density. Since the density–τ curve is non-monotonic (Fig. 3), a high-density UFD could be placed at τ≈0 (initial NFW cusp) or on the collapse branch (τ>0.7), and the paper does not supply a population prior to choose between these branches. The statement that 'most UFDs ... could be in the collapse phase' is thus built into the assignment procedure, not independently established.
-
renaming known result
[Section 4, Fig. 5 lower panel]
"The lower panel gives the stage of the gravothermal evolution in terms of τ as assigned to the UFDs of our sample in Fig. 3."
Because τ is assigned solely from the observed average density, and the upper panel of Fig. 5 already shows the known density–pericentre anti-correlation (Kaplinghat et al. 2019), the lower-panel τ–pericentre anti-correlation is the same density–pericentre correlation remapped through a monotone function on the collapse branch. It does not add independent evidence for tidally accelerated gravothermal collapse; it restates the input density–pericentre relation in the model's time units. The paper presents this remapping as an SIDM interpretation, but the correlation is forced by construction.
full rationale
The paper is not wholly circular: it uses an externally motivated SIDM simulation (Fischer et al. 2025) and compares it with independent stellar-kinematic data, and the density–pericentre anti-correlation is a real observational pattern. However, the central claim that most MW UFDs are in the gravothermal collapse phase is derived by matching each UFD's observed density to a single simulated halo's density–τ track, so the inferred τ distribution is a fitted quantity rather than a prediction. The non-monotonic density–τ relation means high density alone does not force the collapse branch; the paper chooses it without a forward-model population prior. The τ–pericentre correlation in Fig. 5 is similarly a remapping of the input density–pericentre correlation. The paper itself concedes in Sect. 5 that a single system consistent with CDM can always be made consistent with a specific collapse state when only the average density within the half-light radius is compared, and that only one halo on one orbit was simulated. These concessions confirm that the collapse-phase assignment is underdetermined and that the headline inference is substantially an artifact of the fitting procedure. Nevertheless, the simulation provides external physical content and the CDM comparison offers a baseline, so the circularity is partial rather than total. Score 5 reflects this: not a fully forced self-citation chain, but the main 'prediction' reduces to the fitted input density through a chosen branch of a non-monotonic track.
Axiom & Free-Parameter Ledger
free parameters (4)
- Per-UFD gravothermal stage τ =
~0.37–0.85 (varies per object)
- SIDM cross-section σ/mχ (constant) =
80 cm² g⁻¹
- Velocity-dependent cross-section parameters σ0/mχ and w =
σ0/mχ = 6593.89 cm² g⁻¹, w = 20 km s⁻¹
- β in collapse-time normalization =
0.704
axioms (6)
- domain assumption Gravothermal evolution of SIDM halos is universal when normalized by collapse time t*.
- domain assumption Tidal stripping/heating only alters the time evolution of the inner halo, not the qualitative density-profile shape.
- domain assumption The Wolf et al. (2010) mass estimator gives an unbiased dynamical mass within the half-light radius for UFDs.
- domain assumption DM-only simulations are appropriate for UFDs; baryonic feedback and stellar mass are negligible for their DM distribution.
- domain assumption The analytic collapse-time formula, Eq. (3), with β = 0.704, correctly normalizes the evolution of the simulated halo.
- domain assumption The initial NFW profile and orbital parameters of the simulated satellite are representative of UFD progenitors.
read the original abstract
Ultra-faint dwarf (UFD) galaxies are a promising probe for dark matter (DM) physics as they are the most DM-dominated systems known. The Milky Way (MW) hosts many UFDs for which the properties of their DM distribution have been inferred from measurements of their stellar kinematics. If DM has self-interactions beyond gravity, the UFD halos may undergo a gravothermal evolution, giving rise to a population of galaxies with more diverse DM density profiles. We investigate DM densities of MW UFDs in self-interacting dark matter (SIDM) models, with an aim of determining the stage of gravothermal evolution for their halos. Therefore, we employed idealised high-resolution SIDM N-body simulations targeted to a MW-like system and compared the properties of simulated satellites to those of the observed UFDs. We find that the gravothermal evolution of SIDM halos produces diverse DM distributions, aligning with observations of the MW UFDs. Most of the UFDs have high DM densities, indicating that their halos have passed the period of maximum core expansion and entered the collapse phase, i.e. their central density may increase with time. The depth to which they have evolved into the gravothermal collapse may vary strongly across the satellites. This allows SIDM to account for the diversity in their DM densities. Moreover, the acceleration of the gravothermal evolution by tidal stripping can help to explain the diversity of the UFDs, as the ones with smaller pericentre distances require having evolved further into the gravothermal catastrophe. Large SIDM cross-sections of $\sigma / m_\chi \approx$ 80 cm$^2$ g$^{-1}$ at a velocity of $v \approx$ 20 km s$^{-1}$ are plausible, as the halo densities of MW UFDs are consistent with the gravothermal evolution predicted in SIDM, with most of them being in the collapse phase.
Figures


Forward citations
Cited by 3 Pith papers
-
Mergers Matter: Gravothermal Collapse in Dwarf Halos with Self-Interacting Dark Matter
SIDM simulations of dwarf halos show that quiescent merger histories produce gravothermal core collapse while sustained mergers prevent collapse and can yield central densities below gravothermal fluid model predictions.
-
Dwarf Galaxy Constraints on Interacting Fermionic Dark Matter
MCMC fits of degenerate fermionic dark matter models to eight classical dwarf spheroidal galaxies constrain fermion masses to 100-300 eV and show current data do not strongly favor interacting over non-interacting equ...
-
Gravothermal Collapse: Robust Against Baryonic Feedback
Baryonic feedback mildly delays but does not stall gravothermal collapse in high-concentration SIDM halos and allows resumption in median-concentration cases, yielding feedback-history-dependent central densities.
Reference graph
Works this paper leans on
-
[1]
R., Brewer, B
Adams, T. R., Brewer, B. J., & Lewis, G. F. 2026, A Bayesian Exploration of the Mass of Ursa Major III: Kinematics, Rotation and their influence on the Mass to Light Ratio
2026
-
[2]
K., et al
Adhikari, S., Banerjee, A., Boddy, K. K., et al. 2025, Reviews of Modern Physics, 97, 045004
2025
-
[3]
Amorisco, N. C. 2017, ApJ, 844, 64
2017
-
[4]
2025, arXiv e-prints, arXiv:2503.13650
Ando, S., Hayashi, K., Horigome, S., Ibe, M., & Shirai, S. 2025, arXiv e-prints, arXiv:2503.13650
Pith/arXiv arXiv 2025
-
[5]
L., & Inagaki, S
Balberg, S., Shapiro, S. L., & Inagaki, S. 2002, ApJ, 568, 475
2002
-
[6]
& Spurzem, R
Bettwieser, E. & Spurzem, R. 1986, A&A, 161, 102
1986
-
[7]
W., & Ramani, H
Bogorad, Z., Graham, P. W., & Ramani, H. 2025, J. Cosmology Astropart. Phys., 2025, 006
2025
-
[8]
W., Price-Whelan, A
Bonaca, A., Hogg, D. W., Price-Whelan, A. M., & Conroy, C. 2019, ApJ, 880, 38
2019
-
[9]
S., Pace, A
Bruce, J., Li, T. S., Pace, A. B., et al. 2023, ApJ, 950, 167
2023
-
[10]
Bullock, J. S. & Boylan-Kolchin, M. 2017, Annual Review of Astronomy and Astrophysics, 55, 343–387
2017
-
[11]
D., Zavala, J., Sales, L
Burger, J. D., Zavala, J., Sales, L. V ., et al. 2022, MNRAS, 513, 3458–3481
2022
-
[12]
B., Koposov, S
Buttry, R., Pace, A. B., Koposov, S. E., et al. 2022, MNRAS, 514, 1706
2022
-
[13]
L., Grillmair, C
Carlin, J. L., Grillmair, C. J., Muñoz, R. R., Nidever, D. L., & Majewski, S. R. 2009, ApJ, 702, L9
2009
- [14]
-
[15]
D., Li, T
Cerny, W., Simon, J. D., Li, T. S., et al. 2023, ApJ, 942, 111
2023
-
[16]
Cerny, W. et al. 2026, A Chemodynamical Census of the Milky Way’s Ultra-Faint Compact Satellites. I. A First Population-Level Look at the Internal Kinemat- ics and Metallicities of 19 Extremely-Low-Mass Halo Stellar Systems
2026
-
[17]
T., van den Bosch, F
Chiang, B. T., van den Bosch, F. C., & Schive, H.-Y . 2025, MNRAS, 544, 36
2025
-
[18]
D., et al
Chiti, A., Frebel, A., Simon, J. D., et al. 2021, Nature Astronomy, 5, 392–400
2021
-
[19]
D., Frebel, A., et al
Chiti, A., Simon, J. D., Frebel, A., et al. 2022, ApJ, 939, 41
2022
-
[20]
Correa, C. A. 2021, MNRAS, 503, 920
2021
-
[21]
A., Schaller, M., Ploeckinger, S., et al
Correa, C. A., Schaller, M., Ploeckinger, S., et al. 2022, MNRAS, 517, 3045
2022
-
[22]
2025, The AIDA-TNG project: dark matter profiles and concentrations in alternative dark matter models
Despali, G., Giocoli, C., Moscardini, L., et al. 2025, The AIDA-TNG project: dark matter profiles and concentrations in alternative dark matter models
2025
-
[23]
Devlin, S., Baumgardt, H., & Sweet, S. M. 2025, MNRAS, 539, 2485 2 https://github.com/apace7/local_volume_database Article number, page 7 of 9 A&A proofs:manuscript no. aanda
2025
-
[24]
2025, ApJ, 978, 38
Dutra, I., Natarajan, P., & Gilman, D. 2025, ApJ, 978, 38
2025
-
[25]
2001, ApJ, 560, 636
El-Zant, A., Shlosman, I., & Hoffman, Y . 2001, ApJ, 560, 636
2001
-
[26]
Engelhardt, A., Munshi, F., Peter, A. H. G., et al. 2026, MARVELously Dark: the gravothermal evolution of dwarf halos in velocity-dependent SIDM
2026
-
[27]
Enzi, W. J. R., Krawczyk, C. M., Ballard, D. J., & Collett, T. E. 2025, MNRAS, 540, 247
2025
-
[28]
F., Peñarrubia, J., Famaey, B., & Ibata, R
Errani, R., Navarro, J. F., Peñarrubia, J., Famaey, B., & Ibata, R. 2023, MNRAS, 519, 384
2023
-
[29]
F., Smith, S
Errani, R., Navarro, J. F., Smith, S. E. T., & McConnachie, A. W. 2024, ApJ, 965, 20
2024
-
[30]
D., Yu, H.-B., & Zhong, Y .-M
Essig, R., McDermott, S. D., Yu, H.-B., & Zhong, Y .-M. 2019, Phys. Rev. Lett., 123, 121102
2019
-
[31]
2021, Astrophys
Feng, W.-X., Yu, H.-B., & Zhong, Y .-M. 2021, Astrophys. J. Lett., 914, L26
2021
-
[32]
2025, Dark Bondi Accretion Aided by Baryons and the Origin of JWST Little Red Dots
Feng, W.-X., Yu, H.-B., & Zhong, Y .-M. 2025, Dark Bondi Accretion Aided by Baryons and the Origin of JWST Little Red Dots
2025
-
[33]
S., Brüggen, M., Schmidt-Hoberg, K., et al
Fischer, M. S., Brüggen, M., Schmidt-Hoberg, K., et al. 2022, MNRAS, 516, 1923
2022
-
[34]
Fischer, M. S., Yu, H.-B., & Dolag, K. 2025, arXiv e-prints, arXiv:2506.06269
arXiv 2025
-
[35]
Fisher, L. K. C., Goldstein, I. S., Kumar, J., & Strigari, L. E. 2025, arXiv e-prints, arXiv:2508.03823 Flammini Dotti, F., Capuzzo-Dolcetta, R., Carraro, G., Trani, A. A., & Spurzem, R. 2026, arXiv e-prints, arXiv:2601.13049
Pith/arXiv arXiv 2025
-
[36]
K., Carrera, R., Battaglia, G., & Taibi, S
Fritz, T. K., Carrera, R., Battaglia, G., & Taibi, S. 2019, A&A, 623, A129
2019
-
[37]
K., Kaplinghat, M., Outmezguine, N
Gad-Nasr, S., Boddy, K. K., Kaplinghat, M., Outmezguine, N. J., & Sagunski, L. 2024, J. Cosmology Astropart. Phys., 2024, 131
2024
-
[38]
2023, Phys
Gilman, D., Zhong, Y .-M., & Bovy, J. 2023, Phys. Rev. D, 107, 103008
2023
-
[39]
2012, MNRAS, 422, 1231
Governato, F., Zolotov, A., Pontzen, A., et al. 2012, MNRAS, 422, 1231
2012
-
[40]
Graham, P. W. & Ramani, H. 2024, Phys. Rev. D, 110
2024
-
[41]
D., Das, P., Heber, D., & Izzard, R
Gration, A., Hendriks, D. D., Das, P., Heber, D., & Izzard, R. G. 2025, MNRAS, 543, 1120
2025
-
[42]
2026, Non-Equilibrium Relativistic Core Collapse of Self-Interacting Dark Matter Halos – Limits On Seed Black Hole Mass
Gu, H.-P., Jiang, F., Chen, X., & Li, R. 2026, Non-Equilibrium Relativistic Core Collapse of Self-Interacting Dark Matter Halos – Limits On Seed Black Hole Mass
2026
- [43]
-
[44]
T., Simon, J
Hansen, T. T., Simon, J. D., Li, T. S., et al. 2024, ApJ, 968, 21
2024
-
[45]
R., Millman, K
Harris, C. R., Millman, K. J., van der Walt, S. J., et al. 2020, Nature, 585, 357
2020
-
[46]
Hayashi, K., Ferreira, E. G. M., & Chan, H. Y . J. 2021, ApJ, 912, L3
2021
-
[47]
2023, ApJ, 953, 185
Hayashi, K., Hirai, Y ., Chiba, M., & Ishiyama, T. 2023, ApJ, 953, 185
2023
-
[48]
2021, Phys
Hayashi, K., Ibe, M., Kobayashi, S., Nakayama, Y ., & Shirai, S. 2021, Phys. Rev. D, 103
2021
-
[49]
E., Li, T
Heiger, M. E., Li, T. S., Pace, A. B., et al. 2024, ApJ, 961, 234
2024
-
[50]
Hunter, J. D. 2007, Computing in Science Engineering, 9, 90
2007
-
[51]
Huo, R., Yu, H.-B., & Zhong, Y .-M. 2020, J. Cosmology Astropart. Phys., 06, 051 Häkkinen, J., Rawlings, A., Sawala, T., & Walker, M. G. 2025, Stellar cores live long and prosper in cuspy dark matter halos
2020
-
[52]
A., Li, T
Jenkins, S. A., Li, T. S., Pace, A. B., et al. 2021, ApJ, 920, 92
2021
-
[53]
2026, An Enhanced Isothermal Jeans Approach to Constraining Dark Matter Self-Interactions from Galactic Kinematics
Jia, Z., Jiang, F., Li, S., et al. 2026, An Enhanced Isothermal Jeans Approach to Constraining Dark Matter Self-Interactions from Galactic Kinematics
2026
-
[54]
2026, ApJ, 996, L19
Jiang, F., Jia, Z., Zheng, H., et al. 2026, ApJ, 996, L19
2026
-
[55]
R., & Wu, C.-L
Kahlhoefer, F., Kaplinghat, M., Slatyer, T. R., & Wu, C.-L. 2019, J. Cosmology Astropart. Phys., 12, 010
2019
- [56]
-
[57]
2025, arXiv e-prints, arXiv:2506.04334
Kamionkowski, M., Sigurdson, K., & Slone, O. 2025, arXiv e-prints, arXiv:2506.04334
Pith/arXiv arXiv 2025
-
[58]
2019, MNRAS, 490, 231
Kaplinghat, M., Valli, M., & Yu, H.-B. 2019, MNRAS, 490, 231
2019
-
[59]
2016, ApJ, 833, 16
Kim, D., Jerjen, H., Geha, M., et al. 2016, ApJ, 833, 16
2016
-
[60]
N., Boylan-Kolchin, M., Cohen, J
Kirby, E. N., Boylan-Kolchin, M., Cohen, J. G., et al. 2013, ApJ, 770, 16
2013
-
[61]
N., Simon, J
Kirby, E. N., Simon, J. D., & Cohen, J. G. 2015, ApJ, 810, 56
2015
-
[62]
& Shapiro, P
Koda, J. & Shapiro, P. R. 2011, MNRAS, 415, 1125
2011
-
[63]
E., Nightingale, J
Kollmann, K. E., Nightingale, J. W., Lisanti, M., Robertson, A., & Slone, O. 2026, MNRAS, 546, stag066
2026
-
[64]
& Yu, H.-B
Kong, D. & Yu, H.-B. 2025, Physics of the Dark Universe, 48, 101939
2025
-
[65]
Koulen, J. M., Profumo, S., & Smyth, N. 2024, arXiv e-prints, arXiv:2403.19015
arXiv 2024
-
[66]
2018, MNRAS, 474, 388
Kummer, J., Kahlhoefer, F., & Schmidt-Hoberg, K. 2018, MNRAS, 474, 388
2018
-
[67]
S., Jia, Z., et al
Li, S., Fischer, M. S., Jia, Z., et al. 2026, Testing the isothermal Jeans model for self-interacting dark matter halos in the collapse phase
2026
-
[68]
Li, S. et al. 2025, ApJ, 994, 201
2025
-
[69]
S., Simon, J
Li, T. S., Simon, J. D., Drlica-Wagner, A., et al. 2017, ApJ, 838, 8
2017
-
[70]
2018, MNRAS, 480, 2609–2627
Longeard, N., Martin, N., Starkenburg, E., et al. 2018, MNRAS, 480, 2609–2627
2018
-
[71]
2025, arXiv e-prints, arXiv:2505.06198
Lujan, N., Gebhardt, K., Anantua, R., et al. 2025, arXiv e-prints, arXiv:2505.06198
Pith/arXiv arXiv 2025
-
[72]
& Eggleton, P
Lynden-Bell, D. & Eggleton, P. P. 1980, MNRAS, 191, 483
1980
-
[73]
2025, arXiv e-prints, arXiv:2504.13004
Mace, C., Yang, S., Carton Zeng, Z., et al. 2025, arXiv e-prints, arXiv:2504.13004
Pith/arXiv arXiv 2025
-
[74]
C., Peter, A
Mace, C., Zeng, Z. C., Peter, A. H. G., et al. 2024, Phys. Rev. D, 110, 123024
2024
-
[75]
2013, MNRAS, 432, 1947
Martizzi, D., Teyssier, R., & Moore, B. 2013, MNRAS, 432, 1947
2013
-
[76]
E., Gad-Nasr, S., Kaplinghat, M., & Vegetti, S
Minor, Q. E., Gad-Nasr, S., Kaplinghat, M., & Vegetti, S. 2021, MNRAS, 507, 1662
2021
-
[77]
Nadler, E. O. 2025, ApJ, 983, L23
2025
-
[78]
O., Yang, D., & Yu, H.-B
Nadler, E. O., Yang, D., & Yu, H.-B. 2023, ApJ, 958, L39
2023
-
[79]
F., Frenk, C
Navarro, J. F., Frenk, C. S., & White, S. D. M. 1996, ApJ, 462, 563
1996
-
[80]
Nibauer, J., Bonaca, A., Price-Whelan, A. M., Spergel, D. N., & Greene, J. E. 2025, arXiv e-prints, arXiv:2510.02247
Pith/arXiv arXiv 2025
discussion (0)
Sign in with ORCID, Apple, or X to comment. Anyone can read and Pith papers without signing in.