REVIEW 3 major objections 5 minor 47 references
Resonant scattering of OVII X-ray light from a galaxy's bright core can count the oxygen ions in its faint outer halo from a simple flux ratio.
Reviewed by Pith at T0; open to challenge. T0 means a machine referee read the full paper against a public rubric. the ladder, T0–T4 →
T0 review · grok-4.5
2026-07-13 18:07 UTC pith:NSO45XSF
load-bearing objection Clean geometric OVII-counting idea that works to 0.2 dex after observable cuts in TNG50; residual bias is openly model-dependent. the 3 major comments →
Inferring the mass of the circumgalactic medium using X-ray resonant scattering
The pith
A machine-rendered reading of the paper's core claim, the machinery that carries it, and where it could break.
Core claim
For a clean sample of galaxies selected solely by X-ray observables, the OVII ion mass inside an outer radial shell (R500c to R200c) follows directly from the observed ratio of scattered OVII flux in the corresponding annulus to direct OVII flux from the bright central region (r less than 0.2 R500c), recovering the true mass with only a 10 percent systematic underestimate and an rms scatter of roughly 0.2 dex.
What carries the argument
Geometric OVII counting: under the thin-shell, optically thin limit the ion number equals a known geometric factor times the inverse average scattering cross-section times the outer-to-inner OVII flux ratio; the cross-section itself is evaluated from the observed line centroids and Doppler widths of the two regions.
Load-bearing premise
The line widths and centroids seen along our line of sight can be used as if the gas motions were isotropic and random, so that only a small, calibratable fraction of outer ions is missed by Doppler mismatch.
What would settle it
Apply the identical flux-ratio estimator to a second cosmological simulation suite that produces substantially different outer-halo velocity fields; if the residual bias or scatter changes by more than the claimed 10 percent / 0.2 dex, the method's claimed accuracy fails.
If this is right
- Future microcalorimeter maps that resolve the OVII resonant line can convert a simple flux ratio into an outer-halo OVII mass without needing the continuum.
- Once OVII mass is known, simulation-calibrated scalings convert it into total oxygen mass and total CGM gas mass inside the same shell.
- Observable cuts on satellite contamination, azimuthal symmetry, and inner-line width let observers pre-select the galaxies for which the conversion is reliable.
- The same geometric idea can be repeated for thinner radial shells once surface-brightness profiles are measured.
Where Pith is reading between the lines
- The residual 10 percent bias is itself a diagnostic of high-velocity outer gas that never enters the resonant window, so the method may constrain outflow and accretion kinematics as a byproduct.
- Laboratory measurement of the true OVII scattering phase function would remove the last purely geometric systematic before real-world application.
- If the OVII-to-total-oxygen and OVII-to-gas-mass scalings survive in other feedback models, the technique becomes a direct test of those models rather than a pure mass estimator.
Editorial analysis
A structured set of objections, weighed in public.
Referee Report
Summary. The paper proposes a geometric method to count OVII ions (and thereby estimate outer-CGM mass) from resonant scattering of the OVIIr line at 574 eV. In the idealized static, spherical, optically thin limit, the outer-shell OVII number is proportional to the observed outer-to-inner flux ratio times a scattering cross-section and geometric factors (Eqs. 1–5, 11). The method is tested on TNG50 galaxies with Monte Carlo radiative transfer of OVIIr. After excluding systems with strong satellite contamination, azimuthal anisotropy, or large-scale outflows using X-ray observables, the estimator recovers the true R500c–R200c OVII mass with ~10% bias and ~0.2 dex rms scatter (Fig. 9). The residual bias is attributed to high-velocity outer gas outside the resonant window (Fig. 10). OVII mass is then linked to total oxygen and CGM mass via TNG50 scaling relations (Eqs. 12–13).
Significance. If the accuracy holds beyond TNG50, the method would give a direct, nearly model-independent count of OVII ions in the faint outer CGM of individual galaxies—precisely the regime where thermal emission is too weak for conventional mass estimates. That is a genuine observational advance for future microcalorimeter missions (NewAthena, HUBS). Strengths include a transparent geometric derivation, self-consistent RT testing, selection cuts defined on observables rather than on the target mass, and an open attribution of the residual bias. The OVII-to-total-mass scalings are secondary and model-dependent, but the primary OVII-counting result is a concrete, falsifiable prediction for real data.
major comments (3)
- §5 and Fig. 9: The central claim of 10% bias and ~0.2 dex scatter is demonstrated only for TNG50. The residual bias is explicitly attributed to high-velocity outer gas whose Doppler mismatch places it outside the resonant window of the inner-source photons (Fig. 10; §4.3.1). Different feedback prescriptions produce different outer velocity fields and density profiles, so both the bias and the post-cleaning scatter can change. Because the method is intended for real galaxies whose feedback physics is unknown, the quoted accuracy is not yet shown to be robust. At minimum the paper should (i) restate the abstract/conclusion accuracy as TNG50-specific, (ii) quantify how the bias scales with the outer high-velocity fraction, and (iii) either test a second simulation suite or provide a clear observational diagnostic that the high-velocity fraction is small.
- §2.3.2 and §5: Scattering is treated as isotropic, while the true OVII phase function is ∝(1+cos²θ). The paper correctly notes that this is self-consistent inside the simulation but will bias real applications (photons scattered near 90°). Before claiming readiness for NewAthena/HUBS, the geometric estimator (Eq. 11) and the RT pipeline should be re-run with the laboratory or theoretical anisotropic phase function, or a quantitative upper bound on the resulting bias should be given.
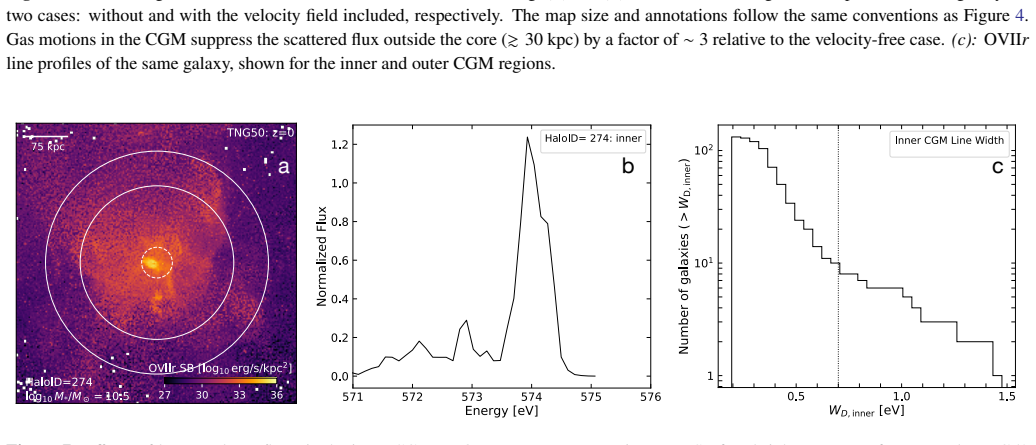
- Eq. (10) and §4.3.1: The substitution of line-of-sight observed Doppler widths and centroids for the 3D velocity distributions assumes isotropic random motions and that the outer velocity distribution is not broader than the inner one. Fig. 10 shows that the outer shell often has high-velocity wings beyond the inner range; those ions are invisible to the estimator. The paper treats this as a calibratable ~10% bias, but the assumption that LOS profiles adequately capture the resonant window is load-bearing and only weakly tested. A quantitative test (e.g., comparing ⟨σ_scat⟩ from LOS profiles vs. the full 3D velocity field for the clean sample) would strengthen the claim.
minor comments (5)
- §2.3.1: The ISM boost parameter b=10^{-4} is free; a short sensitivity check on how b affects the clean-sample recovery would help.
- §4.1–4.3: The satellite (15%), NSD (0.3), and W_D,inner (0.7 eV) thresholds are somewhat arbitrary. A brief robustness table showing how bias/scatter change when thresholds are varied would be useful.
- Fig. 2 and §3.1: The choice r_inner = 0.2 R500c is the sample median r_90; stating whether results are sensitive to modest changes (e.g., 0.15–0.25 R500c) would clarify generality.
- Eqs. (12)–(13): The OVII–oxygen and OVII–CGM scalings are TNG50-specific; the text should more clearly separate the primary geometric OVII count from these secondary, model-dependent conversions.
- Typographical: “GCM” appears for “CGM” in §2.2 heading; “esitmate” in §5; “emissivisity” in §2.3.1.
Circularity Check
No significant circularity: geometric OVII estimator is independent first-principles; TNG50 supplies validation, average geometric corrections, and empirical mass scalings only.
full rationale
The load-bearing estimator (Eqs. 1–5, 11) is derived from isotropic optically-thin scattering geometry and the definition of optical depth; it does not contain the target outer-shell OVII mass as an input. Average correction prefactors Cτ≈0.92 and Cproj≈0.73 (Sec. 4.4, Fig. 8) are measured once from density profiles and projection geometry for the chosen shell radii and are explicitly described as recoverable from an observed β-model; they are not free parameters adjusted to force the one-to-one recovery in Fig. 9. The residual 10% bias is measured a posteriori, attributed to high-velocity outer gas outside the resonant window (Fig. 10, Sec. 5), and flagged as model-dependent rather than absorbed into the formula. Empirical M_O–M_OVII and M_CGM–M_OVII fits (Eqs. 12–13) are presented as simulation correlations that enable secondary estimates, not as first-principles predictions. Self-citations to Nelson et al. (2023) and Byrohl & Nelson (2025) supply the RT code and parent sample but do not underwrite uniqueness or force the accuracy claim. Observable-based cleaning cuts (satellite fraction, NSD, W_D,inner) remove outliers without tautologically defining the mass. The derivation chain therefore remains non-circular; model dependence of the residual bias is a correctness/transferability issue, not circularity.
Axiom & Free-Parameter Ledger
free parameters (5)
- satellite-to-core emission threshold =
0.15
- azimuthal anisotropy NSD threshold =
0.3
- inner Doppler-width outflow threshold =
0.7 eV
- ISM boost parameter b =
1e-4
- average shell-thickness and projection corrections Cτ, Cproj =
Cτ≈0.92, Cproj≈0.73
axioms (5)
- ad hoc to paper Scattering is treated as isotropic even though the true OVII phase function is ∝(1+cos²θ).
- domain assumption Ionization equilibrium under the Faucher-Giguère UV/X-ray background plus collisional ionization (CLOUDY tables).
- domain assumption TNG50 baryonic physics (stellar and AGN feedback, metal enrichment) produce realistic CGM density, temperature, and velocity fields.
- ad hoc to paper Line-of-sight observed Doppler widths and centroids can be substituted for the 3D velocity distributions in the averaged cross-section (Eq. 10).
- domain assumption Optically thin limit (τ ≪ 1) outside the galactic disk/bulge.
read the original abstract
The circumgalactic medium (CGM) regulates galaxy growth and retains the imprint of feedback from supernovae and supermassive black holes. However, the bulk of the hot CGM produces little X-ray emission and is challenging to study with X-ray telescopes. We propose a novel method for evaluating the CGM mass using resonant scattering of the helium-like oxygen (\ovii) resonant line at $E=574$ eV. In a spherically symmetric and static CGM halo with a sharp central X-ray peak, the number of \ovii\ ions within an outer radial shell can be calculated from the ratio of the two directly observable quantities: the \ovii\ flux from the bright inner region and the scattered \ovii\ flux from the shell (where the scattered flux can be much higher than the intrinsic emission). To evaluate the accuracy of this geometric estimate for realistic galaxies -- with satellites, asymmetries, and gas velocities -- we use a sample of galaxies from the TNG50 cosmological simulation. We find that, when the most irregular systems are excluded based on their X-ray observables, we accurately predict the \ovii\ mass in the outer halo (e.g., in an $r=R_{\rm 500c}-R_{\rm 200c}$ shell) from the ratio of the fluxes in the corresponding annulus and the central peak region ($r<0.2R_{\rm 500c}$), with only a 10\% bias and an rms scatter of $\sim 0.2$ dex. As \ovii\ mass strongly correlates with the total oxygen and gas mass, this direct \ovii-counting method enables indirect estimates of those quantities by future X-ray microcalorimeter missions, such as {\em NewAthena}\/ and {\em HUBS}.
Figures




Reference graph
Works this paper leans on
-
[1]
2023, MNRAS, 524, 5391, doi: 10.1093/mnras/stad2046
Ayromlou, M., Nelson, D., & Pillepich, A. 2023, MNRAS, 524, 5391, doi: 10.1093/mnras/stad2046
-
[2]
2016, in Society of Photo-Optical Instrumentation Engineers (SPIE) Conference
Barret, D., Lam Trong, T., den Herder, J.-W., et al. 2016, in Society of Photo-Optical Instrumentation Engineers (SPIE) Conference
2016
-
[3]
9905, Space Telescopes and Instrumentation 2016: Ultraviolet to Gamma Ray, ed
Series, Vol. 9905, Space Telescopes and Instrumentation 2016: Ultraviolet to Gamma Ray, ed. J.-W. A. den Herder, T. Takahashi, & M. Bautz, 99052F, doi: 10.1117/12.2232432 Bogdán, Á., Bourdin, H., Forman, W. R., et al. 2017, ApJ, 850, 98, doi: 10.3847/1538-4357/aa9523
-
[4]
2023, Science China Physics, Mechanics, and Astronomy, 66, 299513, doi: 10.1007/s11433-023-2149-y
Bregman, J., Cen, R., Chen, Y., et al. 2023, Science China Physics, Mechanics, and Astronomy, 66, 299513, doi: 10.1007/s11433-023-2149-y
-
[5]
2025, arXiv e-prints, arXiv:2507.11603, doi: 10.48550/arXiv.2507.11603
Byrohl, C., & Nelson, D. 2025, arXiv e-prints, arXiv:2507.11603, doi: 10.48550/arXiv.2507.11603
-
[6]
2021, MNRAS, 506, 5129, doi: 10.1093/mnras/stab1958
Byrohl, C., Nelson, D., Behrens, C., et al. 2021, MNRAS, 506, 5129, doi: 10.1093/mnras/stab1958
-
[7]
Chadayammuri, U., Bogdán, Á., Oppenheimer, B. D., et al. 2022, ApJL, 936, L15, doi: 10.3847/2041-8213/ac8936
-
[8]
1950, Radiative Transfer (New York: Dover Publications)
Chandrasekhar, S. 1950, Radiative Transfer (New York: Dover Publications)
1950
-
[9]
2001, MNRAS, 323, 93, doi: 10.1046/j.1365-8711.2001.04090.x
Churazov, E., Haehnelt, M., Kotov, O., & Sunyaev, R. 2001, MNRAS, 323, 93, doi: 10.1046/j.1365-8711.2001.04090.x
-
[10]
2010, SSRv, 157, 193, doi: 10.1007/s11214-010-9685-4
Churazov, E., Zhuravleva, I., Sazonov, S., & Sunyaev, R. 2010, SSRv, 157, 193, doi: 10.1007/s11214-010-9685-4
-
[11]
2022, A&A, 666, A156, doi: 10.1051/0004-6361/202243101
Comparat, J., Truong, N., Merloni, A., et al. 2022, A&A, 666, A156, doi: 10.1051/0004-6361/202243101
-
[12]
2023, ApJ, 951, 125, doi: 10.3847/1538-4357/acd764
Das, S., Chiang, Y.-K., & Mathur, S. 2023, ApJ, 951, 125, doi: 10.3847/1538-4357/acd764
-
[13]
Dekel, A., & Birnboim, Y. 2006, MNRAS, 368, 2, doi: 10.1111/j.1365-2966.2006.10145.x Faucher-Giguère, C.-A., Kereš, D., & Ma, C.-P. 2011, MNRAS, 417, 2982, doi: 10.1111/j.1365-2966.2011.19457.x Faucher-Giguère, C.-A., Lidz, A., Zaldarriaga, M., & Hernquist, L. 2009, ApJ, 703, 1416, doi: 10.1088/0004-637X/703/2/1416 Ferland,G.J.,Chatzikos,M.,Guzmán,F.,etal...
-
[14]
R., Syunyaev, R
Gilfanov, M. R., Syunyaev, R. A., & Churazov, E. M. 1987, Pisma v Astronomicheskii Zhurnal, 13, 7
1987
-
[15]
Greco, J. P., Hill, J. C., Spergel, D. N., & Battaglia, N. 2015, ApJ, 808, 151, doi: 10.1088/0004-637X/808/2/151
-
[16]
Hamilton, D. R. 1947, ApJ, 106, 457, doi: 10.1086/144976
-
[17]
2019, MNRAS, 482, 4972, doi: 10.1093/mnras/sty2992 15
Khabibullin, I., & Churazov, E. 2019, MNRAS, 482, 4972, doi: 10.1093/mnras/sty2992 15
-
[18]
2022, arXiv e-prints, arXiv:2211.09827, doi: 10.48550/arXiv.2211.09827
Kraft, R., Markevitch, M., Kilbourne, C., et al. 2022, arXiv e-prints, arXiv:2211.09827, doi: 10.48550/arXiv.2211.09827
-
[19]
Li, J.-T., Bregman, J. N., Wang, Q. D., et al. 2017, ApJS, 233, 20, doi: 10.3847/1538-4365/aa96fc
-
[20]
Lim, S. H., Mo, H. J., Li, R., et al. 2018, ApJ, 854, 181, doi: 10.3847/1538-4357/aaaa21
-
[21]
2018, MNRAS, 480, 5113, doi: 10.1093/mnras/sty2206
Marinacci, F., Vogelsberger, M., Pakmor, R., et al. 2018, MNRAS, 480, 5113, doi: 10.1093/mnras/sty2206
-
[22]
2012, MNRAS, 426, 1870, doi: 10.1111/j.1365-2966.2012.21831.x
Mineo, S., Gilfanov, M., & Sunyaev, R. 2012, MNRAS, 426, 1870, doi: 10.1111/j.1365-2966.2012.21831.x
-
[23]
P., Pillepich, A., Springel, V., et al
Naiman, J. P., Pillepich, A., Springel, V., et al. 2018, MNRAS, 477, 1206, doi: 10.1093/mnras/sty618
-
[24]
2018, MNRAS, 475, 624, doi: 10.1093/mnras/stx3040 —
Nelson, D., Pillepich, A., Springel, V., et al. 2018, MNRAS, 475, 624, doi: 10.1093/mnras/stx3040 —. 2019, MNRAS, 490, 3234, doi: 10.1093/mnras/stz2306
-
[25]
2023, MNRAS, 522, 3665, doi: 10.1093/mnras/stad1195
Nelson, D., Byrohl, C., Ogorzalek, A., et al. 2023, MNRAS, 522, 3665, doi: 10.1093/mnras/stad1195
-
[26]
Nica, A., Oppenheimer, B. D., Crain, R. A., et al. 2022, MNRAS, 517, 1958, doi: 10.1093/mnras/stac2020
-
[27]
Crain, R. A. 2018, MNRAS, 474, 4740, doi: 10.1093/mnras/stx2967 Péroux, C., Nelson, D., van de Voort, F., et al. 2020, MNRAS, 499, 2462, doi: 10.1093/mnras/staa2888
-
[28]
Pillepich, A., Nelson, D., Truong, N., et al. 2021, MNRAS, 508, 4667, doi: 10.1093/mnras/stab2779 Pillepich,A.,Nelson,D., Hernquist,L.,etal.2018a,MNRAS, 475, 648, doi: 10.1093/mnras/stx3112
-
[29]
2018b, MNRAS, 473, 4077, doi: 10.1093/mnras/stx2656
Pillepich, A., Springel, V., Nelson, D., et al. 2018b, MNRAS, 473, 4077, doi: 10.1093/mnras/stx2656
-
[30]
2019, MNRAS, 490, 3196, doi: 10.1093/mnras/stz2338 Planck Collaboration, Ade, P
Pillepich, A., Nelson, D., Springel, V., et al. 2019, MNRAS, 490, 3196, doi: 10.1093/mnras/stz2338 Planck Collaboration, Ade, P. A. R., Aghanim, N., et al. 2013, A&A, 557, A52, doi: 10.1051/0004-6361/201220941 —. 2016, A&A, 594, A13, doi: 10.1051/0004-6361/201525830
-
[31]
Schellenberger, G., Bogdán, Á., ZuHone, J. A., et al. 2024, ApJ, 969, 85, doi: 10.3847/1538-4357/ad4548
-
[32]
2010, MNRAS, 401, 791, doi: 10.1111/j.1365-2966.2009.15715.x
Springel, V. 2010, MNRAS, 401, 791, doi: 10.1111/j.1365-2966.2009.15715.x
-
[33]
2003, MNRAS, 339, 289, doi: 10.1046/j.1365-8711.2003.06206.x
Springel, V., & Hernquist, L. 2003, MNRAS, 339, 289, doi: 10.1046/j.1365-8711.2003.06206.x
-
[34]
2018, MNRAS, 475, 676, doi: 10.1093/mnras/stx3304
Springel, V., Pakmor, R., Pillepich, A., et al. 2018, MNRAS, 475, 676, doi: 10.1093/mnras/stx3304
-
[35]
Sunyaev, R. A., & Zeldovich, Y. B. 1969, Nature, 223, 721, doi: 10.1038/223721a0
-
[36]
Suresh, J., Rubin, K. H. R., Kannan, R., et al. 2017, MNRAS, 465, 2966, doi: 10.1093/mnras/stw2499
-
[37]
2021, MNRAS, 508, 1563, doi: 10.1093/mnras/stab2638
Truong, N., Pillepich, A., Nelson, D., Werner, N., & Hernquist, L. 2021, MNRAS, 508, 1563, doi: 10.1093/mnras/stab2638
-
[38]
2023, MNRAS, 525, 1976, doi: 10.1093/mnras/stad2216
Truong, N., Pillepich, A., Nelson, D., et al. 2023, MNRAS, 525, 1976, doi: 10.1093/mnras/stad2216
-
[39]
Tumlinson, J., Peeples, M. S., & Werk, J. K. 2017, ARA&A, 55, 389, doi: 10.1146/annurev-astro-091916-055240
-
[40]
Verner, D. A., Verner, E. M., & Ferland, G. J. 1996, Atomic Data and Nuclear Data Tables, 64, 1, doi: 10.1006/adnd.1996.0018
-
[41]
2017, MNRAS, 465, 3291, doi: 10.1093/mnras/stw2944
Weinberger, R., Springel, V., Hernquist, L., et al. 2017, MNRAS, 465, 3291, doi: 10.1093/mnras/stw2944
-
[42]
R., Churazov, E., & Scannapieco, E
Werner, N., McNamara, B. R., Churazov, E., & Scannapieco, E. 2019, SSRv, 215, 5, doi: 10.1007/s11214-018-0571-9
-
[43]
White, S. D. M., & Frenk, C. S. 1991, ApJ, 379, 52, doi: 10.1086/170483
doi:10.1086/170483 1991
-
[44]
White, S. D. M., & Rees, M. J. 1978, MNRAS, 183, 341, doi: 10.1093/mnras/183.3.341
-
[45]
Yusef-Zadeh, F., Morris, M., & White, R. L. 1984, ApJ, 278, 186, doi: 10.1086/161780
doi:10.1086/161780 1984
-
[46]
2024a, A&A, 690, A267, doi: 10.1051/0004-6361/202449412 —
Zhang, Y., Comparat, J., Ponti, G., et al. 2024a, A&A, 690, A267, doi: 10.1051/0004-6361/202449412 —. 2024b, A&A, 690, A268, doi: 10.1051/0004-6361/202449413 —. 2025, A&A, 693, A197, doi: 10.1051/0004-6361/202452273
-
[47]
2020, MNRAS, 499, 768, doi: 10.1093/mnras/staa2607
Zinger, E., Pillepich, A., Nelson, D., et al. 2020, MNRAS, 499, 768, doi: 10.1093/mnras/staa2607
discussion (0)
Sign in with ORCID, Apple, or X to comment. Anyone can read and Pith papers without signing in.