Recognition: 2 theorem links
· Lean TheoremThe Rashomon Effect for Visualizing High-Dimensional Data
Pith reviewed 2026-05-13 23:25 UTC · model grok-4.3
The pith
The Rashomon set of dimension reductions allows embeddings to be aligned with principal components or external concepts while extracting stable neighborhood relations.
A machine-rendered reading of the paper's core claim, the machinery that carries it, and where it could break.
Core claim
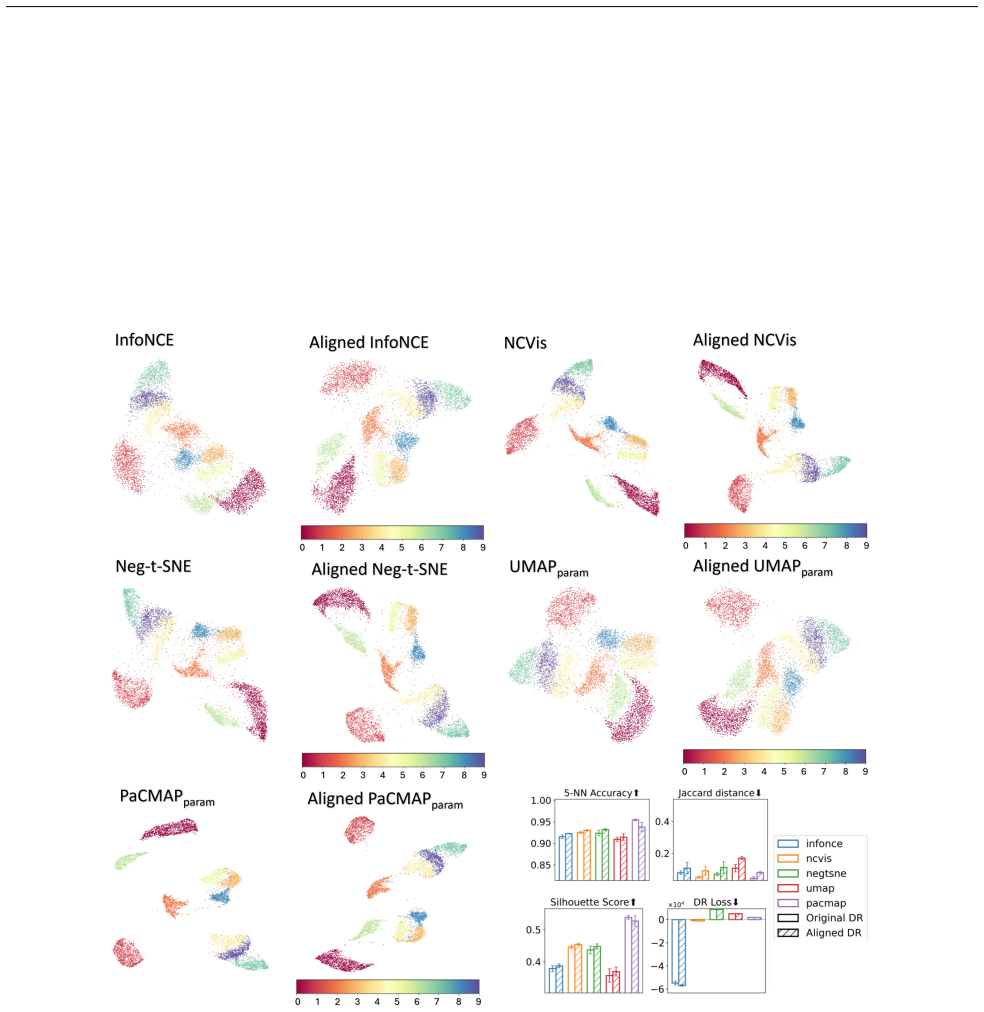
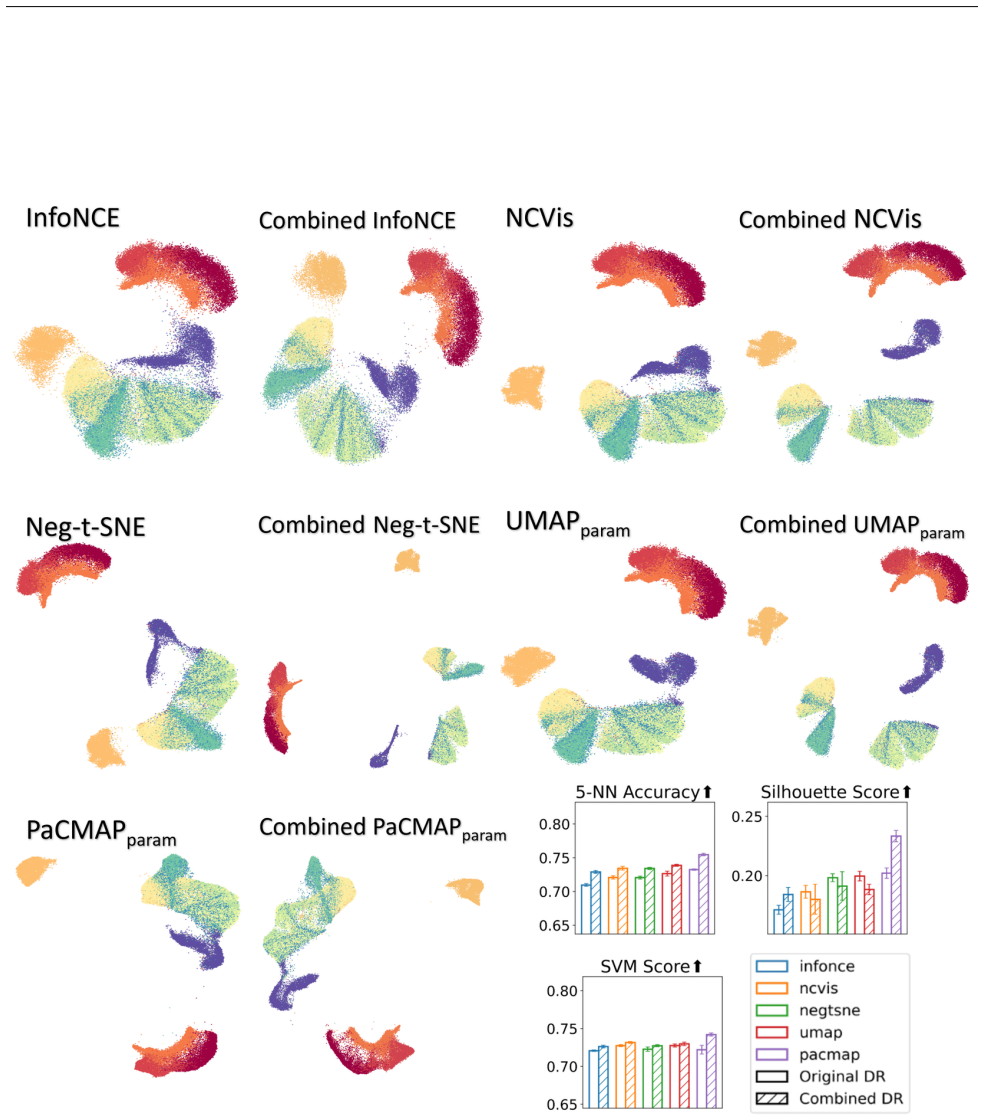
The Rashomon set for dimension reduction is the collection of embeddings that all preserve high-dimensional structure equally well. By steering members of this set toward principal components, aligning dimensions with external concepts, and distilling persistent nearest-neighbor relations, one obtains embeddings whose axes are interpretable, whose dimensions match user knowledge, and whose local structure is more trustworthy while global relationships remain intact.
What carries the argument
The Rashomon set for DR—the collection of all good embeddings that preserve data structure equally well—used to perform alignments and extract consensus neighbor relations.
If this is right
- Embeddings can be oriented to principal components so that axes carry clear variance meaning.
- Individual dimensions can be regularized to match class labels or user-specified concepts.
- Persistent nearest-neighbor pairs across the set produce refined embeddings with stronger local fidelity.
- Global structure is retained while local distortions from any single embedding are reduced.
Where Pith is reading between the lines
- The same multiplicity approach could be applied to other non-unique tasks such as clustering or manifold learning.
- Interactive tools could let users choose which concepts to align against and immediately see the resulting family of embeddings.
- Trust metrics computed across the Rashomon set may serve as a general diagnostic for any dimension-reduction output.
Load-bearing premise
Alignments to principal components or external concepts can be performed without distorting the local neighborhood structure preserved by the original embeddings.
What would settle it
Compute trustworthiness or local-neighborhood preservation scores on the refined embeddings after alignment or consensus extraction; if these scores fall substantially below those of the original Rashomon members, the claim that the operations preserve good properties is false.
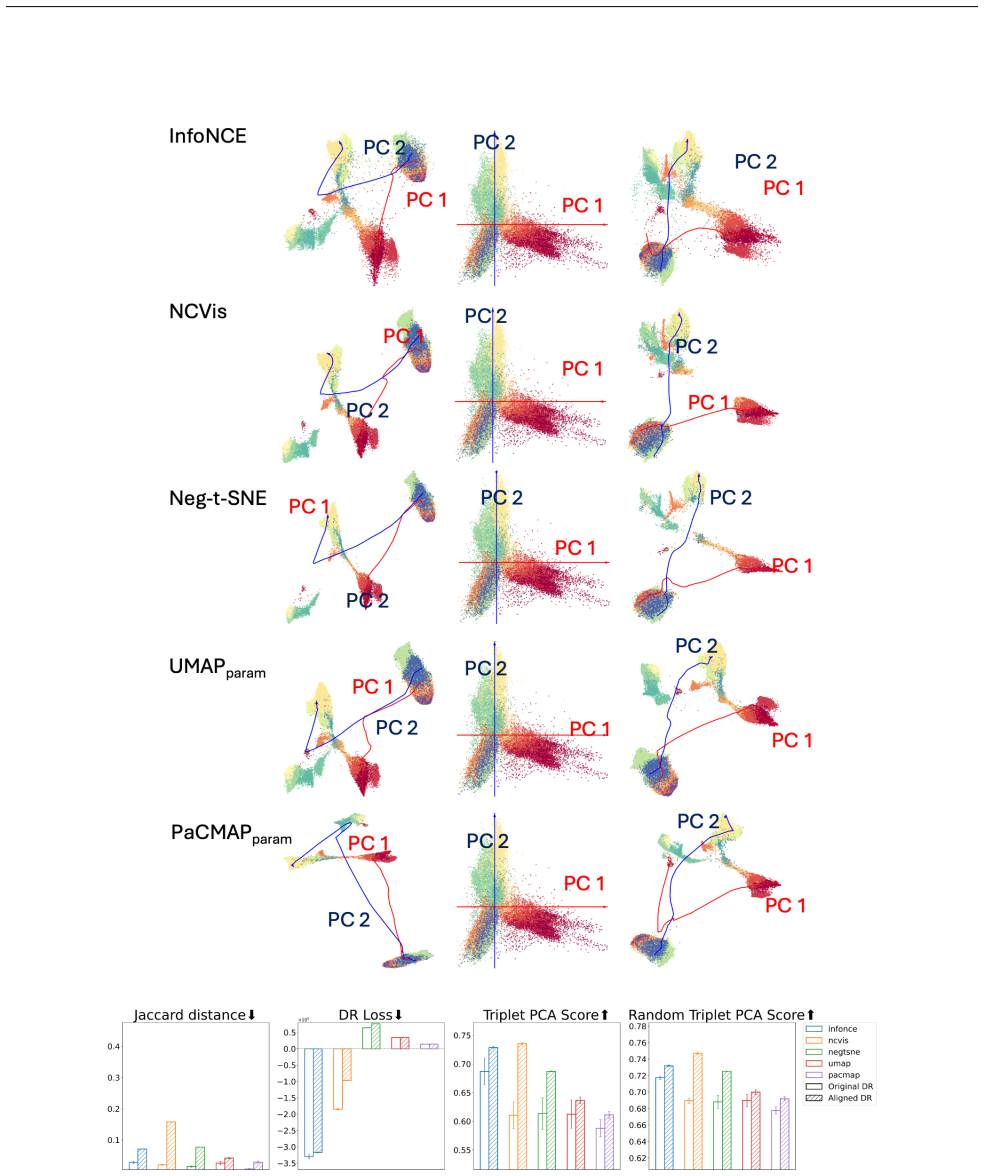
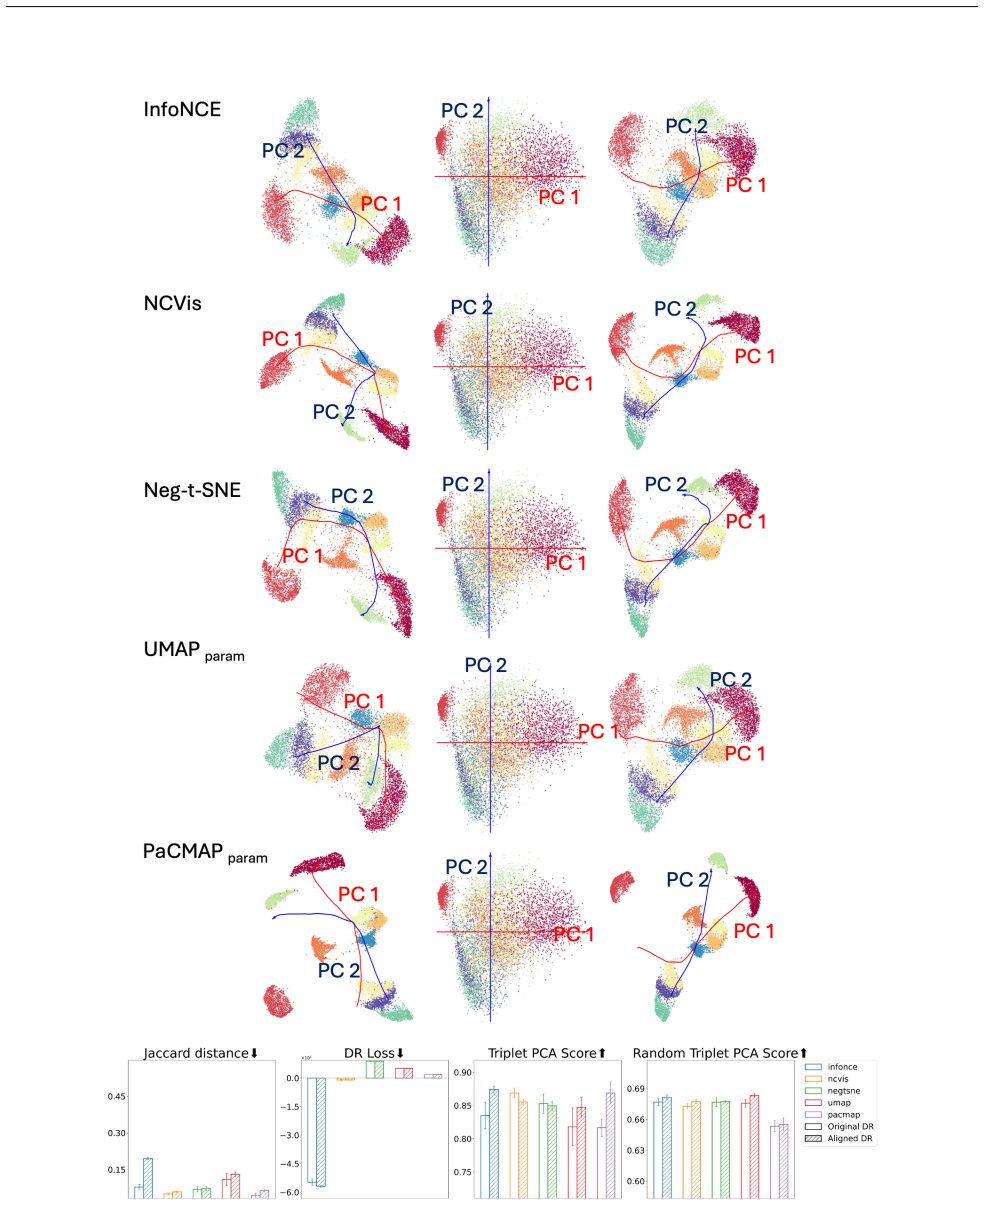
Figures


read the original abstract
Dimension reduction (DR) is inherently non-unique: multiple embeddings can preserve the structure of high-dimensional data equally well while differing in layout or geometry. In this paper, we formally define the Rashomon set for DR -- the collection of `good' embedding -- and show how embracing this multiplicity leads to more powerful and trustworthy representations. Specifically, we pursue three goals. First, we introduce PCA-informed alignment to steer embeddings toward principal components, making axes interpretable without distorting local neighborhoods. Second, we design concept-alignment regularization that aligns an embedding dimension with external knowledge, such as class labels or user-defined concepts. Third, we propose a method to extract common knowledge across the Rashomon set by identifying trustworthy and persistent nearest-neighbor relationships, which we use to construct refined embeddings with improved local structure while preserving global relationships. By moving beyond a single embedding and leveraging the Rashomon set, we provide a flexible framework for building interpretable, robust, and goal-aligned visualizations.
Editorial analysis
A structured set of objections, weighed in public.
Referee Report
Summary. The paper claims that dimension reduction is non-unique and formally defines the Rashomon set as the collection of good embeddings that preserve high-dimensional structure equally well. It introduces PCA-informed alignment to steer embeddings toward principal components for interpretability without distorting local neighborhoods, concept-alignment regularization to align dimensions with external knowledge such as class labels, and a method to extract persistent nearest-neighbor relationships across the Rashomon set for constructing refined embeddings that improve local structure while preserving global relationships. The overall framework is positioned as enabling interpretable, robust, and goal-aligned visualizations by embracing embedding multiplicity.
Significance. If the alignments and regularization preserve local neighborhood fidelity as asserted, the work would offer a useful extension to standard DR methods by systematically addressing non-uniqueness, potentially improving trustworthiness in visualizations for exploratory data analysis and downstream tasks. The focus on persistent relationships across multiple embeddings provides a concrete mechanism for robustness that could be adopted in visualization pipelines.
major comments (2)
- [Abstract] Abstract: The central claim that PCA-informed alignment and concept-alignment regularization steer embeddings toward interpretable axes or external concepts 'without distorting local neighborhoods' is load-bearing for the interpretability, robustness, and goal-alignment goals, yet the abstract provides no equations, loss terms, or proof that nearest-neighbor relations are invariant under these additions; if the regularization modifies the original DR objective, the subsequent extraction of persistent relationships may operate on already-altered structure.
- [Method] Method section (construction of Rashomon set and refined embeddings): The procedure for identifying 'trustworthy and persistent' nearest-neighbor relationships across the Rashomon set and using them to build refined embeddings is described only at a high level; without the explicit stability metric, frequency threshold, or optimization used to combine local and global information, it is impossible to verify that the refined embeddings improve local fidelity without introducing new global distortions.
minor comments (2)
- [Abstract] Abstract: The phrase 'equally well' for defining good embeddings in the Rashomon set would benefit from a precise quantitative criterion (e.g., loss threshold relative to the optimum) to make the set well-defined and reproducible.
- [Notation] Throughout: Notation for the Rashomon set and the alignment operators should be introduced with explicit symbols early in the text to aid readability when discussing multiple embeddings.
Simulated Author's Rebuttal
We thank the referee for their constructive comments, which have helped us clarify key technical aspects of the manuscript. We address each major comment below and have revised the paper accordingly to strengthen the presentation of our methods and claims.
read point-by-point responses
-
Referee: [Abstract] Abstract: The central claim that PCA-informed alignment and concept-alignment regularization steer embeddings toward interpretable axes or external concepts 'without distorting local neighborhoods' is load-bearing for the interpretability, robustness, and goal-alignment goals, yet the abstract provides no equations, loss terms, or proof that nearest-neighbor relations are invariant under these additions; if the regularization modifies the original DR objective, the subsequent extraction of persistent relationships may operate on already-altered structure.
Authors: We agree that the abstract is too concise on this point. The PCA-informed alignment adds a regularization term that rotates the embedding to align with principal components while preserving pairwise distances in local neighborhoods (see Eq. 4 in the manuscript). Concept-alignment regularization similarly augments the objective with a supervised term that does not alter nearest-neighbor ranks, as the penalty is applied only to global axis directions. In the revised manuscript we have expanded the abstract to briefly state that both alignments are implemented via additive regularization terms that leave local neighborhood structure invariant, with full loss functions and invariance arguments provided in Section 3. Experiments in Section 5 confirm that nearest-neighbor preservation metrics remain unchanged after alignment. revision: partial
-
Referee: [Method] Method section (construction of Rashomon set and refined embeddings): The procedure for identifying 'trustworthy and persistent' nearest-neighbor relationships across the Rashomon set and using them to build refined embeddings is described only at a high level; without the explicit stability metric, frequency threshold, or optimization used to combine local and global information, it is impossible to verify that the refined embeddings improve local fidelity without introducing new global distortions.
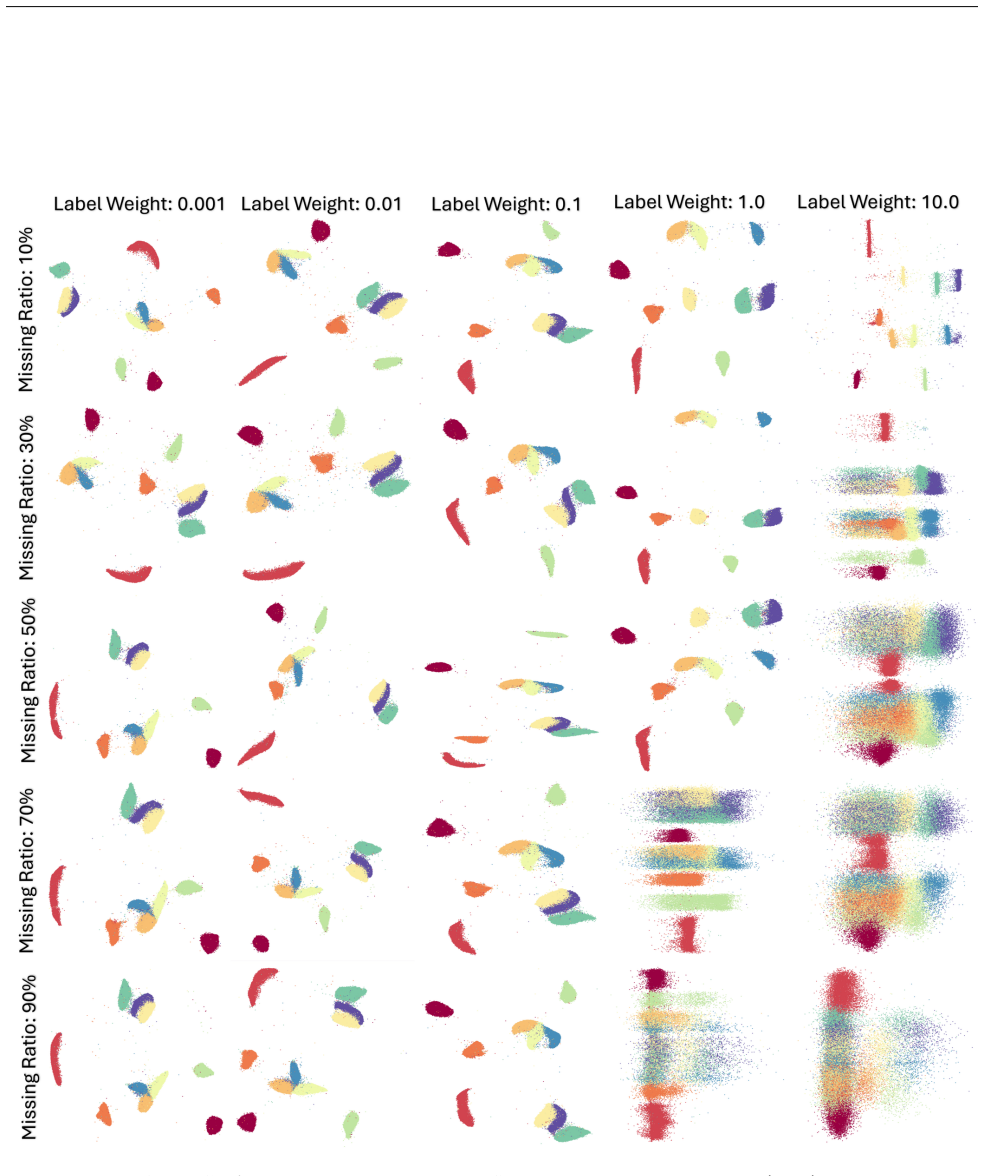
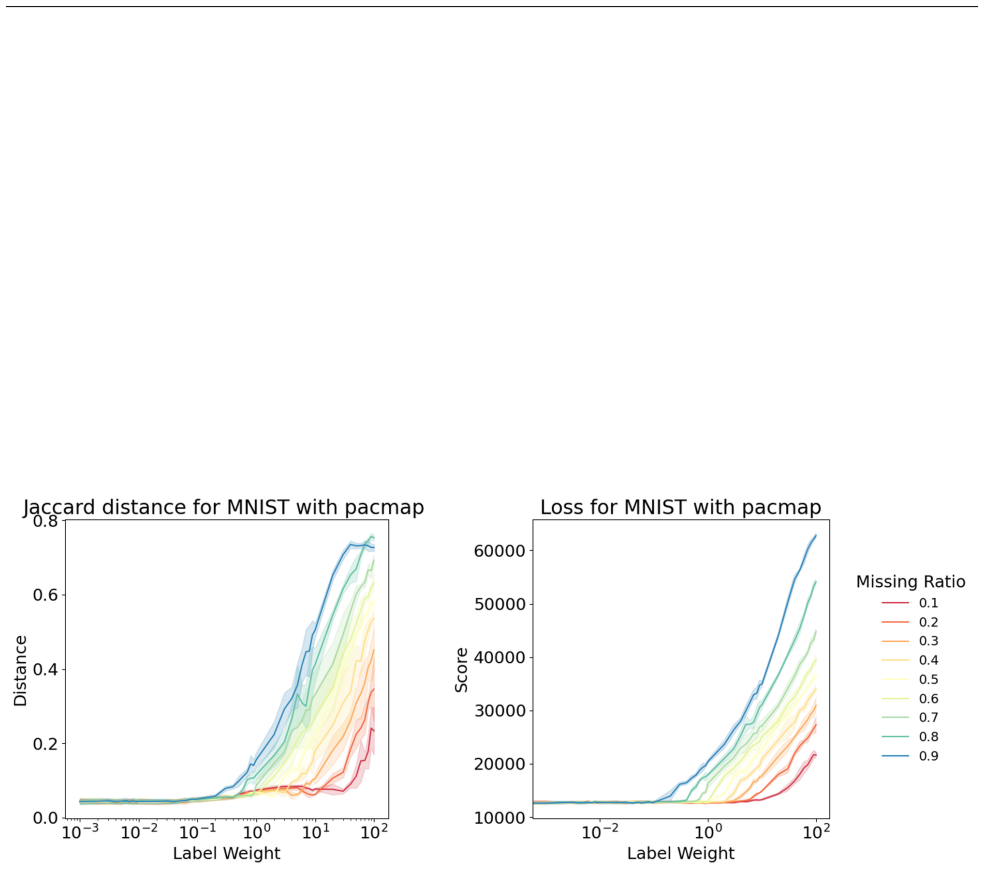
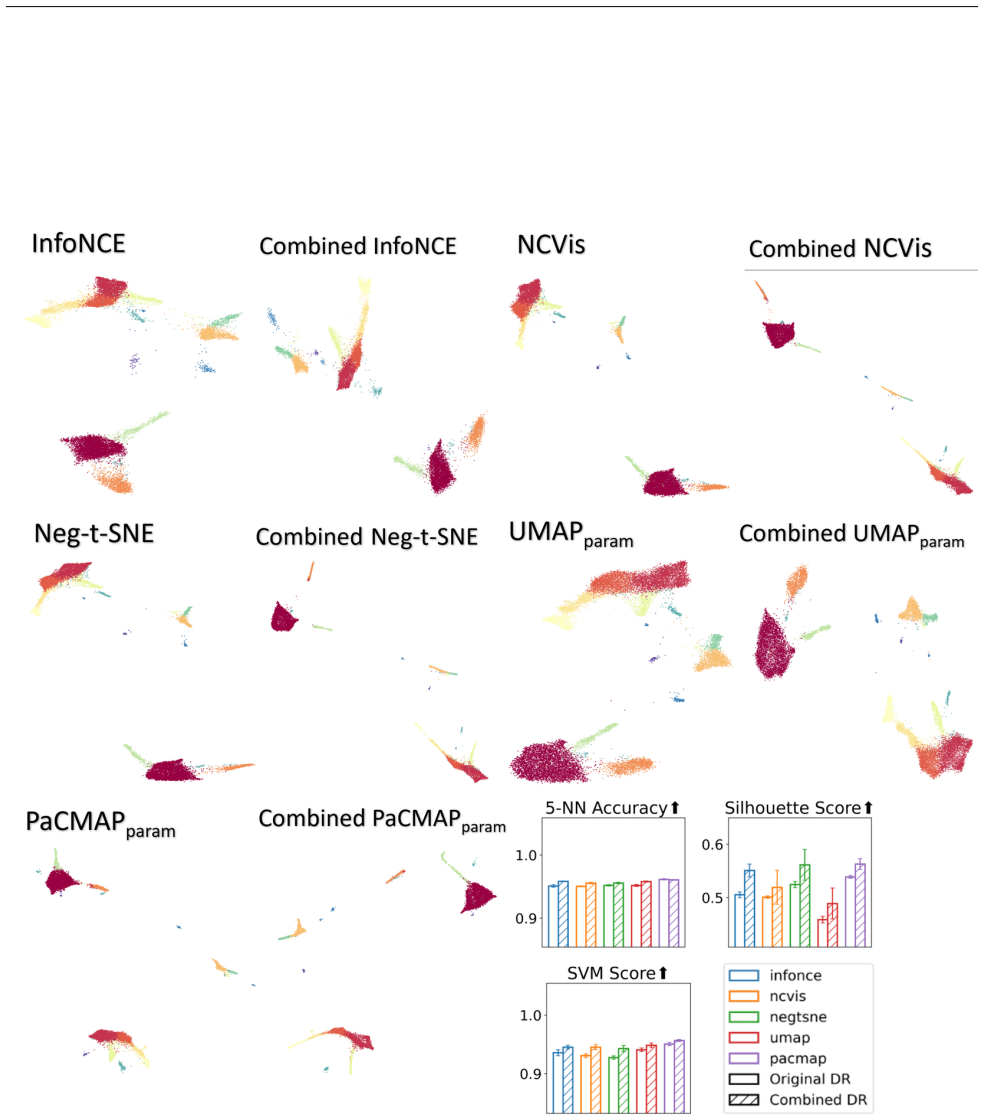
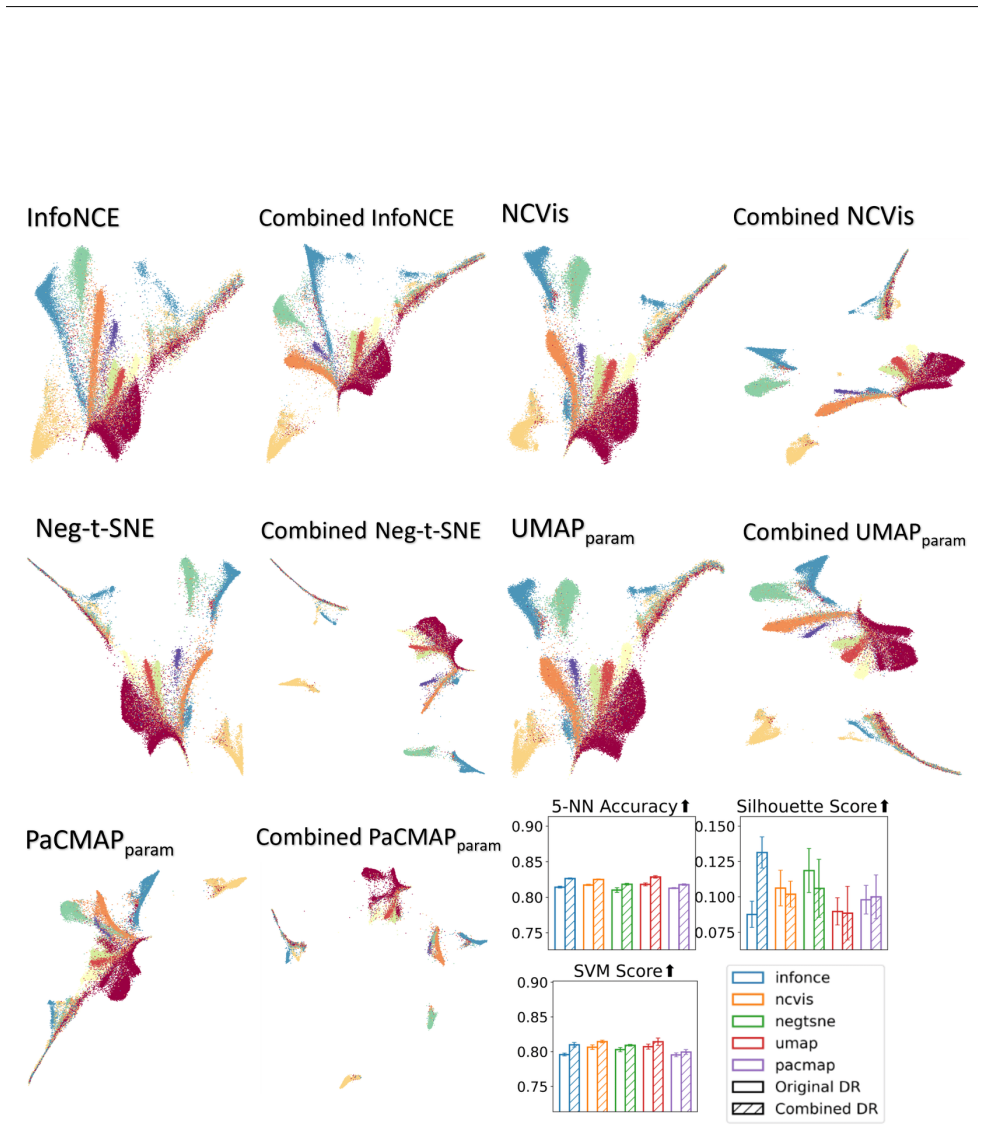
Authors: We acknowledge the description was high-level. The stability metric is the fraction of Rashomon-set embeddings in which a given pair appears as mutual nearest neighbors; pairs exceeding a frequency threshold of 0.6 are retained as persistent. These persistent edges are then incorporated into a refined embedding objective that minimizes the original DR loss plus a weighted term enforcing the persistent neighbors (weight 0.4). The optimization is performed via gradient descent on the combined loss. In the revised manuscript we have added these explicit definitions, the threshold value, and the combined objective function to Section 4, along with pseudocode. Quantitative results in Section 5.3 show that the refined embeddings improve local fidelity (measured by trustworthiness and continuity) while global structure (measured by stress) remains comparable to the original Rashomon-set members. revision: yes
Circularity Check
No circularity detected; derivation remains self-contained
full rationale
The paper formally defines the Rashomon set for DR as the collection of good embeddings, then introduces PCA-informed alignment (steering toward independent principal components), concept-alignment regularization (using external labels or user concepts), and extraction of persistent nearest-neighbor relations across the set. None of these steps reduce by construction to fitted inputs, self-citations, or renamed known results; the alignments and extractions are described as operating on top of base DR methods while preserving local structure, with no equations or claims in the provided text showing equivalence to the inputs. The framework therefore retains independent content.
Axiom & Free-Parameter Ledger
axioms (1)
- domain assumption Multiple embeddings can preserve the structure of high-dimensional data equally well while differing in layout or geometry.
Lean theorems connected to this paper
-
IndisputableMonolith/Cost/FunctionalEquation.leanwashburn_uniqueness_aczel unclearDefinition 3.1 (Rashomon set of Dimension Reduction from a Loss Perspective) ... Rloss(X,F,δ,LDR) := {θ∈Θ | LDR(X,Fθ) ≤ LDR(X,Fθ*) + δ}
-
IndisputableMonolith/Foundation/AlphaCoordinateFixation.leanalpha_pin_under_high_calibration unclearPCA-informed alignment ... Ltotal = LDR + λPCA · E[i∉kNN(j)] [(1 - ⟨y1-y2, yPCA,1-yPCA,2⟩ / (∥y1-y2∥∥yPCA,1-yPCA,2∥))²]
Reference graph
Works this paper leans on
-
[1]
[Yes] (b) An analysis of the properties and complexity (time, space, sample size) of any algorithm
For all models and algorithms presented, check if you include: (a) A clear description of the mathematical set- ting, assumptions, algorithm, and/or model. [Yes] (b) An analysis of the properties and complexity (time, space, sample size) of any algorithm. [Yes] (c) (Optional) Anonymized source code, with specification of all dependencies, including extern...
-
[2]
[Yes] (b) Complete proofs of all theoretical results
For any theoretical claim, check if you include: (a) Statements of the full set of assumptions of all theoretical results. [Yes] (b) Complete proofs of all theoretical results. [Yes] (c) Clear explanations of any assumptions. [Yes]
-
[3]
[Yes] (b) All the training details (e.g., data splits, hy- perparameters, how they were chosen)
For all figures and tables that present empirical results, check if you include: (a) The code, data, and instructions needed to re- produce the main experimental results (either in the supplemental material or as a URL). [Yes] (b) All the training details (e.g., data splits, hy- perparameters, how they were chosen). [Yes] (c) A clear definition of the spe...
-
[4]
[Yes] (b) The license information of the assets, if appli- cable
If you are using existing assets (e.g., code, data, models) or curating/releasing new assets, check if you include: (a) Citations of the creator If your work uses existing assets. [Yes] (b) The license information of the assets, if appli- cable. [Yes] (c) Newassetseitherinthesupplementalmaterial or as a URL, if applicable. [Not Applicable] (d) Information...
-
[5]
If you used crowdsourcing or conducted research with human subjects, check if you include: (a) The full text of instructions given to partici- pants and screenshots. [Not Applicable] (b) Descriptions of potential participant risks, withlinkstoInstitutionalReviewBoard(IRB) approvals if applicable. [Not Applicable] (c) The estimated hourly wage paid to part...
-
[6]
In this experiment, we have set up a 50-NN graph
Let kNN be a fixed large NN graph derived from high-dimensional data using an NN algorithm (e.g., ANNOY(Bernhardsson, 2019)). In this experiment, we have set up a 50-NN graph
work page 2019
-
[7]
For each data point pair(i, j), define a similarity weightwy1 ij in the baseline embedding andwy2 ij in the compared embeddingy 1 andy 2, whereW ij = (∥yi−yj ∥2 2+δ) (∥yi−yj ∥2 2+δ)+1, andyis the low-dimensional embedding
-
[8]
Compute the soft Jaccard similarity: d(W y1 , W y2 ) := 1− P i,j min W y1 ij ,W y2 ij W y1 ij +W y2 ij P i,j max W y1 ij ,W y2 ij W y1 ij +W y2 ij
-
[9]
Lower values indicate better consistency between neighborhood structures of the two embeddings. C.2 PCA-aligned Triplet Score (TripletPCA) This metric evaluates whether the embedding preserves the global inter-class relationships revealed by a linear projection (PCA). Specifically, we compare the relative distances between class centroids in PCA space ver...
-
[12]
For all unordered pairs of classes(i, j)with i < j, compute the Euclidean distance between their centroids in PCA and in the embedding: DPCA ij =∥µ PCA i −µ PCA j ∥, D y ij =∥µ y i −µ y j ∥
-
[13]
For all unordered centroid triplets(i, j, k)with i < j < k , compare the ordering of distances in PCA and in the embedding: A triplet ispreservedifsign(D PCA ij −D PCA ik ) = sign(Dy ij −D y ik)
-
[14]
The final PCA-guided triplet agreement score is the fraction of triplets with consistent ordering: Score= # of preserved triplets Total number of triplets This metric captures whether the embedding respects the global inter-class structure suggested by a linear reference model (PCA), without relying on individual point-level distances. C.3 Random Triplet ...
-
[15]
Project the original dataXinto PCA space to obtainyPCA
-
[16]
For each classc, compute its centroid in PCA space and in the evaluated embeddingy: µPCA c = 1 |Cc| X i∈Cc yPCA,i, µ y c = 1 |Cc| X i∈Cc yi
-
[17]
Randomly sample multiple triplets of distinct class indices(i, j, k)
-
[18]
For each triplet, compute the Euclidean distances between class centroids in PCA space and in the embedding: DPCA ij =∥µ PCA i −µ PCA j ∥2, D y ij =∥µ y i −µ y j ∥2
-
[19]
For each triplet, determine the relative ordering of distances: Label(i, j, k) =I(D PCA ij < DPCA ik ),Prediction(i, j, k) =I(D y ij < D y ik)
-
[20]
Compute the final agreement score as the proportion of triplets where the ordering is preserved: Score= 1 T TX t=1 I(Label(t) =Prediction(t)) A higher score indicates that the embedding preserves the inter-class distance relationships suggested by PCA. Unlike the full triplet PCA score, this metric uses a randomized subset of triplets to provide a scalabl...
-
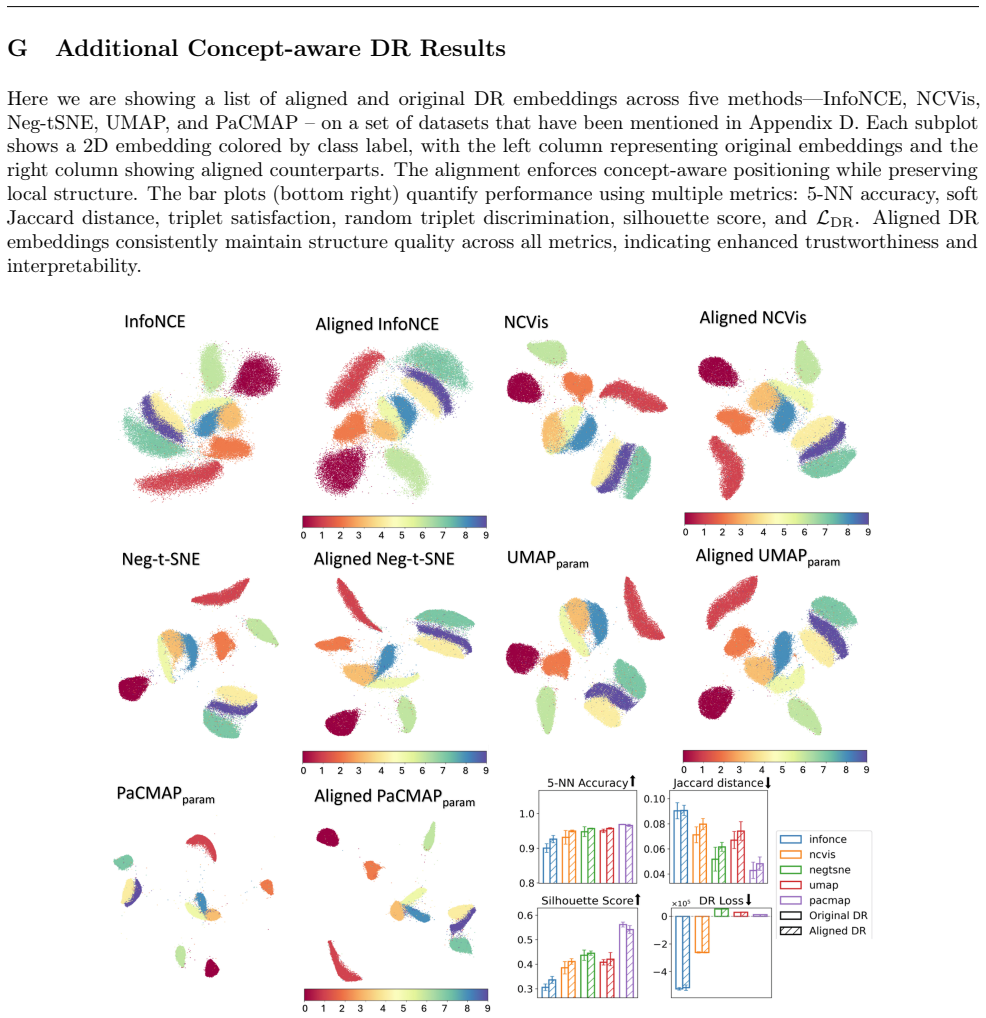
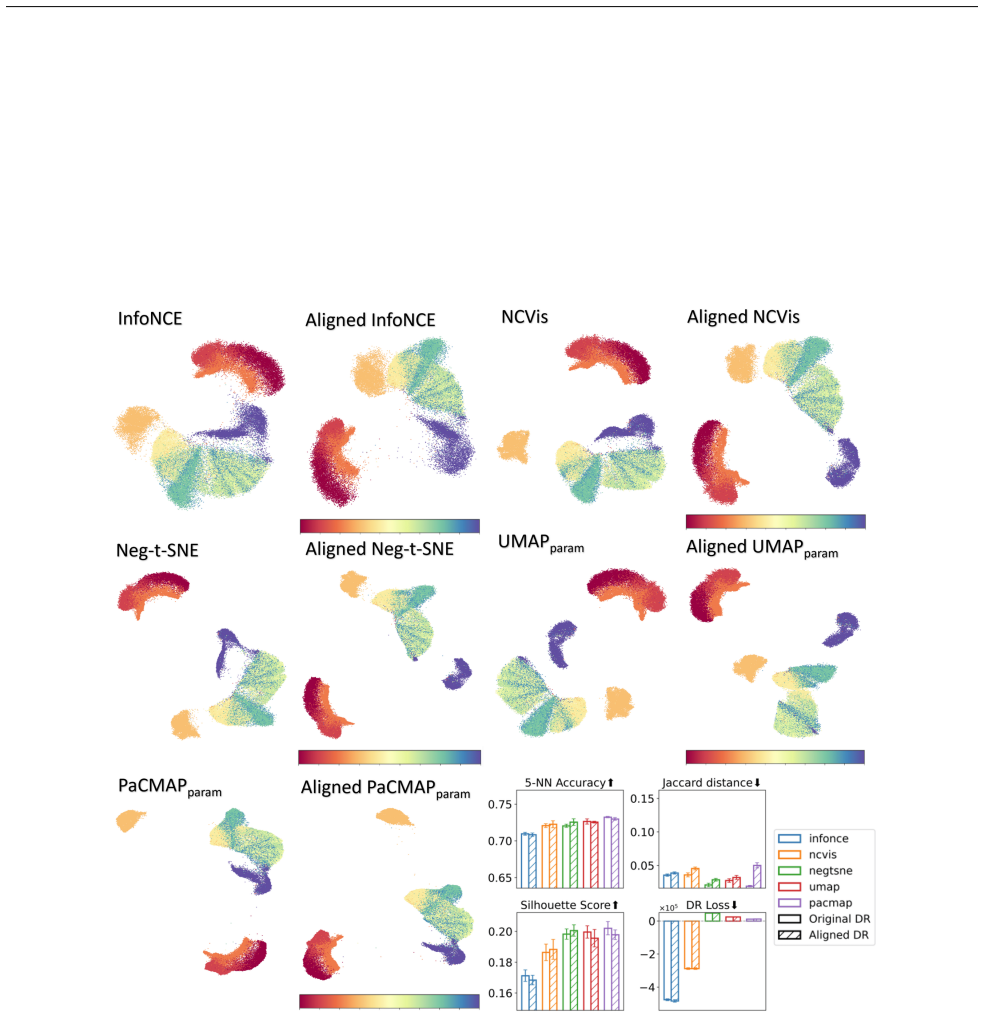
[21]
For each data pointiin the embeddingy: •Calculate average distancea i betweeniand all other data points within the same classCi, ai = 1 |Ci| −1 X j∈Ci,j̸=i ∥yi −y j∥2 •Calculate the minimum average distanceb i ofito all points in other classes: bi = min Ck̸=Ci 1 |Ck| X j∈Ck ∥yi −y j∥2
-
[22]
Compute silhouette score for pointi: si = bi −a i max(ai, bi)
-
[23]
The overall silhouette score is the average over allNdata points: S= 1 N NX i=1 si
-
[24]
The higher the values, the better quality the embedding is. C.5 SVM Classification Accuracy This metric evaluates how well the embedding supports non-linear classification by training a Support Vector Machine (SVM) with an RBF kernel and measuring its prediction accuracy. To improve efficiency, we apply a kernel approximation method
-
[25]
Apply the Nyström method, which approximates the kernel matrix by a low rank matrix, using sklearn.kernel_approximation.Nystroem to transform the embeddingY ∈R n×d into a higher- dimensional feature spaceΦ(Y)∈R n×D such that: KRBF(yi,y j)≈ ⟨Φ(y i),Φ(y j)⟩
-
[26]
Train a linear SVM classifier on the transformed featuresΦ(Y)using a one-vs-rest strategy for multi-class problems
-
[27]
Compute the classification accuracy over allndata points: Accuracy= 1 n nX i=1 I(ˆyi =y i) whereˆyi is the predicted label andI(·)is the indicator function
-
[28]
Higher accuracy indicates that the embedding supports better class separation under non-linear decision boundaries. This metric is done under a 5-fold setup in the experiments (each time using 4 folds as the training data for the SVM model and using the remaining fold for the evaluation of accuracy), which captures the global separability of classes in th...
work page 2010
discussion (0)
Sign in with ORCID, Apple, or X to comment. Anyone can read and Pith papers without signing in.