Recognition: no theorem link
Investigating Data Interventions for Subgroup Fairness: An ICU Case Study
Pith reviewed 2026-05-13 19:30 UTC · model grok-4.3
The pith
Adding data from different ICU sources can both improve and degrade subgroup fairness in clinical models.
A machine-rendered reading of the paper's core claim, the machinery that carries it, and where it could break.
Core claim
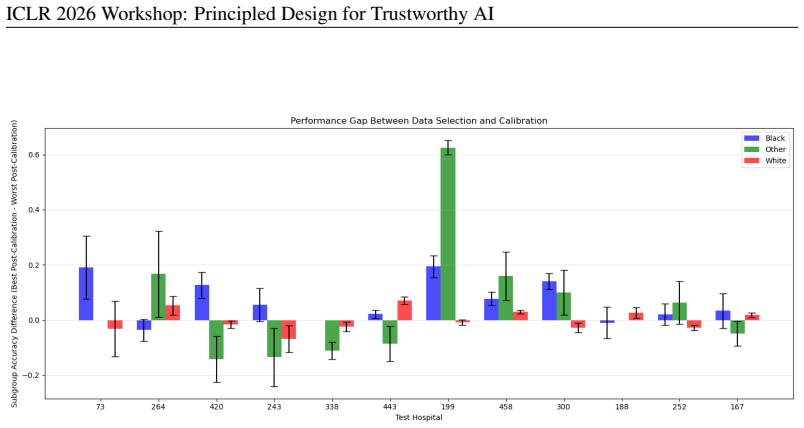
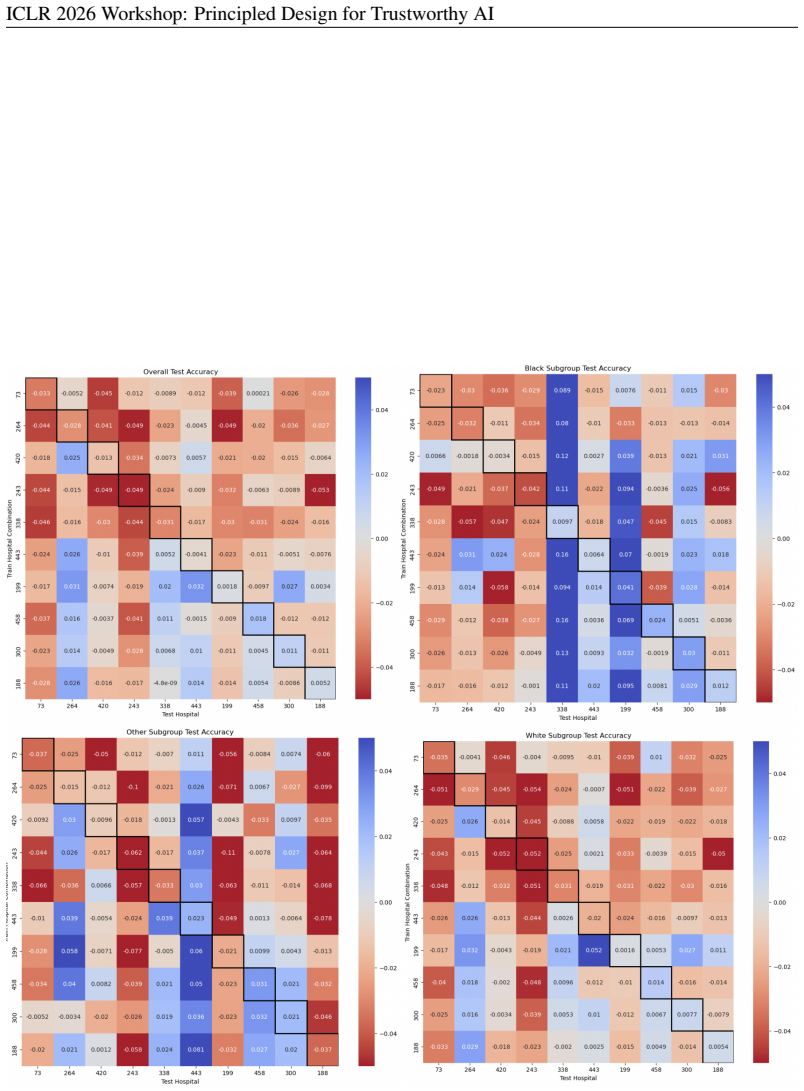
Across the eICU Collaborative Research Database and the MIMIC-IV dataset, data addition can both help and hurt model fairness and performance, and many intuitive strategies for data selection are unreliable. The combination of model-based post-hoc calibration and data-centric addition strategies is important to improve subgroup performance. The work questions the traditional dogma of using more data to overcome fairness challenges in clinical models.
What carries the argument
The interaction of data addition strategies from multiple sources with post-hoc model calibration to address subgroup performance gaps caused by distribution shifts.
If this is right
- Combining records from different hospitals does not reliably improve fairness or performance.
- Common intuitive rules for selecting which data to add often produce unreliable results.
- Post-hoc calibration works better when paired with data interventions than when used in isolation.
- The assumption that more data automatically reduces fairness problems does not hold in these clinical settings.
Where Pith is reading between the lines
- Practitioners in other high-stakes areas may see similar volatility when merging datasets from separate institutions.
- Developers should test multiple data combinations explicitly rather than defaulting to larger pools.
- Better metrics that tie directly to downstream clinical decisions could reduce reliance on current subgroup definitions.
Load-bearing premise
The chosen subgroup definitions and fairness metrics on these two ICU datasets reflect the relevant real-world harms from biased predictions.
What would settle it
A consistent improvement in fairness metrics for all subgroups when adding data from a new hospital source, without any post-hoc calibration and across repeated trials, would falsify the volatility finding.
Figures


read the original abstract
In high-stakes settings where machine learning models are used to automate decision-making about individuals, the presence of algorithmic bias can exacerbate systemic harm to certain subgroups of people. These biases often stem from the underlying training data. In practice, interventions to "fix the data" depend on the actual additional data sources available -- where many are less than ideal. In these cases, the effects of data scaling on subgroup performance become volatile, as the improvements from increased sample size are counteracted by the introduction of distribution shifts in the training set. In this paper, we investigate the limitations of combining data sources to improve subgroup performance within the context of healthcare. Clinical models are commonly trained on datasets comprised of patient electronic health record (EHR) data from different hospitals or admission departments. Across two such datasets, the eICU Collaborative Research Database and the MIMIC-IV dataset, we find that data addition can both help and hurt model fairness and performance, and many intuitive strategies for data selection are unreliable. We compare model-based post-hoc calibration and data-centric addition strategies to find that the combination of both is important to improve subgroup performance. Our work questions the traditional dogma of "better data" for overcoming fairness challenges by comparing and combining data- and model-based approaches.
Editorial analysis
A structured set of objections, weighed in public.
Referee Report
Summary. The paper investigates data addition interventions for improving subgroup fairness in ICU clinical prediction models trained on the eICU Collaborative Research Database and MIMIC-IV. It reports that combining data sources can both help and hurt fairness and performance metrics because sample-size gains are counteracted by distribution shifts, that many intuitive data-selection heuristics are unreliable, and that hybrid use of post-hoc model calibration together with data-centric addition is required to achieve reliable subgroup improvements. The work challenges the assumption that more or 'better' data alone resolves fairness issues in high-stakes healthcare settings.
Significance. If the empirical patterns hold after appropriate controls, the result would be significant for fair ML in healthcare: it supplies concrete evidence that data scaling is volatile in real multi-source EHR settings and that purely data-centric or purely model-centric fixes are each insufficient. The comparison of calibration versus addition strategies offers a practical takeaway for practitioners who must work with imperfect additional data sources.
major comments (3)
- [§4 and §5] §4 (Experiments) and §5 (Results): the central attribution of volatility to distribution shifts is not isolated from changes in subgroup prevalence or label balance. No subsampling to fixed total N, reweighting to preserve subgroup proportions, or explicit reporting of pre/post-addition subgroup sizes and positive rates is described; without these controls the observed help/hurt patterns could be driven by incidental shifts in empirical risk rather than the claimed mechanism.
- [Abstract and §3] Abstract and §3 (Methods): subgroup definitions, fairness metrics (e.g., which disparity measure is primary), and statistical tests are not specified with sufficient detail to allow verification of the directional claims. The abstract states findings without error bars, confidence intervals, or p-values; the full results section must supply these to support the conclusion that intuitive strategies are 'unreliable'.
- [§5.3] §5.3 (Comparison of calibration and addition): the claim that 'the combination of both is important' requires an ablation that holds total training size fixed while varying only the source composition or calibration step. If the hybrid improvement disappears under such a control, the recommendation for combined interventions would need qualification.
minor comments (2)
- [Figures] Figure captions and axis labels should explicitly state the fairness metric plotted and the subgroup definitions used; current presentation leaves some visual comparisons ambiguous.
- [Discussion] The paper should add a short limitations paragraph discussing generalizability beyond the two ICU datasets and the specific clinical tasks examined.
Simulated Author's Rebuttal
We thank the referee for the constructive and detailed comments, which help clarify the presentation and strengthen the empirical claims. We address each major point below and commit to revisions that improve the isolation of mechanisms, statistical rigor, and ablation controls.
read point-by-point responses
-
Referee: [§4 and §5] §4 (Experiments) and §5 (Results): the central attribution of volatility to distribution shifts is not isolated from changes in subgroup prevalence or label balance. No subsampling to fixed total N, reweighting to preserve subgroup proportions, or explicit reporting of pre/post-addition subgroup sizes and positive rates is described; without these controls the observed help/hurt patterns could be driven by incidental shifts in empirical risk rather than the claimed mechanism.
Authors: We agree that the current experiments do not fully isolate distribution shift from changes in subgroup prevalence and label balance. In the revised manuscript we will add (i) subsampling experiments that hold total training N fixed while varying source composition, (ii) explicit tables reporting pre- and post-addition subgroup sizes and positive rates for every condition, and (iii) reweighting analyses that preserve original subgroup proportions. These controls will allow readers to assess whether the observed volatility is attributable to distribution shift as claimed. revision: yes
-
Referee: [Abstract and §3] Abstract and §3 (Methods): subgroup definitions, fairness metrics (e.g., which disparity measure is primary), and statistical tests are not specified with sufficient detail to allow verification of the directional claims. The abstract states findings without error bars, confidence intervals, or p-values; the full results section must supply these to support the conclusion that intuitive strategies are 'unreliable'.
Authors: We acknowledge the lack of detail. In revision we will expand §3 to (a) list the exact subgroup definitions used (age, sex, ethnicity, admission type), (b) designate the primary fairness metric (equalized-odds difference) and secondary metrics, and (c) describe the statistical procedures (bootstrap confidence intervals and paired permutation tests with p-values). The abstract will be updated to reference the presence of error bars and statistical support; all figures and tables in §5 will include 95% CIs and p-values for the key comparisons that underpin the “unreliable” claim. revision: yes
-
Referee: [§5.3] §5.3 (Comparison of calibration and addition): the claim that 'the combination of both is important' requires an ablation that holds total training size fixed while varying only the source composition or calibration step. If the hybrid improvement disappears under such a control, the recommendation for combined interventions would need qualification.
Authors: We accept the need for this control. We will add an ablation in the revised §5.3 that holds total training size constant (by subsampling the pooled dataset to match the size of the single-source baselines) and reports performance with and without post-hoc calibration. The results of this ablation will be presented alongside the original experiments; if the hybrid benefit is not robust, we will qualify the recommendation in both the results and discussion sections. revision: yes
Circularity Check
No circularity: purely empirical evaluation on public datasets
full rationale
The paper performs an empirical study comparing data-addition strategies and post-hoc calibration on eICU and MIMIC-IV datasets. It reports observed effects on fairness and performance metrics without any derivation chain, first-principles predictions, fitted parameters renamed as predictions, or self-citation load-bearing steps. All claims rest on experimental outcomes from standard training and evaluation procedures, with no equations or definitions that reduce to their own inputs by construction.
Axiom & Free-Parameter Ledger
axioms (1)
- domain assumption Subgroup fairness metrics (e.g., equalized odds or demographic parity) are appropriate proxies for real-world harm in ICU settings.
Reference graph
Works this paper leans on
-
[1]
URLhttps://arxiv.org/abs/1907.02893. Anmol Arora, Joseph Alderman, Joanne Palmer, Shaswath Ganapathi, Elinor Laws, Melissa Mc- Cradden, Lauren Oakden-Rayner, Stephen Pfohl, Marzyeh Ghassemi, Francis Mckay, Darren Treanor, Negar Rostamzadeh, Bilal Mateen, Jacqui Gath, Adewole Adebajo, Stephanie Kuku, Rubeta Matin, Katherine Heller, Elizabeth Sapey, and Xia...
work page internal anchor Pith review Pith/arXiv arXiv doi:10.1038/s41591-023-02608-w 1907
-
[2]
doi: 10.1109/ICDMW.2009.83. N. V . Chawla, K. W. Bowyer, L. O. Hall, and W. P. Kegelmeyer. Smote: Synthetic minority over- sampling technique.Journal of Artificial Intelligence Research, 16:321–357, June 2002. ISSN 1076-9757. doi: 10.1613/jair.953. URLhttp://dx.doi.org/10.1613/jair.953. Irene Y . Chen, Fredrik D. Johansson, and David A. Sontag. Why is my ...
-
[3]
Sam Corbett-Davies, Emma Pierson, Avi Feller, Sharad Goel, and Aziz Huq
doi: 10.1503/cmaj.202066. Sam Corbett-Davies, Emma Pierson, Avi Feller, Sharad Goel, and Aziz Huq. Algorithmic de- cision making and the cost of fairness. InProceedings of the 23rd ACM SIGKDD Interna- tional Conference on Knowledge Discovery and Data Mining, KDD ’17, pp. 797–806, New York, NY , USA, 2017. Association for Computing Machinery. ISBN 97814503...
-
[4]
MIMIC-IV , a freely accessible electronic health record dataset,
URLhttps://proceedings.mlr.press/v177/idrissi22a.html. Alistair E. W. Johnson, Lucas Bulgarelli, Lu Shen, Alvin Gayles, Ayad Shammout, Steven Horng, Tom J. Pollard, Sicheng Hao, Benjamin Moody, Brian Gow, Li-wei H. Lehman, Leo A. Celi, and Roger G. Mark. Mimic-iv, a freely accessible electronic health record dataset.Scientific Data, 10(1):1, Jan 2023a. IS...
-
[5]
doi: https://doi.org/10.1016/j.eswa.2021.115667
ISSN 0957-4174. doi: https://doi.org/10.1016/j.eswa.2021.115667. URLhttps: //www.sciencedirect.com/science/article/pii/S0957417421010575. Tom J Pollard, Alistair E W Johnson, Jesse D Raffa, Leo A Celi, Roger G Mark, and Omar Badawi. The eICU Collaborative Research Database, a freely available multi-center database for critical care research.Scientific dat...
-
[6]
recommend using metrics which consider the tradeoff between sensitivity and specificity, such as AUC
When sample sizes from minority groups are especially small, Zhioua et al. recommend using metrics which consider the tradeoff between sensitivity and specificity, such as AUC. D.1 RESULTS ANDANALYSIS Figure 24 shows the change in AUC after data addition compared to the base results. Observing the plots, we see a similar phenomenon as Figure 1 where the p...
work page 2026
discussion (0)
Sign in with ORCID, Apple, or X to comment. Anyone can read and Pith papers without signing in.