Recognition: 2 theorem links
· Lean TheoremOperator-Theoretic Energy Functionals for Impulse-Excited Nonstationary Signal Analysis
Pith reviewed 2026-05-10 19:54 UTC · model grok-4.3
The pith
An operator-theoretic Energy Concentration Index applied to impulse responses detects defects by quantifying localized time-frequency energy shifts.
A machine-rendered reading of the paper's core claim, the machinery that carries it, and where it could break.
Core claim
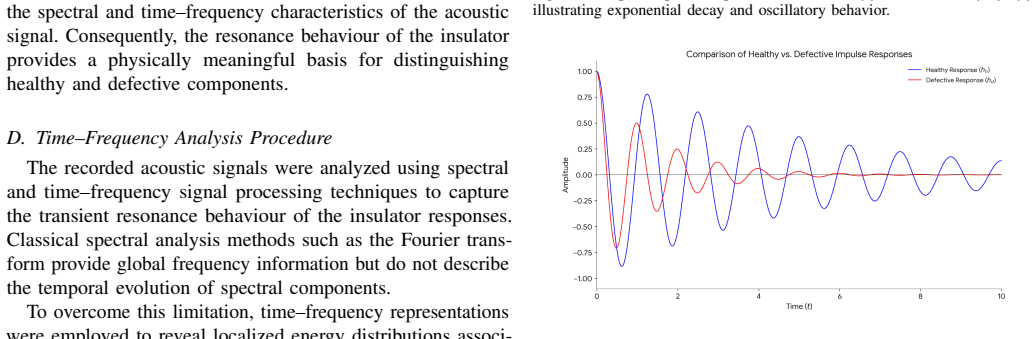
Measured responses are modeled as finite energy impulse responses perturbed by stochastic disturbances in the Hilbert space L2(R). Time frequency representations are formulated as bounded linear analysis operators associated with continuous frames. The nonlinear Energy Concentration Index ECI quantifies localized transform domain energy, and its boundedness and continuity link small physical variations to measurable changes in energy distribution. This enables the Impulse Based Multi Resolution Energy Detector IMRED, which demonstrates strong discriminative capability with an AUC of 0.908 in ceramic defect detection experiments.
What carries the argument
The Energy Concentration Index, a nonlinear functional on time-frequency representations that computes localized energy over selected regions, which enables the link from structural perturbations to statistical classification via its continuity and boundedness properties.
If this is right
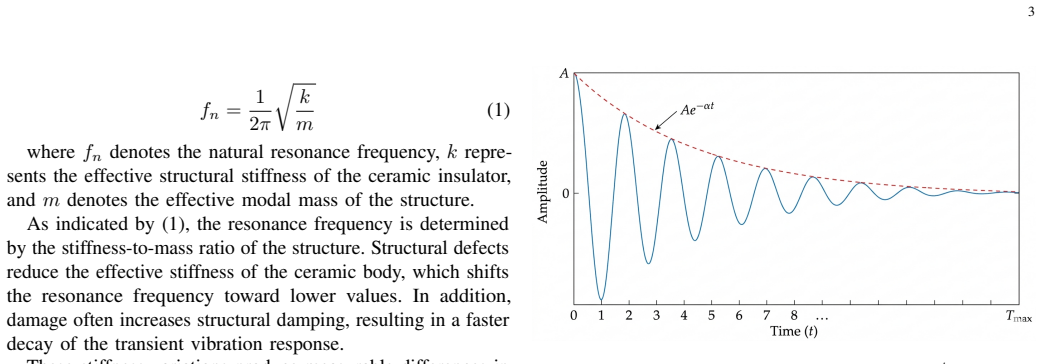
- Variations in damping and resonant frequency produce systematic changes in time frequency coefficients and localized energy concentration.
- The IMRED statistic achieves clearer class separation than global Fourier band energy measures and non optimized wavelet band aggregation.
- The framework establishes a direct relationship between impulse response modeling, localized energy geometry, and statistical decision mechanisms.
- The boundedness of the functional ensures small physical variations produce measurable changes enabling statistical separability.
Where Pith is reading between the lines
- Extending the operator view could allow for adaptive selection of time-frequency regions based on expected defect types.
- The continuity property suggests the method might track gradual degradation in real-time structural health monitoring.
- Similar energy functionals could apply to other nonstationary signals in fields like acoustics or biomedical engineering.
Load-bearing premise
The boundedness and continuity of the Energy Concentration Index ensure that small physical variations in system parameters produce measurable changes in localized energy distribution.
What would settle it
Repeating the ceramic impulse excitation experiments with controlled defects and finding that the IMRED statistic yields an AUC no higher than 0.75 or fails to outperform Fourier measures would falsify the discriminative capability claim.
Figures


read the original abstract
This study presents an operator theoretic framework for defect detection in impulse excited nonstationary systems. Measured responses are modeled as finite energy impulse responses perturbed by stochastic disturbances and represented in the Hilbert space L2(R). Time frequency representations are formulated as bounded linear analysis operators associated with continuous frames, enabling a consistent description of how structural perturbations redistribute transient signal energy. Within this formulation, a nonlinear Energy Concentration Index ECI is introduced to quantify localized transform domain energy over selected regions of the time frequency plane. The boundedness and continuity of the functional ensure that small physical variations in system parameters produce measurable changes in localized energy distribution. This property enables the construction of a statistical separability functional that links multi resolution energy geometry to classification performance. Based on these results, a compact Impulse Based Multi Resolution Energy Detector IMRED is derived. The analysis shows that variations in damping and resonant frequency produce systematic changes in time frequency coefficients and localized energy concentration. Experimental validation using impulse excited ceramic measurements demonstrates that the proposed descriptor captures defect induced structural differences with strong discriminative capability. The resulting IMRED statistic achieves an AUC of 0.908 and provides clearer class separation than global Fourier band energy measures and non optimized wavelet band aggregation. These results establish a direct relationship between impulse response modeling, localized energy geometry, and statistical decision mechanisms, providing a mathematically grounded basis for energy driven defect detection in structural monitoring applications.
Editorial analysis
A structured set of objections, weighed in public.
Referee Report
Summary. The manuscript proposes an operator-theoretic framework for analyzing impulse-excited nonstationary signals to detect defects. Responses are modeled as finite-energy impulse responses in L2(R) perturbed by stochastic disturbances; time-frequency representations are cast as bounded linear analysis operators from continuous frames. A nonlinear Energy Concentration Index (ECI) is defined to quantify localized energy over selected time-frequency regions, with its boundedness and continuity asserted to translate small changes in damping or resonant frequency into measurable energy shifts. From this, the Impulse Based Multi Resolution Energy Detector (IMRED) statistic is derived. Experimental results on impulse-excited ceramic measurements report that IMRED achieves an AUC of 0.908 and clearer class separation than global Fourier band energy or non-optimized wavelet aggregation.
Significance. If the operator construction, continuity claims, and experimental attribution hold, the work would supply a mathematically grounded link between frame-theoretic energy functionals and statistical defect classification in structural monitoring. The explicit use of continuous-frame operators and the derivation of a compact statistic from them are positive features that could support reproducible extensions, but the absence of any modulus of continuity, sensitivity bounds, or controls currently limits the result's impact.
major comments (3)
- [Abstract] Abstract: the claim that 'the boundedness and continuity of the functional ensure that small physical variations in system parameters produce measurable changes in localized energy distribution' is load-bearing for the AUC result, yet no Lipschitz estimate, modulus of continuity, or explicit comparison of ECI variation against the variance of the stochastic disturbances is supplied.
- [Abstract] Abstract: the link from the operator model to the reported IMRED classification performance (AUC 0.908) appears to involve selection of time-frequency regions, but the independence of this selection from the fitted performance metric is not demonstrated, leaving open the possibility that separability arises from post-hoc tuning rather than the asserted functional properties.
- [Abstract] Abstract: the experimental validation states that IMRED 'provides clearer class separation than global Fourier band energy measures and non optimized wavelet band aggregation,' but no quantitative error analysis, cross-validation procedure, or control for dataset-specific artifacts is described, preventing attribution of the AUC gain to the operator-theoretic construction.
minor comments (1)
- [Abstract] The abstract refers to 'non optimized wavelet band aggregation' without specifying the wavelet family, decomposition level, or aggregation rule used as baseline.
Simulated Author's Rebuttal
We thank the referee for the constructive comments. We address each major comment below and will incorporate revisions to strengthen the presentation of the operator-theoretic claims and experimental details.
read point-by-point responses
-
Referee: [Abstract] Abstract: the claim that 'the boundedness and continuity of the functional ensure that small physical variations in system parameters produce measurable changes in localized energy distribution' is load-bearing for the AUC result, yet no Lipschitz estimate, modulus of continuity, or explicit comparison of ECI variation against the variance of the stochastic disturbances is supplied.
Authors: We agree that an explicit quantitative bound would make the continuity claim more precise and directly support the reported AUC. The manuscript establishes continuity of the ECI via the boundedness of the analysis operator and the frame operator properties, but does not supply a modulus of continuity or a direct comparison against disturbance variance. In the revised manuscript we will add a proposition deriving a Lipschitz constant for the ECI under bounded perturbations of damping and resonant frequency, together with a numerical comparison using the observed variance of the stochastic term in the ceramic data. revision: yes
-
Referee: [Abstract] Abstract: the link from the operator model to the reported IMRED classification performance (AUC 0.908) appears to involve selection of time-frequency regions, but the independence of this selection from the fitted performance metric is not demonstrated, leaving open the possibility that separability arises from post-hoc tuning rather than the asserted functional properties.
Authors: The time-frequency regions are chosen according to the known resonant modes of the ceramic specimens, as determined from the physical model and preliminary spectral analysis of the impulse responses. To demonstrate that this choice is not post-hoc, the revision will include an explicit description of the physical selection rule and an ablation table comparing AUC values obtained with the physically motivated regions against those obtained when the regions are instead optimized on the training data. revision: yes
-
Referee: [Abstract] Abstract: the experimental validation states that IMRED 'provides clearer class separation than global Fourier band energy measures and non optimized wavelet band aggregation,' but no quantitative error analysis, cross-validation procedure, or control for dataset-specific artifacts is described, preventing attribution of the AUC gain to the operator-theoretic construction.
Authors: We acknowledge that the experimental section would benefit from greater detail on validation and controls. The revision will expand the experimental validation to specify the cross-validation procedure used to obtain the AUC, report variability measures across repetitions, and describe the normalization and artifact-control steps applied to the impulse-excited measurements. These additions will allow clearer attribution of the observed separation to the proposed energy-concentration functional. revision: yes
Circularity Check
No significant circularity; derivation is self-contained with independent experimental validation
full rationale
The paper constructs an operator-theoretic model using continuous frames on L2(R), defines the nonlinear ECI functional on localized time-frequency regions, asserts its boundedness/continuity from the analysis-operator properties, derives the IMRED statistic from that geometry, and reports an independent experimental AUC of 0.908 on ceramic impulse-response data. No equation or claim reduces a reported performance metric to a fitted parameter by construction, no self-citation supplies a load-bearing uniqueness theorem, and the experimental separability is presented as external confirmation rather than a tautological output of the definitions. The theoretical steps remain independent of the classification numbers.
Axiom & Free-Parameter Ledger
invented entities (2)
-
Energy Concentration Index (ECI)
no independent evidence
-
Impulse Based Multi Resolution Energy Detector (IMRED)
no independent evidence
Lean theorems connected to this paper
-
IndisputableMonolith/Cost/FunctionalEquationwashburn_uniqueness_aczel unclearDefinition 1: The Energy Concentration Index (ECI) of a signal x(t)∈L2(R) over Ω is defined as ECIΩ(x)=∫_Ω |Wx(a,b)|² db da/a².
-
IndisputableMonolith/Foundation/AbsoluteFloorClosureabsolute_floor_iff_bare_distinguishability unclearThe boundedness and continuity of the functional ensure that small physical variations in system parameters produce measurable changes in localized energy distribution.
Reference graph
Works this paper leans on
-
[1]
Y . Jiang, X.-Y . Wang, X.-L. Zhang,et al., “Instantaneous frequency identification for nonstationary signals of time-varying structures using enhanced synchroextracting wavelet transform and dynamic optimiza- tion,”J. Low Freq. Noise Vib. Act. Control, vol. 43, 2024, doi: 10.1177/14613484241233392
-
[2]
N. Wachowski and M. R. Azimi–Sadjadi, “Detection and classification of nonstationary transient signals using sparse approximations and Bayesian networks,”IEEE/ACM Trans. Audio, Speech, Lang. Process., vol. 22, no. 12, pp. 1750–1764, Dec. 2014, doi: 10.1109/TASLP.2014.2348913
-
[4]
J. Wu, J. Hu, M. Ma, C. Zhang, Z. Ma, C. Zhou, and G. Sun, “Modal parameter identification using improved random decrement and stochastic subspace methods under non-stationary excitation,”Mech. Syst. Signal Process., vol. 205, p. 110987, 2024, doi: 10.1016/j.ymssp.2023.110987
-
[5]
W. Lei, Y . Jiang, and J. Zhang, “Hybrid time–frequency method for vibration fatigue damage analysis under non-stationary non- Gaussian random excitation,”Mech. Syst. Signal Process., 2025, doi: 10.1016/j.ymssp.2025.112630
-
[7]
Synchrosqueezed wavelet transforms: An empirical mode decomposition-like tool,
I. Daubechies, J. Lu, and H.-T. Wu, “Synchrosqueezed wavelet transforms: An empirical mode decomposition-like tool,”Appl. Comput. Harmon. Anal., vol. 30, no. 2, pp. 243–261, 2011, doi: 10.1016/j.acha.2010.08.002
-
[8]
Adaptive variational mode decomposition for multicomponent non-stationary signal analysis,
S. Yu, X. Zhang, and Y . Chen, “Adaptive variational mode decomposition for multicomponent non-stationary signal analysis,”Signal Process., vol. 208, p. 108007, 2023, doi: 10.1016/j.sigpro.2023.108007
-
[9]
T. Nguyen and M. Khoa, “Stochastic time–frequency modeling of non-stationary structural responses under random excitation,” Mech. Syst. Signal Process., vol. 205, p. 111045, 2024, doi: 10.1016/j.ymssp.2023.111045
-
[10]
Three- dimensional defect reconstruction in carbon fiber–reinforced composites with temporally non-uniform pulsed thermography data,
L. Gahleitner, G. Mayr, P. Burgholzer, and U. Cakmak, “Three- dimensional defect reconstruction in carbon fiber–reinforced composites with temporally non-uniform pulsed thermography data,”NDT&E Int., vol. 154, p. 103363, 2025
2025
-
[11]
Ultrasonic characterization of degradation in lithium-ion batteries using guided waves,
Y . Zhang, M. Feng, and K. Wang, “Ultrasonic characterization of degradation in lithium-ion batteries using guided waves,”Ultrasonics, vol. 134, p. 107036, 2024, doi: 10.1016/j.ultras.2023.107036
-
[12]
A. Kamariotis, K. Vlachas, V . Ntertimanis, I. Koune, A. Cicirello, and E. Chatzi, “On the Consistent Classification and Treatment of Uncertainties in Structural Health Monitoring Applications,”ASCE– ASME J. Risk Uncertainty Eng. Syst., Part B, vol. 11, no. 1, p. 011108, 2025, doi: 10.1115/1.4067140
-
[13]
Vertex-frequency graph signal processing: A comprehensive review,
L. Stankovi ´c, D. Mandic, M. Dakovi ´c, B. Scalzo, M. Brajovi ´c, and E. Sejdi ´c, “Vertex-frequency graph signal processing: A comprehensive review,”Digit. Signal Process., vol. 102, p. 102756, 2020
2020
-
[14]
Spectral analysis for current and temperature measurements in power cables,
S. Tas ¸kın, S. S ¸eker, M. Karahan, and T. C. Akinci, “Spectral analysis for current and temperature measurements in power cables,”Electric Power Components and Systems, vol. 37, no. 4, pp. 415–426, 2009, doi: 10.1080/15325000902740852
-
[15]
H. Zhou, Y . Liu, and J. Li, “Frequency-domain characterization of aging effects in XLPE power cables using dielectric response analysis,” IEEE Trans. Power Del., vol. 35, no. 6, pp. 2634–2643, 2020, doi: 10.1109/TPWRD.2020.2981234
-
[16]
A. V . Oppenheim and A. S. Willsky,Signals and Systems, 2nd ed., Prentice Hall, 1997
1997
-
[17]
Transient vibration feature extraction using time-varying filtering empirical mode decomposi- tion,
Y . Huang, Z. Zhang, and J. Yang, “Transient vibration feature extraction using time-varying filtering empirical mode decomposi- tion,”Mech. Syst. Signal Process., vol. 168, p. 108653, 2022, doi: 10.1016/j.ymssp.2021.108653. 11
-
[18]
Q. Li, Y . Zhang, and H. Liu, “Incipient fault detection in power distribution systems: A time–frequency embedded deep-learning-based approach,”IEEE Trans. Instrum. Meas., vol. 72, Art. no. 2507914, 2023, doi: 10.1109/TIM.2023.3271234
-
[19]
J. Zhang, Y . Zhou, and H. Wang, “Arc fault detection based on time– frequency characteristics and deep learning in low-voltage electrical systems,”IEEE Trans. Plasma Sci., vol. 51, no. 2, pp. 345–356, 2023, doi: 10.1109/TPS.2023.3234567
-
[20]
Time-frequency analysis of arc welding current,
T. C. Akinci, “Time-frequency analysis of arc welding current,”Mechan- ics, vol. 85, no. 5, pp. 66–71, 2010
2010
-
[21]
T. C. Akinci, “The defect detection in ceramic materials based on time- frequency analysis by using the method of impulse noise,”Archives of Acoustics, vol. 36, no. 1, pp. 77–85, 2011, doi: 10.2478/v10168-011- 0007-y
-
[22]
Y . Liu, H. Xiang, Z. Jiang, and J. Xiang, “Iterative synchrosqueezing- based general linear chirplet transform for time-frequency feature extraction,”IEEE Trans. Instrum. Meas., vol. 72, Art. no. 3506711, 2023, doi: 10.1109/TIM.2022.3232090
-
[23]
R. Meng, J. Zhang, M. Chen, and L. Chen, “Fault diagnosis method of planetary gearboxes based on multi-scale wavelet packet energy entropy and extreme learning machine,”Entropy, vol. 27, no. 8, p. 782, 2025, doi: 10.3390/e27080782
-
[24]
F. Auger and P. Flandrin, “Improving the readability of time-frequency and time-scale representations by the reassignment method,”IEEE Trans. Signal Process., vol. 43, no. 5, pp. 1068–1089, May 1995, doi: 10.1109/78.382394
-
[25]
A signal-dependent time–frequency representation: optimal kernel design,
R. G. Baraniuk and D. L. Jones, “A signal-dependent time–frequency representation: optimal kernel design,”IEEE Trans. Signal Process., vol. 41, no. 4, pp. 1589–1602, Apr. 1993, doi: 10.1109/78.212733
-
[26]
Y . LeCun, Y . Bengio, and G. Hinton, “Deep learning,”Nature, vol. 521, pp. 436–444, May 2015, doi: 10.1038/nature14539
-
[27]
Support vector machine-based classifica- tion scheme for myoelectric control applied to upper limb,
M. A. Oskoei and H. Hu, “Support vector machine-based classifica- tion scheme for myoelectric control applied to upper limb,”IEEE Trans. Biomed. Eng., vol. 55, no. 8, pp. 1956–1965, Aug. 2008, doi: 10.1109/TBME.2008.919734
-
[28]
Analysis of gait dynamics of ALS disease and classification using artificial neural networks,
O. Akgun, A. Akan, H. Demir, and T. C. Akinci, “Analysis of gait dynamics of ALS disease and classification using artificial neural networks,”Tehni ˇcki vjesnik, vol. 25, no. 5, pp. 1495–1502, 2018, doi: 10.17559/TV-20160914144554
-
[29]
P. Khetarpal, N. Nagpal, M. S. Al-Numay, P. Siano, Y . Arya, and N. Kassarwani, “Power quality disturbances detection and classification based on deep convolution auto-encoder networks,”IEEE Access, vol. 11, pp. 46026–46038, 2023, doi: 10.1109/ACCESS.2023.3274732
-
[30]
Deep learning and its applications to machine health monitoring,
R. Zhao, R. Yan, Z. Chen, K. Mao, P. Wang, and R. X. Gao, “Deep learning and its applications to machine health monitoring,” Mech. Syst. Signal Process., vol. 115, pp. 213–237, Jan. 2019, doi: 10.1016/j.ymssp.2018.05.050
-
[31]
L. E. S. Salgado Solano, O. A. C ´ardenas, L. M. F. Nava, and F. G. Casta ˜neda, “Convolutional neural network for multi-channel vibrational analysis applied to bearing fault detection,” inProc. 22nd Int. Conf. Electrical Engineering, Computing Science and Au- tomatic Control (CCE), Mexico City, Mexico, 2025, pp. 1–6, doi: 10.1109/CCE67728.2025.11271968
-
[32]
Detection of power quality disturbances using wavelet-based convolutional transformer network,
D. H. Chiam, K. H. Lim, and K. H. Law, “Detection of power quality disturbances using wavelet-based convolutional transformer network,” inProc. 2022 Int. Conf. Green Energy, Computing and Sustainable Technology (GECOST), Miri Sarawak, Malaysia, 2022, pp. 150–154, doi: 10.1109/GECOST55694.2022.10010655
-
[33]
J. Song, Y . Wang, Y . Gao, H. Ye, D. Fang, X. Wang, Z. Hu, and S. Lu, “Power quality disturbances recognition via lightweight deep learning framework integrated with time-frequency analysis embedded,”IEEE Trans. Instrum. Meas., vol. 74, pp. 1–14, 2025, Art. no. 3560914, doi: 10.1109/TIM.2025.3615304
-
[34]
D. J. Inman,Engineering Vibration, 4th ed., Pearson, 2014
2014
-
[35]
Response of dynamical systems to nonstationary inputs,
L. Galleani, “Response of dynamical systems to nonstationary inputs,” IEEE Trans. Signal Process., vol. 60, no. 11, pp. 5775–5786, Nov. 2012, doi: 10.1109/TSP.2012.2214032
-
[36]
S. S. Rao,Mechanical Vibrations, 5th ed., Prentice Hall, 2011
2011
-
[37]
S. W. Doebling, C. R. Farrar, M. B. Prime, and D. W. Shevitz, “Damage identification and health monitoring of structural and mechanical systems: A literature review,” Los Alamos National Laboratory, Rep. LA-13070- MS, 1996, doi: 10.2172/249299
-
[38]
B. P. Lathi,Linear Systems and Signals, 2nd ed., Oxford Univ. Press, 2005
2005
-
[39]
Mallat,A Wavelet Tour of Signal Processing, 3rd ed., Academic Press, 2009
S. Mallat,A Wavelet Tour of Signal Processing, 3rd ed., Academic Press, 2009
2009
-
[40]
Papoulis and S
A. Papoulis and S. U. Pillai,Probability, Random Variables, and Stochastic Processes, 4th ed., McGraw-Hill, 2002
2002
discussion (0)
Sign in with ORCID, Apple, or X to comment. Anyone can read and Pith papers without signing in.