Recognition: 2 theorem links
· Lean TheoremFrom Uniform to Learned Knots: A Study of Spline-Based Numerical Encodings for Tabular Deep Learning
Pith reviewed 2026-05-10 19:40 UTC · model grok-4.3
The pith
The effectiveness of numerical encodings for continuous features in tabular deep learning depends strongly on the task type, output size, and model backbone.
A machine-rendered reading of the paper's core claim, the machinery that carries it, and where it could break.
Core claim
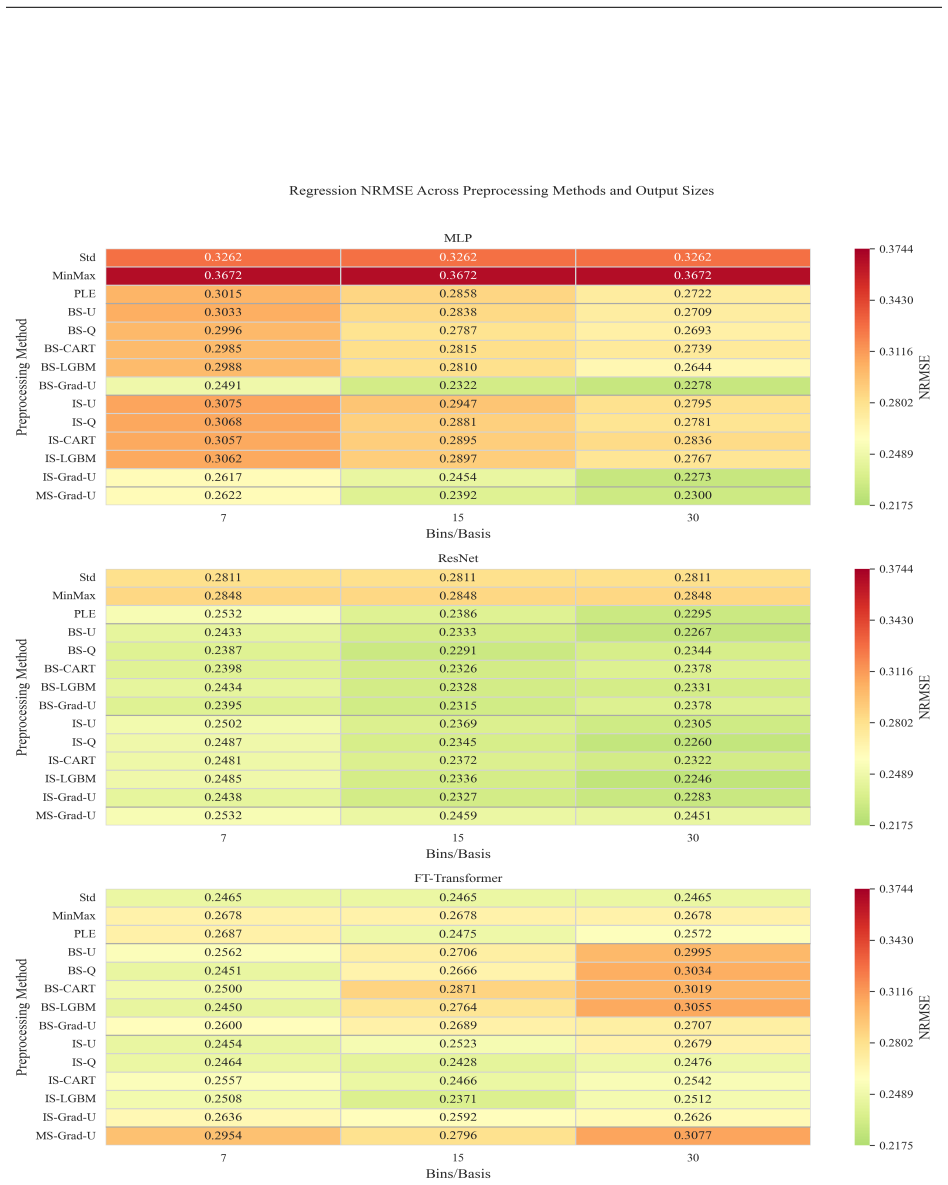
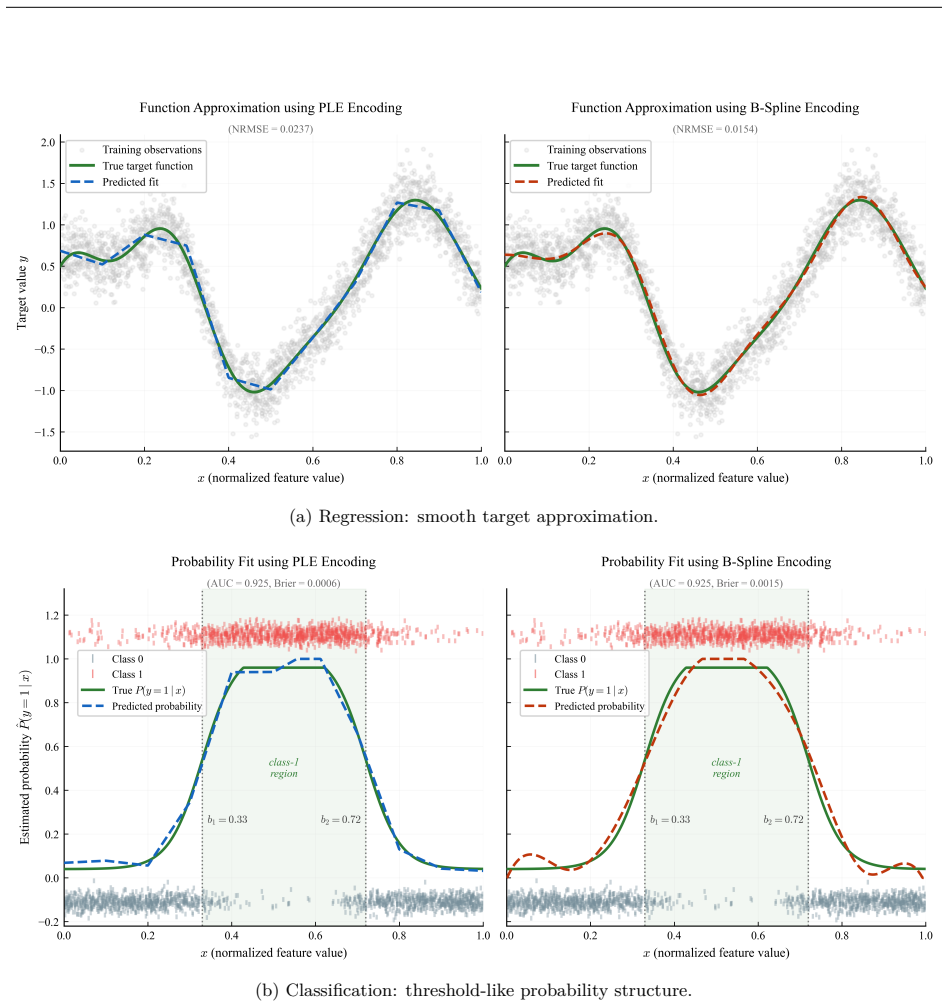
We investigate three spline families for encoding numerical features, namely B-splines, M-splines, and integrated splines (I-splines), under uniform, quantile-based, target-aware, and learnable-knot placement. For the learnable-knot variants, we use a differentiable knot parameterization that enables stable end-to-end optimization of knot locations jointly with the backbone. Our results show that the effect of numerical encodings depends strongly on the task, output size, and backbone. For classification, piecewise-linear encoding (PLE) is the most robust choice overall, while spline-based encodings remain competitive. For regression, no single encoding dominates uniformly. Instead, the best
What carries the argument
Spline-based numerical encodings using B-splines, M-splines, or I-splines with four knot-placement strategies, including a differentiable parameterization for learnable knots that allows joint optimization with the network.
If this is right
- Piecewise-linear encoding is the most consistent performer for classification tasks across the tested backbones.
- For regression tasks the preferred spline family and knot strategy change with output size and backbone, with larger improvements seen for MLP and ResNet than for FT-Transformer.
- Learnable-knot variants can be trained stably but raise training cost substantially for M-spline and I-spline expansions.
- Numerical encodings should be chosen and evaluated with attention to both predictive accuracy and computational overhead.
- No single encoding strategy can be recommended as default for all tabular deep-learning problems.
Where Pith is reading between the lines
- Practitioners should benchmark a small set of encodings on their specific task and model rather than adopting one default method.
- The extra cost of learnable knots makes them attractive mainly when accuracy gains are large enough to offset longer training times.
- Hybrid schemes that learn knots only for a subset of features could reduce overhead while retaining most of the benefit.
- Similar task- and architecture-dependent behavior may appear in other continuous-feature representations such as learned embeddings or Fourier features.
Load-bearing premise
The diverse collection of public datasets and the three chosen backbones are representative enough to support general statements about how encoding performance depends on task, output size, and architecture.
What would settle it
A follow-up experiment on a new collection of tabular datasets or with additional backbone architectures in which the relative ranking of encodings stays roughly the same regardless of task type or output size would contradict the reported dependence.
Figures


read the original abstract
Numerical preprocessing remains an important component of tabular deep learning, where the representation of continuous features can strongly affect downstream performance. Although its importance is well established for classical statistical and machine learning models, the role of explicit numerical preprocessing in tabular deep learning remains less well understood. In this work, we study this question with a focus on spline-based numerical encodings. We investigate three spline families for encoding numerical features, namely B-splines, M-splines, and integrated splines (I-splines), under uniform, quantile-based, target-aware, and learnable-knot placement. For the learnable-knot variants, we use a differentiable knot parameterization that enables stable end-to-end optimization of knot locations jointly with the backbone. We evaluate these encodings on a diverse collection of public regression and classification datasets using MLP, ResNet, and FT-Transformer backbones, and compare them against common numerical preprocessing baselines. Our results show that the effect of numerical encodings depends strongly on the task, output size, and backbone. For classification, piecewise-linear encoding (PLE) is the most robust choice overall, while spline-based encodings remain competitive. For regression, no single encoding dominates uniformly. Instead, performance depends on the spline family, knot-placement strategy, and output size, with larger gains typically observed for MLP and ResNet than for FT-Transformer. We further find that learnable-knot variants can be optimized stably under the proposed parameterization, but may substantially increase training cost, especially for M-spline and I-spline expansions. Overall, the results show that numerical encodings should be assessed not only in terms of predictive performance, but also in terms of computational overhead.
Editorial analysis
A structured set of objections, weighed in public.
Referee Report
Summary. The manuscript presents an empirical study of spline-based numerical encodings for continuous features in tabular deep learning. It examines B-splines, M-splines, and I-splines with uniform, quantile-based, target-aware, and learnable knot placements (using a differentiable parameterization for the latter). These are evaluated on a collection of public regression and classification datasets using MLP, ResNet, and FT-Transformer backbones, and compared against baselines including piecewise-linear encoding (PLE). The central claims are that the effect of encodings depends strongly on task type, output size, and backbone; PLE is the most robust choice for classification while spline encodings remain competitive; for regression no single encoding dominates uniformly, with larger gains for MLP/ResNet than FT-Transformer; and learnable-knot variants can be optimized stably but increase training cost.
Significance. If the results hold under broader validation, this work would be significant for the tabular deep learning community by supplying concrete empirical guidance on numerical preprocessing choices, an understudied but practically important component. It demonstrates that no universal encoding exists and quantifies trade-offs with computational overhead, while showing that learnable knots are feasible. The multi-backbone, multi-task evaluation adds useful benchmarking data and could inform future architecture-specific preprocessing strategies.
major comments (2)
- [§4 (Experimental Setup)] §4 (Experimental Setup): The central claims of 'strong dependence' on task/output size/backbone and PLE robustness for classification rest on the representativeness of the 'diverse collection of public datasets' and the three chosen backbones. No quantitative coverage metrics (feature-count ranges, sample-size distributions, domain tags, or ablation on additional architectures) are supplied to justify generalization beyond the specific selection, which is load-bearing for the reported patterns.
- [Results section] Results section: The comparative performance claims (e.g., PLE as most robust overall for classification, variable gains for regression) are presented without reference to statistical testing, error bars from repeated runs, or explicit hyperparameter-selection and implementation details. This limits verification of the magnitude and reliability of the observed differences.
minor comments (2)
- [Abstract] The abstract is concise but would benefit from stating the number of datasets and a one-sentence quantitative highlight of the largest observed gains.
- A consolidated table summarizing all encoding variants, knot strategies, and their computational characteristics would improve readability of the experimental design.
Simulated Author's Rebuttal
Thank you for the opportunity to respond to the referee's report. We address the major comments point by point below, indicating where revisions will be made to the manuscript.
read point-by-point responses
-
Referee: The central claims of 'strong dependence' on task/output size/backbone and PLE robustness for classification rest on the representativeness of the 'diverse collection of public datasets' and the three chosen backbones. No quantitative coverage metrics (feature-count ranges, sample-size distributions, domain tags, or ablation on additional architectures) are supplied to justify generalization beyond the specific selection, which is load-bearing for the reported patterns.
Authors: We thank the referee for highlighting this important point regarding the generalizability of our findings. While the manuscript describes the datasets as a 'diverse collection,' we agree that explicit quantitative metrics would strengthen the justification. In the revised version, we will add a supplementary table detailing the number of features, sample sizes, and domain tags for each dataset used. This will allow readers to assess the coverage. For the backbones, our choice of MLP, ResNet, and FT-Transformer covers a range from simple to state-of-the-art tabular models. However, we acknowledge the lack of ablation on additional architectures such as TabNet or other transformers. We will include a discussion of this limitation in the revised manuscript and note that extending the evaluation is left for future work. We believe the patterns observed are robust within the studied scope. revision: partial
-
Referee: The comparative performance claims (e.g., PLE as most robust overall for classification, variable gains for regression) are presented without reference to statistical testing, error bars from repeated runs, or explicit hyperparameter-selection and implementation details. This limits verification of the magnitude and reliability of the observed differences.
Authors: We agree that the presentation of results can be improved with additional statistical rigor. In the revised manuscript, we will include error bars representing standard deviations from repeated experiments with different random seeds. We will also provide more details on the hyperparameter optimization procedure in the appendix, including the search spaces used for each encoding and backbone. Regarding statistical testing, we will perform and report t-tests or similar to assess the significance of performance differences where appropriate. These additions will help verify the reliability of the comparative claims without changing the overall conclusions. revision: yes
Circularity Check
No significant circularity: empirical benchmarking study with no derivations or self-referential reductions
full rationale
This is a pure empirical study that evaluates spline-based encodings (B-splines, M-splines, I-splines) under various knot placements against baselines on public regression and classification datasets using MLP, ResNet, and FT-Transformer backbones. No mathematical derivations, fitted parameters renamed as predictions, self-definitional equations, or load-bearing self-citations appear in the text. All claims rest on externally falsifiable experimental results rather than reducing to inputs by construction. The paper is self-contained against external benchmarks, warranting a score of 0.
Axiom & Free-Parameter Ledger
axioms (1)
- domain assumption Standard assumptions in machine learning about data distribution, model optimization stability, and the validity of gradient-based training.
Lean theorems connected to this paper
-
IndisputableMonolith/Cost/FunctionalEquation.leanwashburn_uniqueness_aczel unclear?
unclearRelation between the paper passage and the cited Recognition theorem.
We investigate three spline families... under uniform, quantile-based, target-aware, and learnable-knot placement... evaluate... on a diverse collection of public regression and classification datasets using MLP, ResNet, and FT-Transformer backbones
-
IndisputableMonolith/Foundation/AlphaCoordinateFixation.leanalpha_pin_under_high_calibration unclear?
unclearRelation between the paper passage and the cited Recognition theorem.
learnable-knot variants... differentiable knot parameterization... softmax followed by cumulative summation
What do these tags mean?
- matches
- The paper's claim is directly supported by a theorem in the formal canon.
- supports
- The theorem supports part of the paper's argument, but the paper may add assumptions or extra steps.
- extends
- The paper goes beyond the formal theorem; the theorem is a base layer rather than the whole result.
- uses
- The paper appears to rely on the theorem as machinery.
- contradicts
- The paper's claim conflicts with a theorem or certificate in the canon.
- unclear
- Pith found a possible connection, but the passage is too broad, indirect, or ambiguous to say the theorem truly supports the claim.
Reference graph
Works this paper leans on
-
[2]
Jimmy Lei Ba, Jamie Ryan Kiros, and Geoffrey E
URLhttp://arxiv.org/abs/1908.07442. Jimmy Lei Ba, Jamie Ryan Kiros, and Geoffrey E. Hinton. Layer normalization,
-
[3]
URLhttps: //arxiv.org/abs/1607.06450. Barry Becker and Ronny Kohavi. Adult. UCI Machine Learning Repository,
work page internal anchor Pith review Pith/arXiv arXiv
-
[4]
DOI: https://doi.org/10.24432/C5XW20. Pakshal Bohra, Joaquim Campos, Harshit Gupta, Shayan Aziznejad, and Michael Unser. Learning activation functions in deep (spline) neural networks.IEEE Open Journal of Signal Processing, 1:295–309,
-
[5]
Vadim Borisov, Tobias Leemann, Kathrin Seßler, Johannes Haug, Martin Pawelczyk, and Gjergji Kasneci
doi: 10.1109/OJSP.2020.3039379. Vadim Borisov, Tobias Leemann, Kathrin Seßler, Johannes Haug, Martin Pawelczyk, and Gjergji Kasneci. Deep neural networks and tabular data: A survey.IEEE Transactions on Neural Networks and Learning Systems, 35(6):7499–7519, June
-
[6]
doi: 10.1109/tnnls.2022.3229161
ISSN 2162-2388. doi: 10.1109/tnnls.2022.3229161. URLhttp: //dx.doi.org/10.1109/TNNLS.2022.3229161. Mohamed Bouadi, Pratinav Seth, Aditya Tanna, and Vinay Kumar Sankarapu. Orion-msp: Multi-scale sparse attention for tabular in-context learning.arXiv preprint arXiv:2511.02818,
-
[7]
Association for Computing Machinery. ISBN 9781450342322. doi: 10.1145/2939672. 2939785. URLhttps://doi.org/10.1145/2939672.2939785. Paulo Cortez, A. Cerdeira, F. Almeida, T. Matos, and J. Reis. Wine Quality. UCI Machine Learning Repository,
-
[8]
DOI: https://doi.org/10.24432/C56S3T. C. de Boor. On calculating with b-splines.Journal of Approximation Theory, 6:50–62,
-
[9]
URLhttps://doi.org/10.1214/ss/1038425655
doi: 10.1214/ss/1038425655. URLhttps://doi.org/10.1214/ss/1038425655. Ali Eslamian, Alireza Afzal Aghaei, and Qiang Cheng. Tabkan: Advancing tabular data analysis us- ing kolmogorov-arnold network.Machine Learning for Computational Science and Engineering, 1(2), November
-
[10]
doi: 10.1007/s44379-025-00042-y
ISSN 3005-1436. doi: 10.1007/s44379-025-00042-y. URLhttp://dx.doi.org/10.1007/ s44379-025-00042-y. Benjamin Feuer, Robin T Schirrmeister, Valeriia Cherepanova, Chinmay Hegde, Frank Hutter, Micah Gold- blum, Niv Cohen, and Colin White. Tunetables: Context optimization for scalable prior-data fitted networks.Advances in Neural Information Processing Systems...
-
[11]
TabPFN-2.5: Advancing the State of the Art in Tabular Foundation Models
Léo Grinsztajn, Klemens Flöge, Oscar Key, Felix Birkel, Philipp Jund, Brendan Roof, Benjamin Jäger, Dominik Safaric, Simone Alessi, Adrian Hayler, et al. Tabpfn-2.5: Advancing the state of the art in tabular foundation models.arXiv preprint arXiv:2511.08667,
work page internal anchor Pith review arXiv
-
[12]
TabPFN: A Transformer That Solves Small Tabular Classification Problems in a Second
Noah Hollmann, Samuel Müller, Katharina Eggensperger, and Frank Hutter. Tabpfn: A transformer that solves small tabular classification problems in a second.arXiv preprint arXiv:2207.01848,
work page internal anchor Pith review arXiv
-
[13]
TabTransformer: Tabular data modeling using contextual embeddings,
Xin Huang, Ashish Khetan, Milan Cvitkovic, and Zohar Karnin. Tabtransformer: Tabular data modeling using contextual embeddings.arXiv preprint arXiv:2012.06678,
-
[14]
Ziming Liu, Yixuan Wang, Sachin Vaidya, Fabian Ruehle, James Halverson, Marin Soljačić, Thomas Y
URLhttps://proceedings.neurips.cc/paper_ files/paper/2017/file/6449f44a102fde848669bdd9eb6b76fa-Paper.pdf. Ziming Liu, Yixuan Wang, Sachin Vaidya, Fabian Ruehle, James Halverson, Marin Soljačić, Thomas Y. Hou, and Max Tegmark. Kan: Kolmogorov-arnold networks,
2017
-
[15]
KAN: Kolmogorov-Arnold Networks
URLhttps://arxiv.org/abs/2404.19756. Mattias Luber, Anton Thielmann, and Benjamin Säfken. Structural neural additive models: Enhanced interpretable machine learning.arXiv preprint arXiv:2302.09275,
work page internal anchor Pith review arXiv
-
[16]
URLhttps://doi.org/10.1214/08-AOAS167
doi: 10.1214/08-AOAS167. URLhttps://doi.org/10.1214/08-AOAS167. Soumya D Mohanty and Ethan Fahnestock. Adaptive spline fitting with particle swarm optimization.Com- putational Statistics, 36(1):155–191,
-
[17]
Warwick Nash, Tracy Sellers, Simon Talbot, Andrew Cawthorn, and Wes Ford
DOI: https://doi.org/10.24432/C5K306. Warwick Nash, Tracy Sellers, Simon Talbot, Andrew Cawthorn, and Wes Ford. Abalone. UCI Machine Learning Repository,
-
[18]
22 Peter Bjorn Nemenyi.Distribution-free multiple comparisons.Princeton University,
DOI: https://doi.org/10.24432/C55C7W. 22 Peter Bjorn Nemenyi.Distribution-free multiple comparisons.Princeton University,
-
[19]
URLhttps://arxiv.org/abs/1909.06312. Liudmila Prokhorenkova, Gleb Gusev, Aleksandr Vorobev, Anna Veronika Dorogush, and Andrey Gulin. Catboost: unbiasedboostingwithcategoricalfeatures. InProceedings of the 32nd International Conference on Neural Information Processing Systems, NIPS’18, pp. 6639–6649, Red Hook, NY, USA,
-
[20]
Curran Associates Inc. Jingang Qu, David Holzmüller, Gaël Varoquaux, and Marine Le Morvan. Tabicl: A tabular foundation model for in-context learning on large data.arXiv preprint arXiv:2502.05564,
-
[21]
Alex Shtoff, Elie Abboud, Rotem Stram, and Oren Somekh
doi: 10.1214/ss/1177012761. Alex Shtoff, Elie Abboud, Rotem Stram, and Oren Somekh. Function basis encoding of numerical features in factorization machines,
-
[22]
Ravid Shwartz-Ziv and Amitai Armon
URLhttps://arxiv.org/abs/2305.14528. Ravid Shwartz-Ziv and Amitai Armon. Tabular data: Deep learning is not all you need,
-
[23]
Tabular Data: Deep Learning is Not All You Need,
URL https://arxiv.org/abs/2106.03253. Gowthami Somepalli, Micah Goldblum, Avi Schwarzschild, C. Bayan Bruss, and Tom Goldstein. Saint: Improved neural networks for tabular data via row attention and contrastive pre-training,
-
[24]
SAINT: Improved neural networks for tabular data,
URL https://arxiv.org/abs/2106.01342. Shriyank Somvanshi, Subasish Das, Syed Aaqib Javed, Gian Antariksa, and Ahmed Hossain. A survey on deep tabular learning,
-
[25]
Steven Spiriti, Randall Eubank, Philip W Smith, and Dennis Young
URLhttps://arxiv.org/abs/2410.12034. Steven Spiriti, Randall Eubank, Philip W Smith, and Dennis Young. Knot selection for least-squares and penalized splines.Journal of Statistical Computation and Simulation, 83(6):1020–1036,
-
[26]
Learnable numerical input normalization for tabular representation learning based on b-splines
Min-Kook Suh, Moonjung Eo, Ye Seul Sim, and Woohyung Lim. Learnable numerical input normalization for tabular representation learning based on b-splines. InNeurIPS 2024 Third Table Representation Learning Workshop,
2024
-
[27]
Mambular: A sequential model for tabular deep learning, 2025
Anton Frederik Thielmann, Manish Kumar, Christoph Weisser, Arik Reuter, Benjamin Säfken, and Soheila Samiee. Mambular: A sequential model for tabular deep learning.arXiv preprint arXiv:2408.06291,
-
[28]
DOI: https://doi.org/10.24432/C5ZS3N. Simon N. Wood. Thin plate regression splines.Journal of the Royal Statistical Society Series B: Statistical Methodology, 65(1):95–114, 01
-
[29]
ISSN 1369-7412. doi: 10.1111/1467-9868.00374. URLhttps://doi. org/10.1111/1467-9868.00374. Simon N Wood.Generalized additive models: an introduction with R. chapman and hall/CRC,
-
[30]
Xiyuan Zhang, Danielle C Maddix, Junming Yin, Nick Erickson, Abdul Fatir Ansari, Boran Han, Shuai Zhang, Leman Akoglu, Christos Faloutsos, Michael W Mahoney, et al. Mitra: Mixed synthetic priors for enhancing tabular foundation models.arXiv preprint arXiv:2510.21204,
-
[31]
Liangwewi Nathan Zheng, Wei Emma Zhang, Lin Yue, Miao Xu, Olaf Maennel, and Weitong Chen. Free- knots kolmogorov-arnold network: On the analysis of spline knots and advancing stability.arXiv preprint arXiv:2501.09283,
-
[32]
B Dataset Details We benchmark on 25 tabular datasets, including 13 regression and 12 classification datasets, of which 3 are multiclass. The datasets are drawn from OpenML and the UCI Machine Learning Repository.12 Table 3 reports per-dataset statistics, including the numbers of numerical and categorical features, split sizes, and class imbalance where a...
1994
-
[33]
IP 1 19 3730 414 1036 50.1% OpenML: 44084 Loan Status LS 5 8 18905 2100 5251 77.7% OpenML: 44556 Multiclass Air Quality (4-class) AQ 1 8 3600 400 1000 40.0% OpenML: 46880 Loan Type (7-class) LT 0 6 6154 683 1709 27.9% OpenML: 46511 Shuttle (7-class) SH 0 9 18000 2000 5000 78.6% OpenML: 40685 Table 3: Benchmark datasets used in the experiments. For each da...
2000
-
[34]
Embedding: ΦM j (xj) = ( M (p) j,1 (xj),...,M (p) j,mj(xj) )
Support:Each M-spline basis function has compact support on supp ( M (p) j,ℓ ) = [τj,ℓ,τj,ℓ+p+1). Embedding: ΦM j (xj) = ( M (p) j,1 (xj),...,M (p) j,mj(xj) ) . C.4 I-Spline Basis Definition I-splines are integrated M-splines and yield monotone (non-decreasing) basis functions. We follow the basis indexing convention in Appendix C.1. We use the same knot ...
2021
-
[35]
We report the configurations for target- aware PLE binning and target-aware spline knot placement using CART and LightGBM
28 Method Variant Component Non-adaptive (fixed) Adaptive (range) PLE CART-based Output sizem={7,15,30}min_bins= 5 max_bins= 50 Tree regularizationmin_samples_leaf= 1 min_samples_split= 2 min_samples_leaf= 25 min_samples_split= 2 Splines CART-based Output sizem={7,15,30}– Tree / knot constraintsmax_depth= 6 min_knot_spacing= 0.01 – Splines LightGBM-based ...
2006
-
[36]
Two methods are considered significantly different if|¯ra−¯rb|>CD
6N , whereqαis the critical value of the Studentized range used by the Nemenyi test. Two methods are considered significantly different if|¯ra−¯rb|>CD. CD diagrams are widely used in modern ML and DL benchmarking to summarize average ranks and statistically indistinguishable groups across many datasets (Feuer et al., 2024; Kadra et al., 2024). In our sett...
2024
-
[37]
J.1 Knot Relocation During Training To complement the ablation on encoding resolution, we include a small qualitative experiment on the same synthetic regression task to visualize how learnable knot locations evolve during training. Using the same MLP setup as in the main experiments, we fix the numerical encoding size tom= 10basis functions per feature a...
-
[38]
Dataset and preprocessing abbreviations are given in Tables 3 and 2 respectively
Mean NRMSE (↓)±standard deviation over 5-fold cross-validation. Dataset and preprocessing abbreviations are given in Tables 3 and 2 respectively. Bold indicates the lowest NRMSE for each dataset within each backbone. 34 Backbone Method AB CA CPU DI HS P A WI FW H8 PR PU SG SU MLP STD 0.4610±0.020 0.2751±0.021 0.0456±0.007 0.0581±0.006 0.1638±0.008 0.6641±...
-
[39]
Dataset and preprocessing abbreviations are given in Tables 3 and 2 respectively
Mean NRMSE (↓)±standard deviation over 5-fold cross-validation. Dataset and preprocessing abbreviations are given in Tables 3 and 2 respectively. Bold indicates the lowest NRMSE for each dataset within each backbone. 35 Backbone Method AB CA CPU DI HS P A WI FW H8 PR PU SG SU MLP STD 0.4610±0.020 0.2751±0.021 0.0456±0.007 0.0581±0.006 0.1638±0.008 0.6641±...
-
[40]
Dataset and preprocessing abbreviations are given in Tables 3 and 2 respectively
Mean NRMSE (↓)±standard deviation over 5-fold cross-validation. Dataset and preprocessing abbreviations are given in Tables 3 and 2 respectively. Bold indicates the lowest NRMSE for each dataset within each backbone. 36 Backbone Method AD BA CH FI MA AQ EEG GT IP LS L T SH MLP STD 0.9017±0.004 0.8907±0.007 0.8425±0.011 0.7871±0.005 0.8857±0.006 0.9934±0.0...
-
[41]
For multiclass datasets, AUC corresponds to weighted one-vs-rest ROC-AUC
Mean AUC (↑)±standard deviation over 5-fold cross-validation. For multiclass datasets, AUC corresponds to weighted one-vs-rest ROC-AUC. Dataset and preprocessing abbreviations are given in Tables 3 and 2 respectively. Bold indicates the highest AUC for each dataset within each backbone. 37 Backbone Method AD BA CH FI MA AQ EEG GT IP LS L T SH MLP STD 0.90...
-
[42]
For multiclass datasets, AUC corresponds to weighted one-vs-rest ROC-AUC
Mean AUC (↑)±standard deviation over 5-fold cross-validation. For multiclass datasets, AUC corresponds to weighted one-vs-rest ROC-AUC. Dataset and preprocessing abbreviations are given in Tables 3 and 2 respectively. Bold indicates the highest AUC for each dataset within each backbone. 38 Backbone Method AD BA CH FI MA AQ EEG GT IP LS L T SH MLP STD 0.90...
discussion (0)
Sign in with ORCID, Apple, or X to comment. Anyone can read and Pith papers without signing in.