Recognition: unknown
Evaluating Deep Learning Models for Multiclass Classification of LIGO Gravitational-Wave Glitches
Pith reviewed 2026-05-10 16:59 UTC · model grok-4.3
The pith
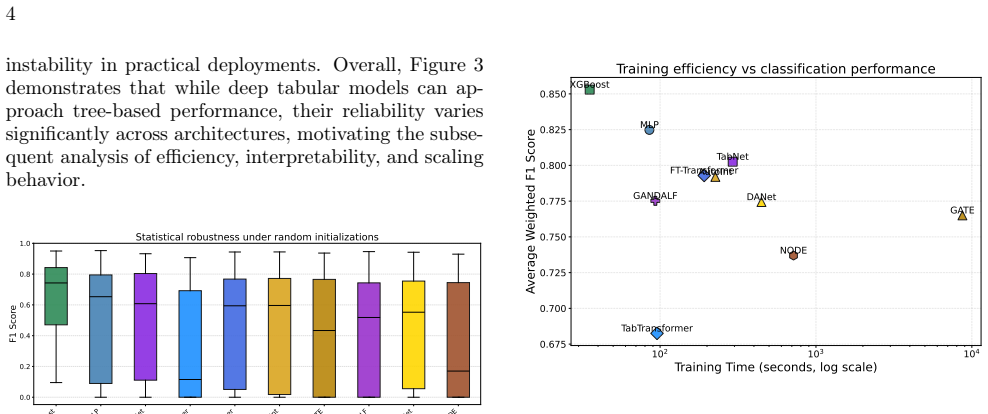
Several deep learning models classify LIGO gravitational-wave glitches as well as tree-based methods but use far fewer parameters.
A machine-rendered reading of the paper's core claim, the machinery that carries it, and where it could break.
Core claim
While gradient-boosted decision trees serve as strong baselines, several neural architectures achieve comparable multiclass classification accuracy on Gravity Spy tabular features with substantially lower parameter counts, display unique data-scaling patterns, and share partially overlapping feature attribution rankings.
What carries the argument
Benchmark of gradient-boosted trees against neural architectures (multilayer perceptrons, attention-based models, neural decision ensembles) on numerical glitch metadata, with evaluation of parameter efficiency, scaling behavior, and cross-model attribution consistency.
If this is right
- Deep learning models become viable for resource-limited deployment in LIGO characterization pipelines.
- Data efficiency varies by architecture, so training set size can be chosen to match the selected model.
- Shared feature priorities across models suggest stable physical markers for certain glitch classes.
- Interpretability tools can be applied more confidently when attributions align between architectures.
Where Pith is reading between the lines
- The approach could transfer to tabular anomaly detection in other large-scale physics experiments.
- Consistent feature rankings may help isolate universal glitch signatures that do not depend on model choice.
- Live-stream testing on current LIGO data would directly check whether the reported efficiencies hold in operations.
Load-bearing premise
The numerical features extracted from the Gravity Spy dataset are sufficiently informative and representative for the classification results to generalize to real LIGO detector operations.
What would settle it
A new test set of labeled glitches drawn from a later LIGO observing run where deep learning models fall below tree-based accuracy or lose their partial attribution consistency.
Figures


read the original abstract
Gravitational-wave detectors are affected by short-duration non-Gaussian noise transients, commonly referred to as glitches, which can obscure astrophysical signals and complicate downstream analyses. While recent work has demonstrated the effectiveness of deep learning models for glitch classification using image-based time-frequency representations, comparatively less attention has been given to systematic evaluations of machine-learning architectures operating directly on tabular glitch metadata. In this work, we present a comprehensive benchmark of classical and deep learning models for multiclass glitch classification using numerical features derived from the Gravity Spy dataset. We compare gradient-boosted decision trees with a diverse set of neural architectures, including multilayer perceptrons, attention-based models, and neural decision ensembles, and evaluate them in terms of classification performance, inference efficiency, parameter efficiency, data-scaling behavior, and cross-model interpretability alignment. We find that while tree-based methods remain strong baselines for tabular data, several deep learning models achieve competitive performance with substantially fewer parameters and exhibit distinct inductive biases and scaling behavior. A cross-model attribution analysis further reveals partially consistent feature-importance hierarchies across architectures, providing new insight into interpretability structure in tabular models. These results clarify trade-offs between performance, complexity, data efficiency, and interpretability in tabular gravitational-wave analyses and provide practical guidance for deploying machine-learning models in detector characterization pipelines.
Editorial analysis
A structured set of objections, weighed in public.
Referee Report
Summary. The manuscript presents a benchmark comparing gradient-boosted decision trees against deep learning architectures (MLPs, attention-based models, neural decision ensembles) for multiclass classification of LIGO glitches using numerical features extracted from the Gravity Spy dataset. Models are evaluated on classification performance, parameter/inference efficiency, data-scaling behavior, and cross-model interpretability via attribution methods. The central claims are that selected deep learning models achieve competitive accuracy with substantially fewer parameters, exhibit distinct inductive biases and scaling, and display partially consistent feature-importance hierarchies across architectures, thereby clarifying trade-offs for tabular gravitational-wave analyses.
Significance. If the empirical results hold under scrutiny, the work offers practical value for LIGO detector-characterization pipelines by identifying efficient, interpretable alternatives to tree-based baselines on tabular glitch metadata. The inclusion of scaling curves and cross-architecture attribution analysis is a positive contribution beyond standard benchmarks, as it highlights inductive biases relevant to glitch morphology. The study is grounded in a public dataset and standard supervised-learning procedures.
major comments (2)
- The claim that the results provide 'practical guidance for deploying machine-learning models in detector characterization pipelines' (abstract and conclusion) rests on the untested assumption that Gravity Spy numerical features and fixed splits generalize to non-stationary live LIGO data; no experiments on distribution shifts, unseen glitch morphologies, or integration with operational pipelines are reported, which directly affects the applicability of the performance and interpretability findings.
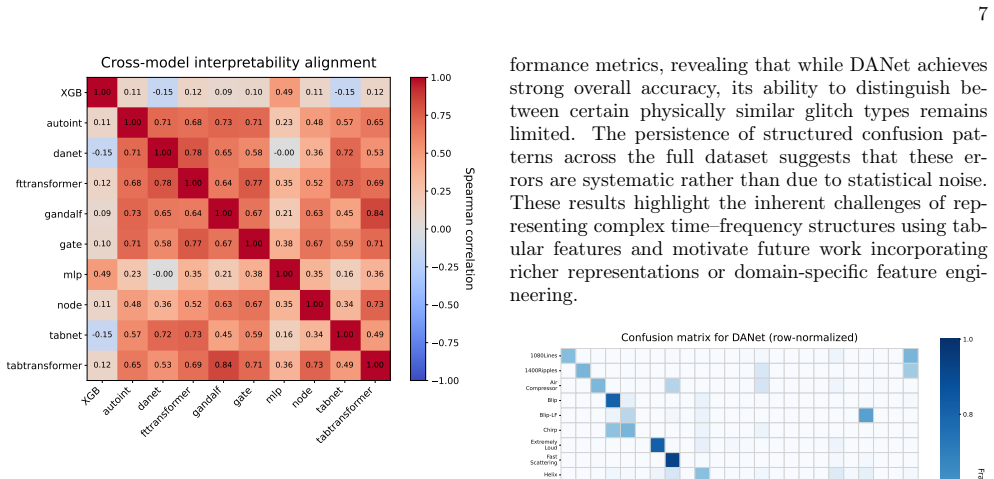
- In the interpretability section, the statement that attribution analysis 'reveals partially consistent feature-importance hierarchies' lacks a quantitative measure of consistency (e.g., average rank correlation or overlap statistics across model pairs); without this, it is difficult to assess whether the observed alignment is statistically meaningful or merely qualitative.
minor comments (2)
- The methods section should explicitly report the hyperparameter search procedure, random seeds, and any post-hoc feature selection or augmentation choices to enable full reproducibility of the reported performance gaps.
- Tables comparing parameter counts and inference times would benefit from explicit units and confidence intervals; scaling plots should include error bands to reflect variability across data subsets.
Simulated Author's Rebuttal
We thank the referee for the constructive and detailed feedback. The comments highlight important limitations in the scope of our benchmark and the rigor of our interpretability claims. We address each point below and indicate the revisions we will make to the manuscript.
read point-by-point responses
-
Referee: The claim that the results provide 'practical guidance for deploying machine-learning models in detector characterization pipelines' (abstract and conclusion) rests on the untested assumption that Gravity Spy numerical features and fixed splits generalize to non-stationary live LIGO data; no experiments on distribution shifts, unseen glitch morphologies, or integration with operational pipelines are reported, which directly affects the applicability of the performance and interpretability findings.
Authors: We agree that the manuscript does not perform experiments on live LIGO streams, distribution shifts, or unseen morphologies, as the study is confined to the public Gravity Spy dataset with its fixed train/test splits. While Gravity Spy features are extracted from actual LIGO data and the dataset supports ongoing detector characterization, this does not substitute for direct validation on non-stationary operational data. In the revised manuscript we will qualify the practical-guidance language in both the abstract and conclusion to make clear that the recommendations are benchmark-derived rather than deployment-ready, and we will add a dedicated limitations paragraph discussing the need for future work on streaming data and morphological generalization. revision: yes
-
Referee: In the interpretability section, the statement that attribution analysis 'reveals partially consistent feature-importance hierarchies' lacks a quantitative measure of consistency (e.g., average rank correlation or overlap statistics across model pairs); without this, it is difficult to assess whether the observed alignment is statistically meaningful or merely qualitative.
Authors: The referee is correct that our description of consistency remained qualitative. We will strengthen the interpretability section by adding quantitative metrics: specifically, we will compute pairwise Spearman's rank correlation coefficients between the feature-attribution rankings produced by each model pair, report the mean correlation together with its standard deviation, and include p-values to indicate statistical significance. These results will be presented in a new table (or as an extension to the existing attribution figure) so that readers can directly evaluate the degree of alignment. revision: yes
Circularity Check
No circularity: empirical benchmark on public dataset
full rationale
This paper performs a standard supervised-learning benchmark comparing gradient-boosted trees and neural architectures on numerical features extracted from the public Gravity Spy dataset. All reported metrics, scaling curves, and attribution rankings are computed directly from fixed data splits and model training runs. No derivations, fitted parameters renamed as predictions, self-citation chains, or ansatzes are present; the central claims rest on observable performance differences rather than any reduction to the inputs by construction.
Axiom & Free-Parameter Ledger
free parameters (2)
- neural network hyperparameters
- data split ratios and augmentation choices
Reference graph
Works this paper leans on
-
[1]
B. P. Abbott, R. Abbott, T. D. Abbott, M. R. Aber- nathy, F. Acernese, K. Ackley, C. Adams, T. Adams, P. Addesso, R. X. Adhikari,et al., Physical review let- ters116, 061102 (2016)
2016
-
[2]
A. Abac, I. Abouelfettouh, F. Acernese, K. Ackley, C. Adamcewicz, S. Adhicary, D. Adhikari, N. Ad- hikari, R. Adhikari, V. Adkins,et al., arXiv preprint arXiv:2508.18082 (2025)
work page internal anchor Pith review arXiv 2025
-
[3]
Cuoco, J
E. Cuoco, J. Powell, M. Cavaglià, K. Ackley, M. Bejger, C. Chatterjee, M. Coughlin, S. Coughlin, P. Easter, R. Essick,et al., Machine Learning: Science and Tech- nology2, 011002 (2020)
2020
-
[4]
Cuoco, M
E. Cuoco, M. Cavaglià, I. S. Heng, D. Keitel, and C. Messenger, Living Reviews in Relativity28, 1 (2025)
2025
-
[5]
Zevin, S
M. Zevin, S. Coughlin, S. Bahaadini, E. Besler, N. Ro- hani, S. Allen, M. Cabero, K. Crowston, A. K. Kat- saggelos, S. L. Larson,et al., Classical and quantum gravity34, 064003 (2017)
2017
-
[6]
Glanzer, S
J. Glanzer, S. Banagiri, S. Coughlin, S. Soni, M. Zevin, 10 C. P. L. Berry, O. Patane, S. Bahaadini, N. Rohani, K. Crowston,et al., Classical and Quantum Gravity 40, 065004 (2023)
2023
-
[7]
Y. Wu, M. Zevin, C. P. Berry, K. Crowston, C. Østerlund, Z. Doctor, S. Banagiri, C. B. Jackson, V. Kalogera, and A. K. Katsaggelos, Classical and Quantum Gravity42, 165015 (2025)
2025
-
[8]
Zevin, C
M. Zevin, C. B. Jackson, Z. Doctor, Y. Wu, C. Øster- lund, L. C. Johnson, C. P. Berry, K. Crowston, S. B. Coughlin, V. Kalogera,et al., The European Physical Journal Plus139, 100 (2024)
2024
-
[9]
S. Soni, C. P. L. Berry, S. B. Coughlin, M. Harandi, C. B. Jackson, K. Crowston, C. Østerlund, O. Patane, A. K. Katsaggelos, L. Trouille,et al., Classical and Quantum Gravity38, 195016 (2021)
2021
-
[10]
George, H
D. George, H. Shen, and E. A. Huerta, Phys. Rev. D 97, 101501 (2018)
2018
-
[11]
Fernandes, S
T. Fernandes, S. Vieira, A. Onofre, J. C. Bustillo, A. Torres-Forné, and J. A. Font, Classical and Quan- tum Gravity40, 195018 (2023)
2023
-
[12]
Razzano and E
M. Razzano and E. Cuoco, Classical and Quantum Gravity35, 095016 (2018)
2018
-
[13]
Bahaadini, N
S. Bahaadini, N. Rohani, S. Coughlin, M. Zevin, V. Kalogera, and A. K. Katsaggelos, in2017 ieee in- ternational conference on acoustics, speech and signal processing (icassp)(IEEE, 2017) pp. 2931–2935
2017
-
[14]
J. Yan, A. P. Leung, and C. Hui, Monthly Notices of the Royal Astronomical Society515, 4606 (2022)
2022
-
[15]
Powell, L
J. Powell, L. Sun, K. Gereb, P. D. Lasky, and M. Doll- mann, Classical and Quantum Gravity40, 035006 (2023)
2023
-
[16]
Oshino, Y
S. Oshino, Y. Sakai, M. Meyer-Conde, T. Uchiyama, Y. Itoh, Y. Shikano, Y. Terada, and H. Takahashi, Physics Letters B , 139938 (2025)
2025
-
[17]
Y. Li, Y. Wu, and A. K. Katsaggelos, inProceedings of the IEEE/CVF Conference on Computer Vision and Pattern Recognition(2024) pp. 6837–6846
2024
-
[18]
D. Srivastava and A. Niedzielski, arXiv preprint arXiv:2510.06273 (2025)
-
[19]
A.-K. Malz, G. Ashton, and N. Colombo, Physical Re- view D111, 084078 (2025)
2025
-
[20]
Meijer, M
Q. Meijer, M. Lopez, D. Tsuna, and S. Caudill, Phys. Rev. D109, 022006 (2024)
2024
-
[21]
Licciardi, D
A. Licciardi, D. Carbone, L. Rondoni, and A. Nagar, Physical Review D111, 084044 (2025)
2025
-
[22]
A closer look at deep learning methods on tabular datasets, 2025
H.-J. Ye, S.-Y. Liu, H.-R. Cai, Q.-L. Zhou, and D.-C. Zhan, arXiv preprint arXiv:2407.00956 (2024)
-
[23]
S. Ö. Arik and T. Pfister, inProceedings of the AAAI conference on artificial intelligence, Vol. 35 (2021) pp. 6679–6687
2021
-
[24]
TabTransformer: Tabular data modeling using contextual embeddings,
X. Huang, A. Khetan, M. Cvitkovic, and Z. Karnin, arXiv preprint arXiv:2012.06678 (2020)
-
[25]
Gorishniy, I
Y. Gorishniy, I. Rubachev, V. Khrulkov, and A. Babenko, Advances in neural information process- ing systems34, 18932 (2021)
2021
-
[26]
W. Song, C. Shi, Z. Xiao, Z. Duan, Y. Xu, M. Zhang, and J. Tang, inProceedings of the 28th ACM interna- tional conference on information and knowledge man- agement(2019) pp. 1161–1170
2019
-
[27]
M. S. Mia, A. A. B. Voban, A. B. H. Arnob, A. Naim, M. K. Ahmed, and M. S. Islam, in2023 International Conference on the Cognitive Computing and Complex Data (ICCD)(IEEE, 2023) pp. 51–62
2023
- [28]
- [29]
-
[30]
Pytorch tabular: A framework for deep learning with tabular data,
M. Joseph, “Pytorch tabular: A framework for deep learning with tabular data,” (2021), arXiv:2104.13638 [cs.LG]. Appendix: Appendix A - Scaling with Data Volume To provide additional context on how different models respond to increased data availability, we examine per- formancechangeswhenscalingthetrainingsetsizefrom a sampled subset of approximately50,0...
discussion (0)
Sign in with ORCID, Apple, or X to comment. Anyone can read and Pith papers without signing in.