Recognition: unknown
Climate-Driven Dengue Forecasting in Bangladesh: Division-Specific Feature-Set Design and Lag Structure
Pith reviewed 2026-05-10 05:45 UTC · model grok-4.3
The pith
Division-specific climate feature sets and lag structures yield the lowest-error dengue forecasts for Dhaka and Barishal.
A machine-rendered reading of the paper's core claim, the machinery that carries it, and where it could break.
Core claim
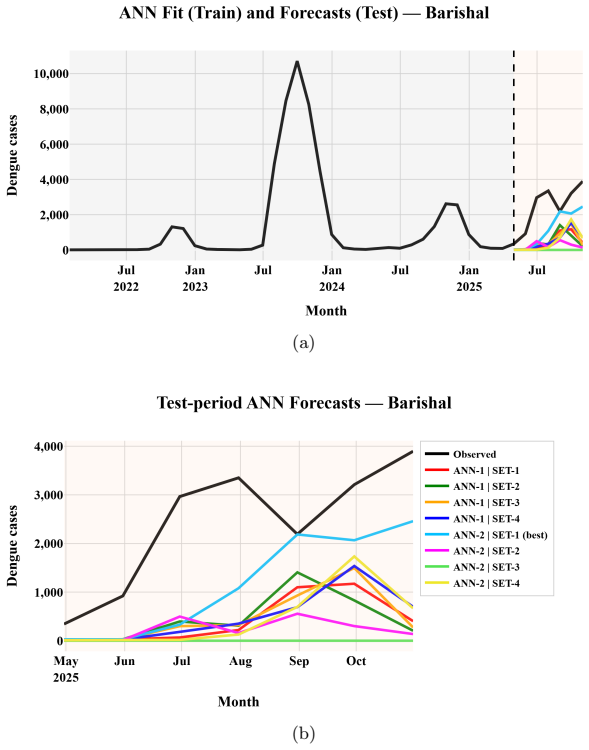
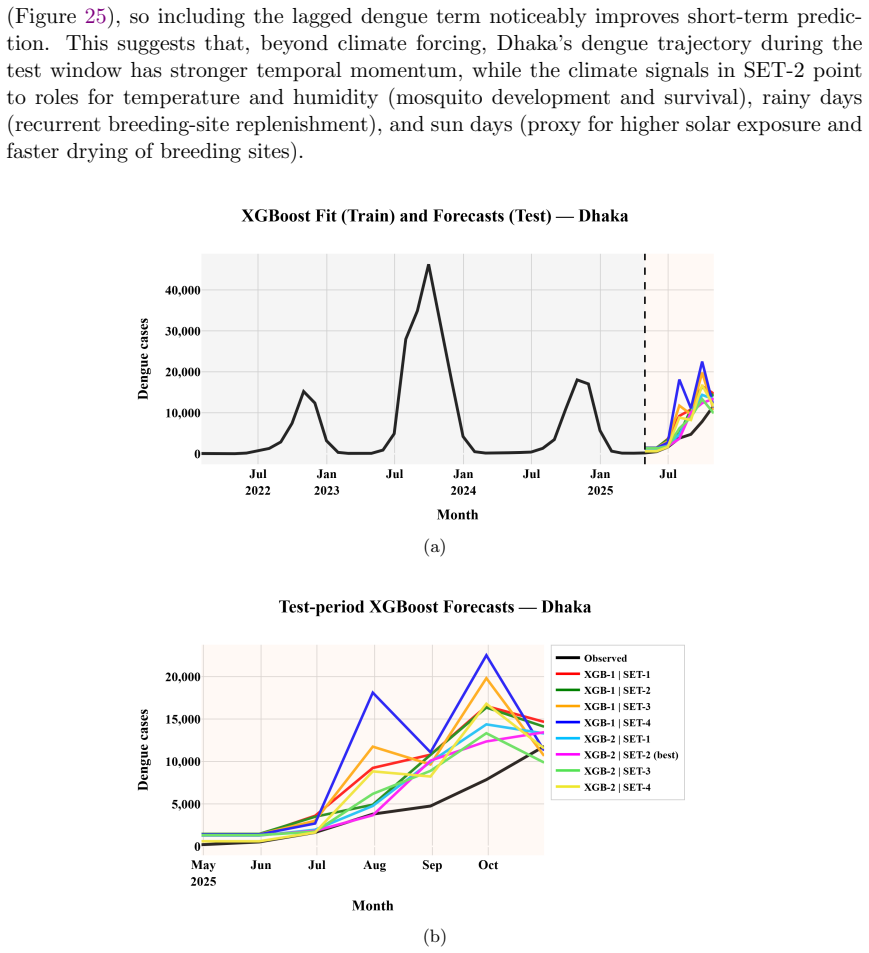
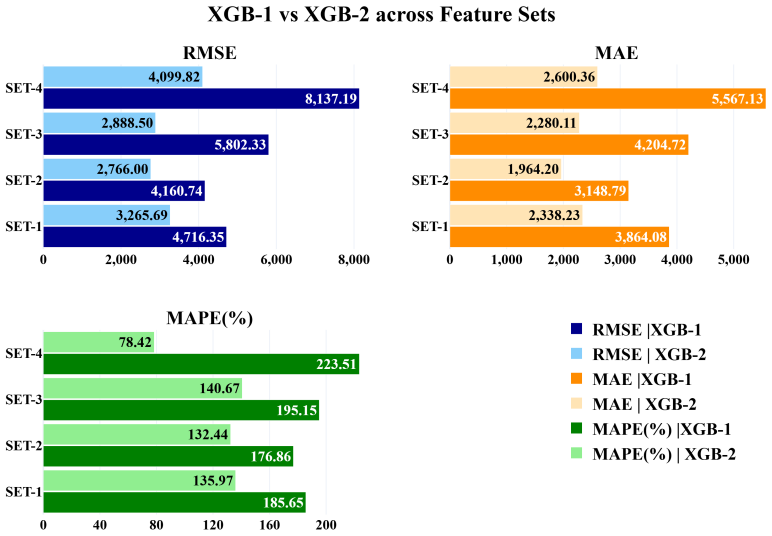
By varying the representation of wetness and sunshine in four climate feature sets and applying consistent 0–4 month lags to monthly dengue records, the authors show that an artificial neural network paired with one particular feature set produces the lowest errors for Dhaka while a seasonal autoregressive integrated moving average model paired with a different feature set performs best for Barishal.
What carries the argument
Division-specific feature-set design that creates four variants by alternating rainfall versus rainy days and sun hours versus sun days, then combines them with 0–4 month climate lags and an optional one-month lagged dengue term.
Load-bearing premise
The chosen 0–4 month lags and hand-designed feature sets capture stable relationships with dengue incidence rather than chance patterns that appear only in the 46-month data window.
What would settle it
If the recommended feature sets and models produce markedly higher forecast errors when applied to dengue incidence recorded after October 2025, the stability of the lag structures and feature choices would be contradicted.
Figures


read the original abstract
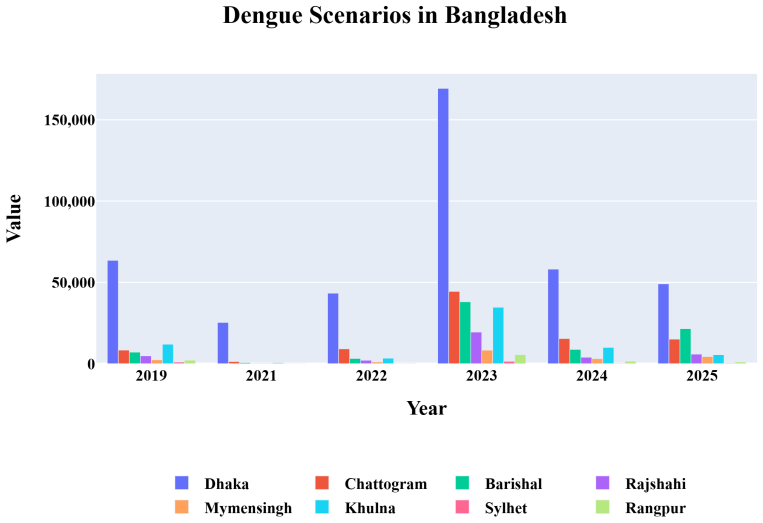
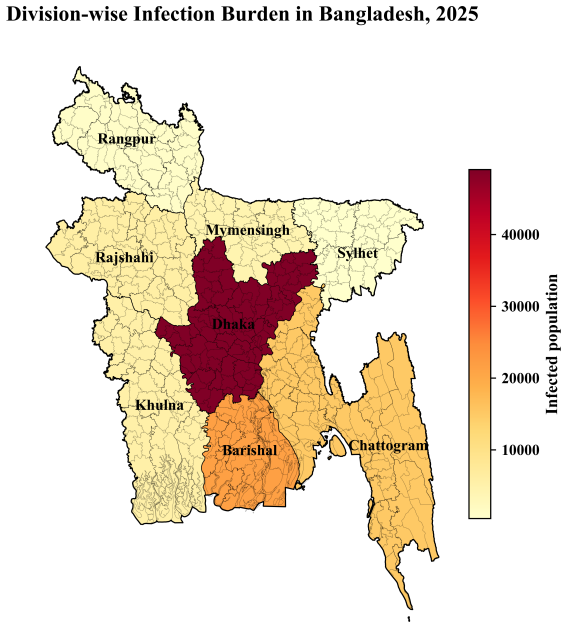
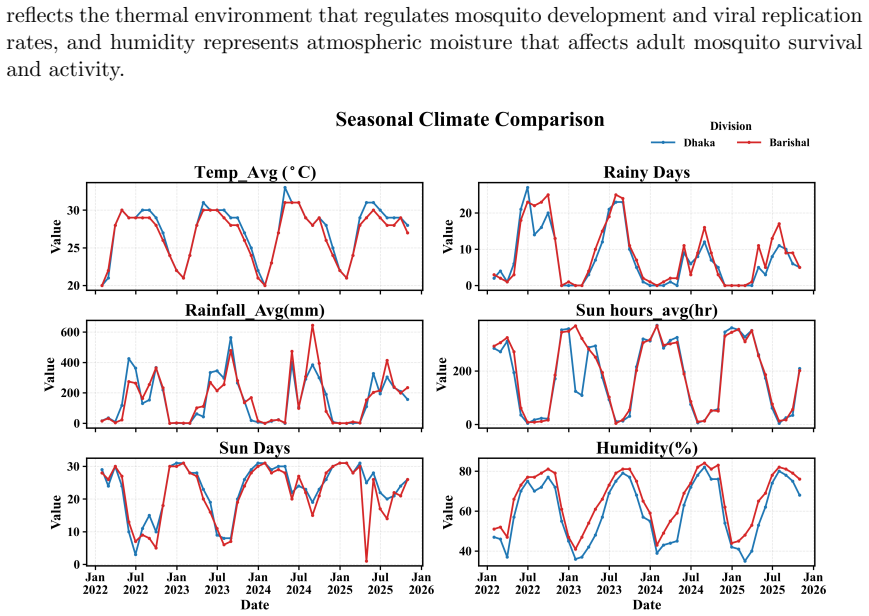
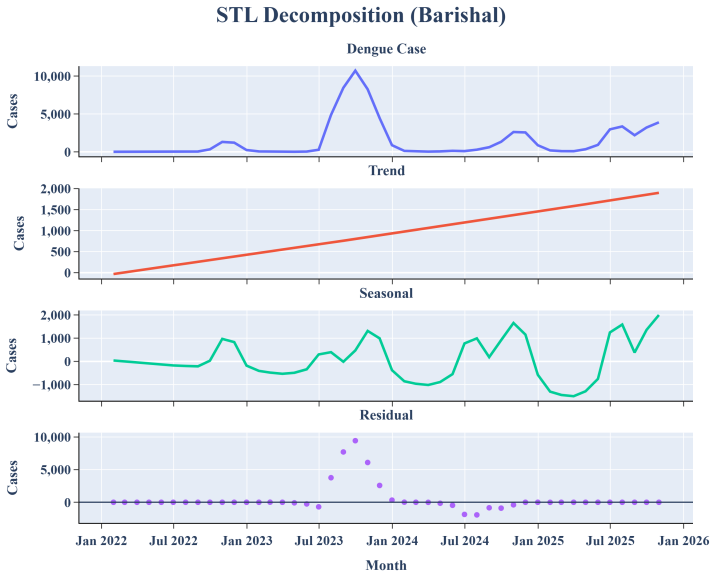
Bangladesh exhibits marked year-to-year variability in dengue, partly driven by meteorological fluctuations that shape \textit{Aedes} breeding-site persistence, mosquito development, and transmission. We exploit a contrast between Dhaka (consistently high burden) and Barishal (recently rising burden despite lower population density) and frame feature-set design and predictor structure as the main methodological contributions. Using monthly dengue data from DGHS \cite{DGHS} and meteorological data from World Weather Online \cite{Weather} for January 2022--October 2025, we compare four climate feature sets that vary wetness (rainy days vs.\ rainfall) and sunshine (sun days vs.\ sun hours), while temperature and humidity appear in all sets. We evaluate two predictor configurations: lagged climate covariates only, and lagged climate covariates plus 1-month lagged dengue incidence ($Y_{t-1}$). Climate lags (0--4 months) are applied in correlation and forecasting. Both divisions show similar delayed associations: rainfall metrics peak positively near a 2-month lag, humidity near a 1-month lag, sunshine metrics are most negative around a 2-month lag, and temperature is weakly positive at longer lags. We then benchmark MPR, ANN, XGBoost, and SARIMAX across all sets. Best performance differs: Dhaka favors ANN-1 with SET-1 (RMSE=2176.70, MAE=1282.00, MAPE=31.54\%), whereas Barishal favors SARIMAX(0,1,1)(1,0,0,12) with SET-2 (RMSE=817.56, MAE=717.78, MAPE=39.96\%). Analyses use consistent monthly aggregation and division-specific tuning.
Editorial analysis
A structured set of objections, weighed in public.
Referee Report
Summary. The manuscript claims that division-specific climate feature sets (varying wetness and sunshine metrics, with temperature and humidity common) and lag structures (0-4 months selected via correlation) enable improved dengue forecasting in Bangladesh. Using 46 monthly observations (Jan 2022-Oct 2025) from DGHS and World Weather Online, it benchmarks MPR, ANN, XGBoost, and SARIMAX models and reports that Dhaka performs best with ANN-1 + SET-1 (RMSE=2176.70, MAE=1282.00, MAPE=31.54%) while Barishal performs best with SARIMAX(0,1,1)(1,0,0,12) + SET-2 (RMSE=817.56, MAE=717.78, MAPE=39.96%), with similar delayed climate associations in both divisions.
Significance. If the performance differences hold under proper temporal validation, the work could contribute to localized dengue forecasting by showing that feature-set design and model choice vary meaningfully across divisions. The explicit reporting of lag correlations (rainfall positive at ~2 months, humidity at ~1 month, sunshine negative at ~2 months) and concrete error metrics for each model-feature combination provides transparency and a basis for replication. However, the short series and tuning process limit generalizability claims.
major comments (3)
- [Abstract] Abstract: The best-model claims rest on RMSE/MAE/MAPE values obtained after selecting lags 0-4 and tuning four hand-designed feature sets plus model hyperparameters on the identical 46-month series; no train/test split, rolling-origin CV, or blocked temporal validation is described, so the quoted metrics (e.g., Dhaka ANN-1 RMSE=2176.70) are not demonstrably out-of-sample.
- [Abstract] Abstract (lag and feature selection): Correlation-based lag choice and division-specific feature-set tuning are performed on the full data later used for fitting; this circularity means the reported performance advantage of ANN-1/SET-1 over other combinations in Dhaka (and SARIMAX/SET-2 in Barishal) may reflect capitalization on noise rather than stable climate-dengue relationships.
- [Abstract] Abstract (model comparison): With n≈46 and flexible models (ANN, XGBoost, seasonal SARIMAX) plus multiple feature variants, the assertion that 'best performance differs' between divisions lacks supporting statistical tests for error differences or evidence that the division-specific tuning does not overfit the limited sample.
minor comments (2)
- [Abstract] The abstract states the period as January 2022--October 2025 but does not explicitly note the resulting 46 observations; adding this would help readers immediately gauge sample-size constraints.
- [Abstract] Abbreviations such as 'ANN-1', 'SET-1', and the exact composition of the four feature sets are used in the abstract without prior definition, forcing readers to consult later sections for interpretation.
Simulated Author's Rebuttal
We thank the referee for the careful and constructive review. The comments correctly identify key limitations in validation and the risks of overfitting with a short time series. We address each point below and commit to revisions that incorporate proper temporal validation, separated selection procedures, and statistical comparisons while preserving the exploratory value of the division-specific analysis.
read point-by-point responses
-
Referee: The best-model claims rest on RMSE/MAE/MAPE values obtained after selecting lags 0-4 and tuning four hand-designed feature sets plus model hyperparameters on the identical 46-month series; no train/test split, rolling-origin CV, or blocked temporal validation is described, so the quoted metrics (e.g., Dhaka ANN-1 RMSE=2176.70) are not demonstrably out-of-sample.
Authors: We agree that the reported metrics are in-sample because no explicit train/test split or rolling-origin CV is described in the current manuscript. With only 46 observations, further splitting reduces statistical power, but this does not justify omitting validation. In the revised manuscript we will add a rolling-origin cross-validation procedure (using the first 34 months for training and expanding the test window) and report out-of-sample RMSE/MAE/MAPE for the final selected models. This will allow readers to evaluate whether the performance differences persist under temporal validation. revision: yes
-
Referee: Correlation-based lag choice and division-specific feature-set tuning are performed on the full data later used for fitting; this circularity means the reported performance advantage of ANN-1/SET-1 over other combinations in Dhaka (and SARIMAX/SET-2 in Barishal) may reflect capitalization on noise rather than stable climate-dengue relationships.
Authors: The referee accurately notes the circularity. Lag selection (0-4 months) and feature-set design were performed on the full series to identify biologically plausible structures supported by prior dengue literature. To correct this, the revision will separate the processes: lag and feature selection will be conducted on an initial training window only, with model evaluation performed on a subsequent held-out period. We will also report the raw correlation coefficients for each lag and division independently of the forecasting results. revision: yes
-
Referee: With n≈46 and flexible models (ANN, XGBoost, seasonal SARIMAX) plus multiple feature variants, the assertion that 'best performance differs' between divisions lacks supporting statistical tests for error differences or evidence that the division-specific tuning does not overfit the limited sample.
Authors: We accept that formal statistical tests are needed to support claims of differential performance across divisions. The revision will include Diebold-Mariano tests for pairwise forecast accuracy comparisons and bootstrap confidence intervals around the error metrics. We will also add an explicit limitations paragraph discussing the small sample size, the exploratory character of the division-specific tuning, and the fact that similar lag patterns (rainfall ~2 months, humidity ~1 month) appear in both divisions, providing partial corroboration despite the limited n. revision: yes
Circularity Check
Lag selection via correlation inspection and division-specific model tuning on the full 46-month series makes reported 'best performance' in-sample fitted results
specific steps
-
fitted input called prediction
[Abstract (lag application and benchmarking paragraphs)]
"Climate lags (0--4 months) are applied in correlation and forecasting. ... We then benchmark MPR, ANN, XGBoost, and SARIMAX across all sets. Best performance differs: Dhaka favors ANN-1 with SET-1 (RMSE=2176.70, MAE=1282.00, MAPE=31.54%), whereas Barishal favors SARIMAX(0,1,1)(1,0,0,12) with SET-2 (RMSE=817.56, MAE=717.78, MAPE=39.96%)."
Lags are selected by inspecting correlations on the identical 46-month series later used for model fitting and evaluation; feature sets are hand-designed and models are chosen by minimizing the same performance metrics on this data, so the reported 'best performance' values are statistically forced by the selection process rather than out-of-sample forecasts.
full rationale
The paper's central claim identifies division-specific optimal models and feature sets via RMSE/MAE/MAPE on the Jan 2022–Oct 2025 data. Lags 0–4 are chosen after correlation analysis on that same series, four feature sets are hand-designed, and four model families are benchmarked with per-division tuning. No train/test split, rolling CV, or blocked validation is described in the abstract, so the quoted performance numbers reduce to results of selection and fitting on the target observations rather than independent predictions. This matches the 'fitted input called prediction' pattern exactly. No self-citation load-bearing, ansatz smuggling, or self-definitional steps appear; the derivation is otherwise self-contained against external benchmarks.
Axiom & Free-Parameter Ledger
free parameters (3)
- Climate lag window
- Feature-set variants
- Model hyperparameters
axioms (2)
- domain assumption Monthly aggregation preserves the relevant transmission dynamics
- domain assumption Lagged climate variables are exogenous to dengue incidence
Reference graph
Works this paper leans on
-
[1]
Daily Dengue Status Report
Directorate General of Health Services [DGHS]. Daily Dengue Status Report. Bangladesh Ministry of Health and Family Welfare. Retrieved November 10, 2025, fromhttps://old.dghs.gov.bd/index.php/bd/home/ 5200-daily-dengue-status-report
2025
-
[2]
Bangladesh weather
World Weather Online. Bangladesh weather. InWorld Weather Online. Re- trieved November 21, 2025, fromhttps://www.worldweatheronline.com/ bangladesh-weather.aspx
2025
-
[3]
Lee, S. H., Nam, K. W., Jeong, J. Y., Yoo, S. J., Koh, Y. S., Lee, S., ... & Lee, K. H. (2013). The effects of climate change and globalization on mosquito vectors: evidence from Jeju Island, South Korea on the potential for Asian tiger mosquito (Aedes albopictus) influxes and survival from Vietnam rather than Japan.PloS one, 8(7), e68512.https://doi.org/...
-
[4]
Simo, F. B. N., Bigna, J. J., Kenmoe, S., Ndangang, M. S., Temfack, E., Moundipa, P. F., & Demanou, M. (2019). Dengue virus infection in people residing in Africa: a systematic review and meta-analysis of prevalence studies.Scientific reports, 9(1), 13626.https://doi.org/10.1038/s41598-019-50135-x
-
[5]
Ong, J., Aik, J., and Ng, L. C. (2021). Short report: AdultAedesabundance and risk of dengue transmission.PLoS Neglected Tropical Diseases, 15(6), e0009475.https: //doi.org/10.1371/journal.pntd.0009475
-
[6]
Murray, N. E. A., Quam, M. B., and Wilder-Smith, A. (2013). Epidemiology of dengue: Past, present and future prospects.Clinical Epidemiology, 5, 299–309. https://doi.org/10.2147/CLEP.S34440 40
-
[7]
(2024, April 16).Life cy- cle of Aedes mosquitoes.https://www.cdc.gov/mosquitoes/about/ life-cycle-of-aedes-mosquitoes.html
Centers for Disease Control and Prevention. (2024, April 16).Life cy- cle of Aedes mosquitoes.https://www.cdc.gov/mosquitoes/about/ life-cycle-of-aedes-mosquitoes.html
2024
-
[8]
Nasirian, H. (2025). Factors influencing establishment of dengue fever vectors in urban areas.East Mediterr Health J, 31(3), 163-165
2025
-
[9]
Haider, M., & Turner, J. (2015). Variables that may affect the transmission of dengue–a case study for health management in Asia.Topics in Public Health
2015
-
[10]
E., Hossain, S., and Hanesiak, J
Islam, S., Haque, C. E., Hossain, S., and Hanesiak, J. (2021). Climate variability, dengue vector abundance and dengue fever cases in Dhaka, Bangladesh: a time-series study.Atmosphere, 12, 905.https://doi.org/10.3390/atmos12070905
-
[11]
P., Zhou, W., Ren, C., Marshall, J., & Yuan, H
Hossain, M. P., Zhou, W., Ren, C., Marshall, J., & Yuan, H. Y. (2022). Prediction of dengue annual incidence using seasonal climate variability in Bangladesh between 2000 and 2018.PLOS Global Public Health, 2(5), e0000047.https://doi.org/10. 1371/journal.pgph.0000047
2022
-
[12]
Hossain, S., Islam, M. M., Hasan, M. A., Chowdhury, P. B., Easty, I. A., Tusar, M. K., ... & Bashar, K. (2023). Association of climate factors with dengue incidence in Bangladesh, Dhaka City: A count regression approach.Heliyon, 9(5).https: //doi.org/10.1016/j.heliyon.2023.e16053
-
[13]
R., Sarker, I., & Bashar, K
Karim, M. R., Sarker, I., & Bashar, K. (2023). Changing patterns of climatic risk factors for the transmission of dengue fever in Bangladesh: count model ap- proach.Journal of Public Health, 33(8), 1607-1616.https://doi.org/10.1007/ s10389-023-02137-3
2023
-
[14]
Muurlink, O. T., Stephenson, P., Islam, M. Z., & Taylor-Robinson, A. W. (2018). Long-term predictors of dengue outbreaks in Bangladesh: A data mining approach. Infectious Disease Modelling, 3, 322–330.https://doi.org/10.1016/j.idm.2018. 11.004
-
[15]
Islam, S., Islam, M. S., & Kamrujjaman, M. (2025). Effectiveness of bed nets and media awareness in dengue control: A fuzzy analysis.Results in Control and Opti- mization,20, 100593.https://doi.org/10.1016/j.rico.2025.100593
-
[16]
Dey, S. K., Rahman, M. M., Howlader, A., Siddiqi, U. R., Uddin, K. M. M., Borhan, R., & Rahman, E. U. (2022). Prediction of dengue incidents using hospitalized pa- tients, metrological and socio-economic data in Bangladesh: A machine learning approach.PloS one, 17(7), e0270933.https://doi.org/10.1371/journal.pone. 0270933 41
-
[17]
Mobin, M. A., Kamrujjaman, M., Molla, M. M., & Chen, S. (2024). Analysis of a data driven vector-borne dengue transmission model for a tropical environment in Bangladesh.International Journal of Differential Equations,2024, Article 2959770. https://doi.org/10.1155/2024/2959770
-
[18]
Alam, K. E., Ahmed, M. J., Chalise, R., Rahman, M. A., Mathin, T. T., Bhuiyan, M. I. H., ... & Hossain, D. (2025). Time series analysis of dengue incidence and its association with meteorological risk factors in Bangladesh.Plos one, 20(8), e0323238. https://doi.org/10.1371/journal.pone.0323238
-
[19]
Chowdhury, A. H. (2025). Comparison of deep learning and gradient boosting: ANN Versus XGBoost for climate-based dengue prediction in Bangladesh.Health Science Reports, 8(4), e70714.https://doi.org/10.1002/hsr2.70714
-
[20]
Akter, T., Islam, M. T., Hossain, M. F., & Ullah, M. S. (2024). A comparative study between time series and machine learning technique to predict dengue fever in Dhaka city.Discrete Dynamics in Nature and Society, 2024(1), 2757381.https: //doi.org/10.1155/2024/2757381
-
[21]
J., Sultana, N., Das, A., Jui, F
Hossain, M. J., Sultana, N., Das, A., Jui, F. N., Islam, M. K., Rahman, M. M., & Rahman, M. M. (2024). Analysis of effects of meteorological variables on dengue incidence in Bangladesh using VAR and Granger causality approach.Frontiers in Public Health, 12, 1488742.https://doi.org/10.3389/fpubh.2024.1488742
-
[22]
A., Fahim, H., Althobaiti, T., Alsharif, N., & Saeed, N
Azeem, M., Javaid, S., Khalil, R. A., Fahim, H., Althobaiti, T., Alsharif, N., & Saeed, N. (2023). Neural networks for the detection of COVID-19 and other diseases: prospects and challenges.Bioengineering, 10(7), 850.https://doi.org/10.3390/ bioengineering10070850
2023
-
[23]
Bukhari, M. M., Alkhamees, B. F., Hussain, S., Gumaei, A., Assiri, A., & Ullah, S. S. (2021). An improved artificial neural network model for effective diabetes prediction. Complexity, 2021(1), 5525271.https://doi.org/10.1155/2021/5525271
-
[24]
H., & Mila, F
Noorunnahar, M., Chowdhury, A. H., & Mila, F. A. (2023). A tree based eXtreme Gradient Boosting (XGBoost) machine learning model to forecast the annual rice production in Bangladesh.PloS one, 18(3), e0283452.https://doi.org/10.1371/ journal.pone.0283452
2023
-
[25]
Guan, X., Du, Y., Ma, R., Teng, N., Ou, S., Zhao, H., & Li, X. (2023). Construction of the XGBoost model for early lung cancer prediction based on metabolic indices. BMC medical informatics and decision making, 23(1), 107.https://doi.org/10. 1186/s12911-023-02171-x 42
2023
-
[26]
(2022).Population & Housing Census 2022: Preliminary report (English)
Bangladesh Bureau of Statistics (BBS). (2022).Population & Housing Census 2022: Preliminary report (English). Statistics and Informatics Division, Ministry of Planning, Government of the People’s Republic of Bangladesh. Retrieved February 10, 2026, fromhttps://sid.portal.gov.bd/sites/default/files/files/sid. portal.gov.bd/publications/01ad1ffe_cfef_4811_a...
2022
-
[27]
Polwiang, S. (2020). The time series seasonal patterns of dengue fever and associ- ated weather variables in Bangkok (2003-2017).BMC infectious diseases, 20(1), 208. https://doi.org/10.1186/s12879-020-4902-6
-
[28]
Khondaker, F., Kamrujjaman, M., & Islam, M. S. (2025). Cost-effectiveness of dengue control strategies in Bangladesh: An optimal control and ACER-ICER analysis.Acta Tropica, 264, 107587.https://doi.org/10.1016/j.actatropica.2025.107587
-
[29]
Khondaker, F., & Kamrujjaman, M. (2025). Stochastic analysis of Mpox epidemi- ology with vaccination strategies and environmental persistence.Scientific Reports, 15(1), 44369.https://doi.org/10.1038/s41598-025-28135-x
-
[30]
Khondaker, F., Kamrujjaman, M., & Islam, M. S. (2022). Optimal control analysis of COVID-19 transmission model with physical distance and treatment.Advance in Biological Research, 3(1).https://doi.org/10.26855/abr.2022.12.001 43
discussion (0)
Sign in with ORCID, Apple, or X to comment. Anyone can read and Pith papers without signing in.