Recognition: 2 theorem links
· Lean TheoremRobustness of Spatio-temporal Graph Neural Networks for Fault Location in Partially Observable Distribution Grids
Pith reviewed 2026-05-11 01:44 UTC · model grok-4.3
The pith
STGNNs using measured-only graphs locate faults in partially observable grids with higher accuracy and six times faster training.
A machine-rendered reading of the paper's core claim, the machinery that carries it, and where it could break.
Core claim
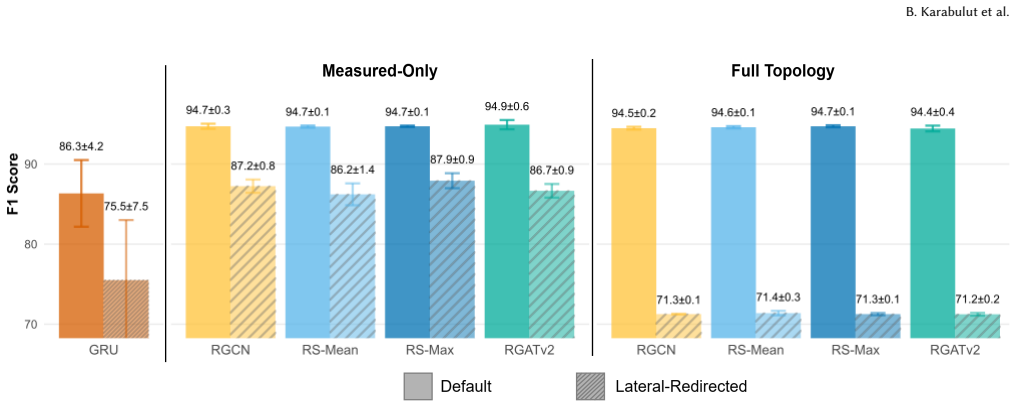
STGNN models based on GraphSAGE and GATv2, when using a measured-only topology, achieve superior fault location performance and efficiency in partially observable distribution grids, with up to 11 F1 point gains and 6-fold training speedups over full-topology alternatives and RNN baselines, plus greater stability with confidence intervals under 1.4%.
What carries the argument
The measured-only GNN topology that builds the graph exclusively from nodes with available measurements, enabling the STGNN to learn spatio-temporal patterns without full grid connectivity.
Load-bearing premise
The IEEE 123-bus feeder simulations with injected faults and chosen measurement locations accurately capture the behavior of real distribution grids under partial observability.
What would settle it
Running the trained models on actual fault event data from a real utility distribution grid and verifying if the reported performance gains remain.
Figures


read the original abstract
Fault location in distribution grids is critical for reliability and minimizing outage durations. Yet, it remains challenging due to partial observability, given sparse measurement infrastructure. Recent works show promising results by combining Recurrent Neural Networks (RNNs) and Graph Neural Networks (GNNs) for spatio-temporal learning. Still, many modern GNN architectures remain untested for this grid application, while existing GNN solutions have not explored GNN topology definitions beyond simply adopting the full grid topology to construct the GNN graph. We address these gaps by (i) systematically comparing a newly proposed graph-forming strategy (measured-only) to the traditional full-topology approach, and (ii) introducing STGNN (Spatio-temporal GNN) models based on GraphSAGE and an improved Graph Attention (GATv2), for distribution grid fault location; (iii) benchmarking them against state-of-the-art STGNN and RNN baselines on the IEEE 123-bus feeder. In our experiments, all evaluated STGNN variants achieve high performance and consistently outperform a pure RNN baseline, with improvements up to 11 percentage points F1. Among STGNN models, the newly explored RGATv2 and RGSAGE achieve only marginally higher F1 scores. Still, STGNNs demonstrate superior stability, with tight confidence intervals (within +/- 1.4%) compared to the RNN baseline (up to +/- 7.5%) across different experiment runs. Finally, our proposed reduced GNN topology (measured-only) shows clear benefits in both (i) model training time (6-fold reduction) and (ii) model performance (up to 11 points F1). This suggests that measured-only graphs offer a more practical, efficient, and robust framework for partially observable distribution grids.
Editorial analysis
A structured set of objections, weighed in public.
Referee Report
Summary. The paper proposes spatio-temporal GNNs (STGNNs) based on GraphSAGE and GATv2 for fault location in partially observable distribution grids. It introduces a measured-only graph topology (restricting nodes/edges to buses with measurements) versus the conventional full-grid topology, benchmarks these against RNN and other STGNN baselines on simulated faults in the IEEE 123-bus feeder, and reports that all STGNN variants outperform the RNN baseline (up to 11 F1 points) with tighter stability (CI within +/-1.4% vs. +/-7.5%), while the measured-only topology yields up to 11-point F1 gains and 6-fold training-time reduction.
Significance. If the empirical advantages hold under broader conditions, the work would demonstrate that reduced GNN topologies can simultaneously improve efficiency and accuracy for fault location under sparse measurements, while highlighting the stability benefits of STGNN architectures over pure RNNs. The consistent F1 improvements and stability metrics across runs are a positive empirical contribution for this application domain.
major comments (2)
- [Experiments / Results] The headline claims—that the measured-only topology delivers up to 11-point F1 gains and 6-fold training-time reduction, and that STGNNs are more stable—rest exclusively on results from a single IEEE 123-bus feeder with one fixed partial-observability pattern. No experiments on other feeders (IEEE 13-bus, 34-bus, or larger), varying measurement densities, or randomized sensor placements are reported, so it is unclear whether the observed benefits generalize or are artifacts of this specific topology and sensor configuration.
- [Methodology / Graph Construction] The paper provides no ablation or sensitivity analysis on how the measured-only graph construction interacts with different fault types, load conditions, or noise levels in the simulation. This is load-bearing for the practical recommendation, because the central claim is that measured-only graphs offer a “more practical, efficient, and robust framework for partially observable distribution grids.”
minor comments (2)
- [Abstract] The abstract (and presumably the main text) omits key experimental details: exact data-generation procedure for faults, hyperparameter search protocol, full list of baselines with their configurations, and any statistical significance tests supporting the reported F1 differences and confidence intervals.
- [Methodology] Notation for the reduced graph (e.g., how edges are pruned when nodes are removed) and the precise definition of the “improved Graph Attention (GATv2)” variant should be clarified with a small diagram or pseudocode for reproducibility.
Simulated Author's Rebuttal
We thank the referee for the constructive feedback on our manuscript. We address the two major comments below, acknowledging the limitations of the current experimental scope while providing the strongest honest defense of our contributions.
read point-by-point responses
-
Referee: [Experiments / Results] The headline claims—that the measured-only topology delivers up to 11-point F1 gains and 6-fold training-time reduction, and that STGNNs are more stable—rest exclusively on results from a single IEEE 123-bus feeder with one fixed partial-observability pattern. No experiments on other feeders (IEEE 13-bus, 34-bus, or larger), varying measurement densities, or randomized sensor placements are reported, so it is unclear whether the observed benefits generalize or are artifacts of this specific topology and sensor configuration.
Authors: We agree that the evaluation is confined to the IEEE 123-bus feeder under one fixed partial-observability pattern. This system is a standard, widely adopted benchmark in power-systems literature precisely because of its realistic size, topology, and load diversity; prior fault-location studies routinely use it as a representative case. The reported gains (up to 11 F1 points) and stability improvements (CI within ±1.4 %) are therefore meaningful for this practically relevant setting. Nevertheless, we recognize that broader validation across additional feeders, varying densities, and randomized placements would be required to claim full generalization. In the revised manuscript we will (i) explicitly qualify the scope of the claims, (ii) add a dedicated limitations paragraph citing the representativeness of the 123-bus case, and (iii) outline a clear roadmap for future multi-feeder experiments. We do not claim the benefits are universal; we claim they are demonstrated and practically useful on this established test system. revision: partial
-
Referee: [Methodology / Graph Construction] The paper provides no ablation or sensitivity analysis on how the measured-only graph construction interacts with different fault types, load conditions, or noise levels in the simulation. This is load-bearing for the practical recommendation, because the central claim is that measured-only graphs offer a “more practical, efficient, and robust framework for partially observable distribution grids.”
Authors: The simulation campaign already encompasses multiple fault types (single-line-to-ground, line-to-line, three-phase) and realistic load profiles drawn from the IEEE 123-bus data set; the measured-only versus full-topology comparison is performed across these scenarios. We did not, however, present dedicated sensitivity sweeps over additive noise levels or exhaustive per-factor ablations. We accept that such analyses would strengthen the robustness argument. In the revision we will insert a new subsection that (a) reports additional noise-sensitivity results obtained from the existing simulation pipeline and (b) discusses how the measured-only construction interacts with fault type and load variation, using the data already collected. This will directly support the practical recommendation without altering the core experimental design. revision: yes
Circularity Check
No significant circularity; purely empirical benchmarking with direct experimental outputs
full rationale
The paper contains no mathematical derivation chain, no parameters fitted to a subset and then presented as predictions, and no load-bearing self-citations that reduce the central claims to unverified inputs. All reported results (F1 improvements up to 11 points, 6-fold training-time reduction, confidence-interval stability) are direct experimental measurements from simulations on the IEEE 123-bus feeder under a fixed partial-observability pattern. The measured-only graph is explicitly defined by restricting nodes/edges to buses with available measurements; this is a construction choice, not a derived prediction. No equations or uniqueness theorems are invoked that collapse to the paper's own inputs.
Axiom & Free-Parameter Ledger
free parameters (2)
- GNN architecture hyperparameters
- Measurement subset selection
axioms (2)
- domain assumption The IEEE 123-bus feeder with injected faults is a faithful proxy for real partially observable distribution grids.
- domain assumption Fault location can be framed as a node classification task on a spatio-temporal graph.
Lean theorems connected to this paper
-
IndisputableMonolith/Cost/FunctionalEquation.leanwashburn_uniqueness_aczel unclear?
unclearRelation between the paper passage and the cited Recognition theorem.
We address these gaps by (i) systematically comparing a newly proposed graph-forming strategy (measured-only) to the traditional full-topology approach, and (ii) introducing STGNN models based on GraphSAGE and an improved Graph Attention (GATv2)
-
IndisputableMonolith/Foundation/AbsoluteFloorClosure.leanreality_from_one_distinction unclear?
unclearRelation between the paper passage and the cited Recognition theorem.
our proposed reduced GNN topology (measured-only) shows clear benefits in both (i) model training time (6-fold reduction) and (ii) model performance (up to 11 points F1)
What do these tags mean?
- matches
- The paper's claim is directly supported by a theorem in the formal canon.
- supports
- The theorem supports part of the paper's argument, but the paper may add assumptions or extra steps.
- extends
- The paper goes beyond the formal theorem; the theorem is a base layer rather than the whole result.
- uses
- The paper appears to rely on the theorem as machinery.
- contradicts
- The paper's claim conflicts with a theorem or certificate in the canon.
- unclear
- Pith found a possible connection, but the passage is too broad, indirect, or ambiguous to say the theorem truly supports the claim.
Reference graph
Works this paper leans on
-
[1]
L. Alzubaidi, J. Zhang, A. J. Humaidi, A. Al-Dujaili, Y. Duan, O. Al-Shamma, J. Santamaría, M. A. Fadhel, M. Al-Amidie, and L. Farhan. 2021. Review of deep learning: concepts, CNN architectures, challenges, applications, future directions. J. Big Data8, 1 (2021), 53. doi:10.1186/s40537-021-00444-8
-
[2]
S. Brody, U. Alon, and E. Yahav. 2022. How Attentive Are Graph Attention Networks?. InProc. Int. Conf. on Learning Representations (ICLR 2022). OpenRe- view.net, Virtual Event, 1–26. doi:10.48550/arXiv.2105.1449
-
[3]
Ricardo Fonseca Buzo, Henrique Molina Barradas, and Fábio Bertequini Leão
-
[4]
Power Del.36, 2 (2021), 651–662
A New Method for Fault Location in Distribution Networks Based on Voltage Sag Measurements.IEEE Trans. Power Del.36, 2 (2021), 651–662. doi:10. 1109/TPWRD.2020.2987892
-
[5]
R. Cahuantzi, X. Chen, and S. Guttel. 2023. A comparison of LSTM and GRU networks for learning symbolic sequences. InProc. Int. Conf. SAI Intell. Comput. (SAI 2023) (Lecture Notes in Networks and Systems, Vol. 739). Springer, Cham, Birmingham, UK, 722–740. doi:10.1007/978-3-031-37963-5_53
-
[6]
Y. Cao, J. Tang, S. Shi, D. Cai, L. Zhang, and P. Xiong. 2025. Fault Diagnosis Techniques for Electrical Distribution Network Based on Artificial Intelligence and Signal Processing: A Review.Processes13 (2025), 48. doi:10.3390/pr13010048
-
[7]
S. Chandran, R. Gokaraju, and K. Narendra. 2024. An extended impedance- based fault location algorithm in power distribution system with distributed generation using synchrophasors.IET Gener. Transm. Distrib.18, 3 (2024), 479–
work page 2024
-
[8]
doi:10.1049/gtd2.13086
-
[9]
K. Chen, J. Hu, Y. Zhang, Z. Yu, and J. He. 2020. Fault Location in Power Distribution Systems via Deep Graph Convolutional Networks.IEEE J. Sel. Areas Commun.38, 1 (Jan 2020), 119. doi:10.1109/JSAC.2019.2951964
-
[10]
K. Chen, C. Huang, and J. He. 2016. Fault detection, classification and location for transmission lines and distribution systems: a review on the methods.High Volt.1, 1 (2016), 25–33. doi:10.1049/hve.2016.0005
-
[11]
J. T. de Freitas and F. G. F. Coelho. 2021. Fault localization method for power distribution systems based on gated graph neural networks.Electr. Eng.103 (2021), 2259–2266. doi:10.1007/s00202-021-01223-7
-
[12]
M. Defferrard, X. Bresson, and P. Vandergheynst. 2016. Convolutional Neural Net- works on Graphs with Fast Localized Spectral Filtering. InProceedings of the 30th Annual Conference on Neural Information Processing Systems (NIPS 2016). Curran Associates, Inc., Barcelona, Spain, 3844–3852. doi:10.5555/3157382.3157527
-
[13]
M. Fan, J. Xia, H. Zhang, and X. Zhang. 2024. Fault Location Method of Dis- tribution Network Based on VGAE-GraphSAGE.Processes12, 10 (2024), 2179. doi:10.3390/pr12102179
-
[14]
Fast Graph Representation Learning with PyTorch Geometric
M. Fey and J. E. Lenssen. 2019. Fast Graph Representation Learning with PyTorch Geometric. arXiv preprint arXiv:1903.02428. doi:10.48550/arXiv.1903.02428
work page internal anchor Pith review doi:10.48550/arxiv.1903.02428 2019
-
[15]
M. Gori, G. Monfardini, and F. Scarselli. 2005. A New Model for Learning in Graph Domains.IEEE Trans. Neural Netw.20, 1 (2005), 61–80. doi:10.1109/TNN. 2008.2005605
work page doi:10.1109/tnn 2005
-
[16]
John J. Grainger and William D. Stevenson. 1994.Power System Analysis. McGraw- Hill, New York
work page 1994
-
[17]
S. S. Gururajapathy, H. Mokhlis, and H. A. Illias. 2017. Fault Location and Detec- tion Techniques in Power Distribution Systems with Distributed Generation: A Review.Renew. Sustain. Energy Rev.74 (2017), 949–958. doi:10.1016/j.rser.2017. 03.021
-
[18]
W. L. Hamilton, R. Ying, and J. Leskovec. 2017. Inductive Representation Learning on Large Graphs. InProc. 31st Conf. on Neural Inf. Process. Systems (NeurIPS 2017). Neural Information Processing Systems Foundation, Long Beach, CA, USA, 3345–
work page 2017
-
[19]
https://doi.org/10.5555/3294771.3294869
-
[20]
D. K. Hammond, P. Vandergheynst, and R. Gribonval. 2011. Wavelets on graphs via spectral graph theory.Appl. Comput. Harmon. Anal.30, 2 (2011), 129–150. doi:10.1016/j.acha.2010.04.005
-
[21]
Tin Kam Ho, J. J. Hull, and S. N. Srihari. 1994. Decision combination in multiple classifier systems.IEEE Trans. Pattern Anal. Mach. Intell.16, 1 (1994), 66–75. doi:10.1109/34.273716
-
[22]
Z. S. Hosseini, M. Mahoor, and A. Khodaei. 2018. AMI-Enabled Distribution Network Line Outage Identification via Multi-Label SVM.IEEE Trans. Smart Grid9, 5 (2018), 5470–5472. doi:10.1109/TSG.2018.2849845
-
[23]
2011.IEEE Standard for Synchrophasor Measurements for Power Systems
IEEE. 2011.IEEE Standard for Synchrophasor Measurements for Power Systems. doi:10.1109/IEEESTD.2011.6111219
-
[24]
IEEE 2022.IEEE Guide for Electric Power Distribution Reliability Indices. IEEE, Piscataway, NJ, USA. IEEE Std 1366-2022 (Revision of IEEE Std 1366-2012)
work page 2022
-
[25]
2023.Electricity Grids and Secure Energy Transitions
International Energy Agency. 2023.Electricity Grids and Secure Energy Transitions. Technical Report. IEA, Paris, France. https://www.iea.org/reports/electricity- grids-and-secure-energy-transitions
work page 2023
-
[26]
Thomas N. Kipf and Max Welling. 2017. Semi-Supervised Classification with Graph Convolutional Networks. InProceedings of the International Conference on Learning Representations (ICLR 2017). OpenReview.net, Toulon, France, 1–14. https://openreview.net/forum?id=S16sL79xl
work page 2017
-
[27]
R. Krishnathevar and E. E. Ngu. 2012. Generalized Impedance-Based Fault Location for Distribution Systems.IEEE Trans. Power Del.27, 1 (jan 2012), 449–
work page 2012
-
[28]
doi:10.1109/TPWRD.2011.2170773
-
[29]
W. Liao, B. Bak-Jensen, J. R. Pillai, and Y. Wang. 2022. A review of graph neural networks and their applications in power systems.J. Mod. Power Syst. Clean Energy10, 2 (2022), 345–360. doi:10.35833/MPCE.2021.000058
-
[30]
F. Liu, L. Xie, K. Yu, Y. Wang, X. Zeng, L. Bi, and X. Tang. 2023. A novel fault location method based on traveling wave for multi-branch distribution network. Electr. Power Syst. Res.224 (2023), 109753. doi:10.1016/j.epsr.2023.109753
-
[31]
H. Livani and C. Y. Evrenosoğlu. 2013. A Fault Classification and Localization Method for Three-Terminal Circuits Using Machine Learning.IEEE Trans. Power Deliv.28, 4 (Oct 2013), 2282–2290. doi:10.1109/TPWRD.2013.2272936
-
[32]
H. Livani, C. Y. Evrenosoğlu, and V. A. Centeno. 2013. A machine learning based faulty line identification for smart distribution network. InProc. N. Am. Power Symp. (NAPS 2013). IEEE, Manhattan, KS, USA, 1–5. doi:10.1109/NAPS.2013. 6666829
-
[33]
R. Llugsi, S. E. Yacoubi, A. Fontaine, and P. Lupera. 2021. Comparison between Adam, AdaMax and Adam W optimizers to implement a Weather Forecast based on Neural Networks for the Andean city of Quito. InProc. IEEE 5th Ecuador Tech. Chapters Meet. (ETCM 2021). IEEE, Cuenca, Ecuador, 1–6. doi:10.1109/ ETCM53643.2021.9590681
-
[34]
X. Ma, W. Zhen, H. Ren, G. Zhang, K. Zhang, and H. Dong. 2024. A Method for Fault Localization in Distribution Networks with High Proportions of Distributed Generation Based on Graph Convolutional Networks.Energies17, 22 (2024),
work page 2024
-
[35]
doi:10.3390/en17225758
-
[36]
M. MansourLakouraj, R. Hossain, H. Livani, and M. Ben-Idris. 2021. Application of graph neural network for fault location in PV penetrated distribution grids. In Robustness of STGNNs for Fault Location in Partially Observable Grids Proceedings of the North American Power Symposium (NAPS 2021). IEEE, College Station, TX, USA, 1–6. doi:10.1109/NAPS52732.202...
-
[37]
J. Momoh. 2012.Smart Grid: Fundamentals of Design and Analysis. IEEE Press/Wiley, Hoboken, NJ, USA
work page 2012
-
[38]
National Renewable Energy Laboratory (NREL). 2024. PyDSS Interface. https: //www.nrel.gov/grid/pydss.html
work page 2024
-
[39]
Q.-H. Ngo, B. L. H. Nguyen, J. Zhang, K. Schoder, H. Ginn, and T. Vu. 2025. Deep graph neural network for fault detection and identification in distribution systems.Electric Power Systems Research247 (2025), 111721. doi:10.1016/j.epsr. 2025.111721
-
[40]
B. L. H. Nguyen, T. Vu, T.-T. Nguyen, M. Panwar, and R. Hovsapian. 2022. 1-D Convolutional Graph Convolutional Networks for Fault Detection in Distributed Energy Systems. InProc. IEEE 1st Ind. Electron. Soc. Annu. On-Line Conf. (ONCON 2022). IEEE, kharagpur, India, 1–6. doi:10.1109/ONCON56984.2022.10126859
- [41]
-
[42]
M. Numair, A. A. Aboushady, and F. Arraño-Vargas. 2023. Fault detection and localisation in LV distribution networks using a smart meter data-driven digital twin.Energies16, 23 (2023), 7850. doi:10.3390/en16237850
-
[43]
A. Ojha, V. Panwar, and P. Kant. 2018. Optimization techniques for network reconfiguration in distribution systems: An overview.Natl. J. Multidiscip. Res.3, 3 (2018), 68–71
work page 2018
-
[44]
Adam Paszke, Sam Gross, Francisco Massa, Adam Lerer, James Bradbury, Gre- gory Chanan, Trevor Killeen, Zeming Lin, Natalia Gimelshein, Luca Antiga, Alban Desmaison, Andreas Kopf, Edward Yang, Zachary DeVito, Martin Raison, Alykhan Tejani, Sasank Chilamkurthy, Benoit Steiner, Lu Fang, Junjie Bai, and Soumith Chintala. 2019. PyTorch: An Imperative Style, Hi...
work page 2019
-
[45]
H. Rezapour, S. Jamali, and A. Bahmanyar. 2023. Review on Artificial Intelligence- Based Fault Location Methods in Power Distribution Networks.Energies16, 12 (2023), 4636. doi:10.3390/en16124636
- [46]
-
[47]
IEEE Transactions on Neural Networks20(1), 61–80 (2009) https://doi.org/10.1109/TNN.2008.2005605
F. Scarselli, M. Gori, A. Tsoi, M. Hagenbuchner, and G. Monfardini. 2009. The Graph Neural Network Model.IEEE Trans. Neural Netw.20, 1 (2009), 61–80. doi:10.1109/TNN.2008.2005605
-
[48]
The Electric Power Research Institute (EPRI). 2024. OpenDSS. https://www.epri. com/pages/sa/opendss
work page 2024
-
[49]
D. W. P. Thomas, R. J. O. Carvalho, and E. T. Pereira. 2003. Fault location in distribution systems based on traveling waves. InProc. IEEE Bologna PowerTech Conf. (IEEE 2003). IEEE, Bologna, Italy, 3. doi:10.1109/PTC.2003.1304595
-
[50]
S. Turizo, G. Ramos, and D. Celeita. 2022. Voltage Sags Characterization Using Fault Analysis and Deep Convolutional Neural Networks.IEEE Transactions on Industry Applications58, 3 (2022), 3367–3376. doi:10.1109/TIA.2022.3162569
-
[51]
Petar Veličković, Guillem Cucurull, Arantxa Casanova, Adriana Romero, Pietro Liò, and Yoshua Bengio. 2018. Graph Attention Networks. InProceedings of the International Conference on Learning Representations (ICLR 2018). OpenReview.net, Vancouver, BC, Canada, 1–12. doi:10.48550/arXiv.1710.10903
work page internal anchor Pith review Pith/arXiv arXiv doi:10.48550/arxiv.1710.10903 2018
-
[52]
S. Wang, Q. Fang, N. Li, M. Fan, and Y. Duan. 2026. Fault Location Method for Distribution Network Based on Temporal Graph Convolutional Network. InProceedings of 2025 Chinese Intelligent Automation Conference (CIAC 2025) (Lecture Notes in Electrical Engineering, Vol. 1501). Springer, Singapore, 456–468. doi:10.1007/978-981-95-4045-7_11
-
[53]
Z. Wang, B. Huang, B. Zhou, J. Chen, and Y. Wang. 2024. An Enhanced Fault Localization Technique for Distribution Networks Utilizing Cost-Sensitive Graph Neural Networks.Processes12, 11 (2024), 2312. doi:10.3390/pr12112312
-
[54]
T. Wei, H. Zhang, M. Fan, J. Sun, and X. Wang. 2024. Fault Location Method of Distribution Network Based on Improved Graph Neural Network. InProc. 9th Int. Conf. Power Renew. Energy (ICPRE 2024). IEEE, Guangzhou, China, 2024, 758–763. doi:10.1109/ICPRE62586.2024.10768568
-
[55]
J. Q. Yu, Y. Hou, A. Y. S. Lam, and V. O. K. Li. 2019. Intelligent fault detection scheme for microgrids with wavelet-based deep neural networks.IEEE Trans. Smart Grid.10, 2 (2019), 1694–1703. doi:10.1109/TSG.2017.2776310
-
[56]
L. Zhang, D. Hua, T. Ji, T. Qian, and J. Wang. 2025. Fault Location in Power Distribution Networks With Massive Missing Data: A Graph-Based Imputation and Contrastive Learning Approach.IEEE Transactions on Automation Science and Engineering22 (2025), 16825–16837. doi:10.1109/TASE.2025.3580658
discussion (0)
Sign in with ORCID, Apple, or X to comment. Anyone can read and Pith papers without signing in.